
Two devices that share data with each other are often referred to as endpoints with reference to Wireshark. As we have noticed and observed, if a host intends to talk to another host on the network, they would require some form of address to send and receive packets—yes, I am talking about the physical address that every device holds.
Every host is able to communicate with the help of an Network Interface Card (NIC) that holds a physical address (often termed as a MAC address), and the same address is used for communication over a local network. Devices that communicate in this kind of infrastructure are termed as endpoints. Wireshark gives us the facility of analyzing and collecting information regarding these two devices.
Let's say, for example, that we are observing heavy network traffic flowing across a network, which is kind of unusual according to our daily traffic pattern. Now, we want to figure out due to which device(s) the traffic pattern differs. For us, the Endpoints dialog comes to the rescue, which can be accessed from the Endpoints menu under Statistics, which looks something like the following screenshot. Before you go ahead and open the Endpoints dialog, simply click on any TCP packet from the Packet List pane. What you will see is a list of tabs visible at the top, each stating a different a protocol. Some of them will be shown as active, and some of them will be shown as inactive because if in your traffic you have a packet relating to a certain protocol, the tab listing that particular protocol will be shown as active; otherwise, it will be shown as inactive.
By default, you will be presented with the Ethernet tab (lists the Layer-2 MAC address) in most cases. Along with the protocol, you must observe a number that states the number of endpoints captured for that specific protocol. As in our case, we are seeing 3 and the same number of rows are visible in the Main pane.
In the Main pane, many more specific details can be seen for every endpoint, such as the total number of packets transferred, total number of bytes transferred, and total bytes and packets received and transmitted for an individual endpoint.
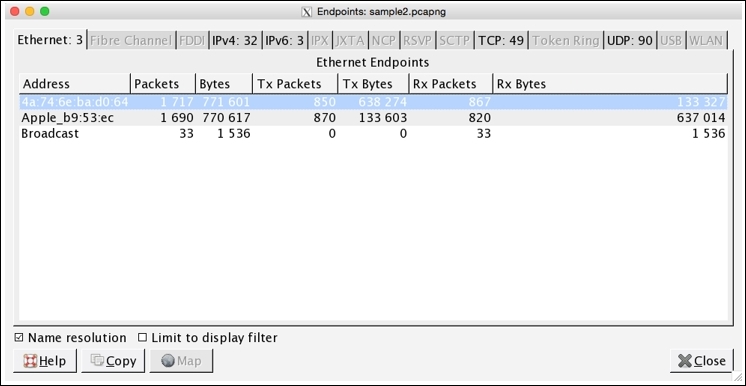
Figure 3.8: Endpoints window
Now, if you want to analyze other protocols, then simply click on any tab of your choice. I clicked on the IPv4 tab and sorted the main pane using the Packets column, which looks like the one shown in the following screenshot:
By just looking at the Endpoints dialog, I can now easily figure out that maximum data was transferred from IP 172.20.10.7. This could be a one single IP talking to some server or probably a server talking to multiple machines on our network at a moderate rate.

Figure 3.9: Endpoints dialog—IPv4v tab
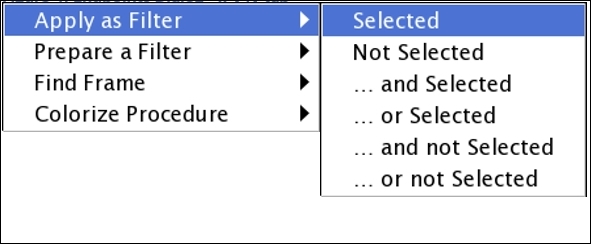
If you would like to dig more into it, we have an interesting option that can be taken advantage of; simply create a display filter for the same. To do so, right-click on the first row with most packets transferred and choose Selected under Apply as Filter, as shown in the following screenshot:
You will be able to see a display filter for the same Endpoint in the Display Filter dialog above the List pane, like the one shown here:
This facilitates us to quickly analyze traffic for a certain endpoint and hence increases the speed of analysis for users. Once you click on Clear, you will be presented with the same Endpoint dialog. At the bottom of the window, you will see two check boxes and a few buttons. The purpose of each is listed in the following:
- Name Resolution: This resolves the name of each of the Ethernet addresses listed in the Ethernet tab. But in some scenarios, it might affect the performance of the application adversely too, for example, when trying to resolve the unique IP addresses from a huge
pcapfile. - Limit to display filter: This limits the results of the Endpoint window on the basis of a display filter that you already applied before accessing the Endpoints window.
- Copy: This copies the content of the current Endpoints window tab in a CSV format (comma-separated values).
- Map: This maps the selected endpoint's location in your browser on the basis of its actual geographical location.