
The information in the Expert Infos dialog is populated by the dissectors that enable the translation of every protocol that is well known to Wireshark. The Expert Infos dialog keeps you aware of the specific states that users should know about. Presently, expert infos is available only for TCP-based communication. Maybe for other protocols, the Expert Info dialog will be available by the time you read this.
You can access the Expert Info dialog by clicking on Expert Info under Analyze, or you can click on the bottom-left corner on the colored dot just before the status bar. Refer to the following screenshot, which illustrates the same:

The red dot at the bottom-left corner can be colored with different colors, such as cyan, yellow, green, blue, and grey, where each of them has a specific meaning, which is listed as follows:
- Red: This indicates errors
- Yellow: This refers to warnings
- Cyan: This refers to a note
- Blue: This refers to chats
- Green: This refers to comments
- Grey: This means none
Now, let's have a look at the Expert Infos dialog and discuss various other elements residing within. Refer to the following screenshot for illustration purposes:
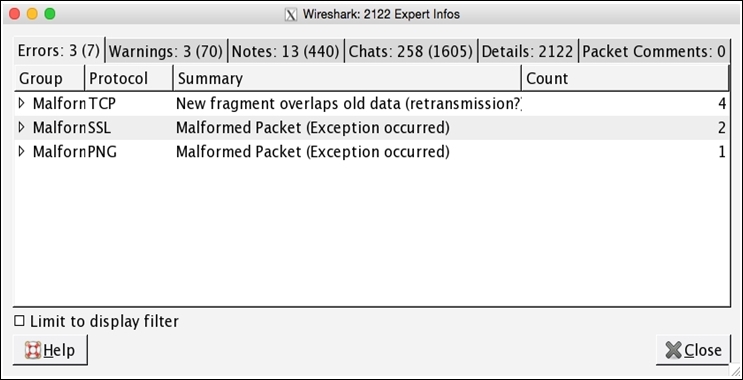
Figure 3.19: Expert Infos dialog
As you can observe, there are multiple tabs listed just below the title bar that consist of packets listed depending on their severity level and category of information. There are mainly four sections in the Expert Infos dialog that point to the likely cause of the problem, so double-checking it will be helpful. Each tab contains the name of the section and two numbers: one inside the parenthesis and one outside. The number inside the parenthesis denotes the total number of packets that have been flagged for the containing category, and the number outside denotes the total number of unique categories for the packets flagged.
We will go through each section one by one, and we will also summarize the criteria by which packets are flagged and listed under different categories, such as chat, note, warnings, details, and so on:
- Chat: These are general messages concerning the current communication. A packet that falls under this section is listed as follows:
- Window Update: This makes the sender aware that the TCP receive window size has been updated.
- Note: These are unusual messages that may or may not be part of the current normal communication. Packets that fall under this section are listed as follows:
- The Zero Window Probe: Suppose that the server receiving the packets from the client is not able to process the packets received at the same speed that the client is sending them, thus causing packet loss. In such cases, a server will send a Zero Window packet to the client to halt the process of sending packets for sometime while keeping the connection alive.
- The Keep Alive ACK: The receiver of the Keep Alive packets sends this ACK as a response.
- The Zero Window Probe ACK: This relates to the Zero Window Probe example. The Zero Window Probe ACK will be sent by the client in response to the server's request.
- Window is full: This notifies the sending host that the TCP-receiving window is currently full.
- TCP retransmission: The TCP packet is retransmitted again because of a duplicate ACK, packet loss, or if the timer for retransmission expires.
- The duplicate ACK: If you think about the TCP three-way handshake communication, for every packet received at the other end, the sender should get an ACK packet. If the receiver gets the packet with the sequence number that has already been received, then duplicate ACKs will be generated. This will happen in case of packet loss as well.
- Warning messages: These are unusual messages that are probably not a part of your general communication. Packets that fall under this section are listed as follows:
- Zero Window: These messages have been observed when the receiving side tries to notify the sender to stop sending for a while as the TCP-receiving window is full.
- Keep Alive: These messages will be observed when any Keep Alive messages have been captured in the communication.
- ACKed Lost Packet: These messages will be observed when an ACK for some lost packet is received.
- Previous Segment Lost: These messages will be observed when an unexpected packet is received out of sequence.
- Out of Order: These messages will be observed when are packets received in some random sequence, thus signifying no sequence.
- Fast Retransmission: These messages will be popped up when, in a short time of 20 milliseconds, duplicate ACKs have been transmitted again.
- Error: These are general error messages in the packets or are thrown by the dissector of a specific protocol translating it. There is no specific category in error messages.
- Details: Collectively, all Expert Info dialogs can be viewed in the details tab. However, it is advisable to look into each tab individually on the basis of their severity level. Pointing out the problems can be sometimes easy because the entries made in the details tab are lined up in the sequence as they were captured. Viewing anomalies through the details tab can be a bit time consuming and disadvantageous.
- Packet Comments: This refers to any annotations given regarding the trace file that can be used to share any interpretations further. Adding comments to the trace file can be really useful while documenting for future references. To add a comment to any packet of your choice, just right-click on the selected packet and click on Packet Comment. You will be presented with a dialog where you can add a comment of your choice, and the same comment will be visible in the Packet Comments section of the Expert Infos dialog. Adding a comment will also affect how a certain packet is shown in the Details pane. Generally, an extra field will be added to the details pane highlighted with a green background color.

Figure 3.20: Create filter using Expert Infos dialog
Unique categories presented in every section can be expanded to get more information about a specific packet. When you expand and click on the packet listed in the Expert Infos dialog, Wireshark will point you to the corresponding packet in the list pane that can be investigated further. Creating a display filter for every category is also possible; just right-click on the selected category and choose the type of filter you want to create. Refer to the following screenshot for illustration purposes:

The main motive of the Expert Infos dialog is to find the anomalies present in a trace file. Finding the network problems in the trace file for a novice user becomes a lot easier and faster. Viewing the Expert Infos dialog can give a better idea about the unusual behavior of network packets. As we already discussed, the Expert Infos dialog is available for protocols based on TCP/IP; for the rest, there is not much info available.
The best way to figure out juicy info is to look into the tabs separately instead of looking into the details tab because, as we discussed, it can be time consuming and can lead to various misunderstandings. Users like you are not supposed to rely completely on Expert Infos; sometimes, the file you trace will contain anomalies that won't be listed in the Expert Infos dialog. May be, manual analysis will be required as well.
The protocol field that is shown in the details pane of the selected packet will be colored as per the severity level of the Expert Infos dialog; take a look at the following screenshot for further reference:
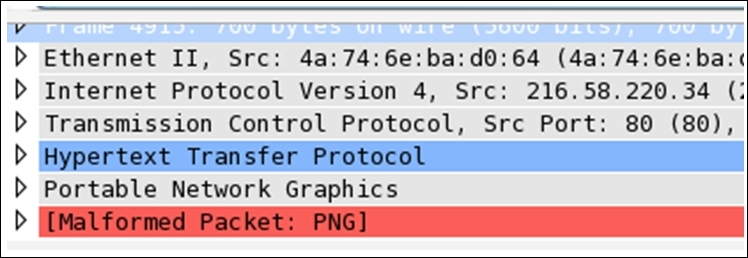
Figure 3.21: Colorization rules in protocol field
We can easily identify from the preceding screenshot that for this particular packet, there is an entry in the Error and Chat sections (red color denotes Error and blue denotes Chats). It is also possible that a single packet is listed in two sections of the Expert Infos dialog.