
SMTP is used widely to send and receive emails over small, as well as large, infrastructures (can be public or private). The protocol uses the Sender-SMTP process to send e-mails and the Receiver-SMTP process to receive emails. This makes SMTP a client-server-based protocol that runs over port 25. However, many mail server admins follow the secure practice of changing the default port number for SMTP to any other random port that prevents the server from sending any spams out there in the wild and even keep the server out-of-reach from malicious users.
Most commonly, an SMTP channel for mail transfer is created using a TCP three-way handshake that happens between two hosts, which is followed by a series of SMTP packets. For illustration purpose, I configured one SMTP server on 192.168.1.105 and a client on 192.168.1.104. The client will request the server to send an e-mail to an address known to the client. The server will respond to this request with numerical code, followed by a brief response parameter. For understanding the real functioning of the protocol, I will be using the following architecture.

Using the netcat client from Kali Linux, I will try connecting to the SMTP mail service running on a Windows machine. Once a dedicated channel is created between the server and the client, the server indicates that it is ready to accept any commands sent in. Also, the server will respond with numerical codes with a short summary. I followed these steps to connect and send an e-mail:
- Open a connection using netcat
nc –nv 192.168.1.105 25. - Initialize an SMTP session using the
HELO testmailcommand. - Specify the
fromaddress using theMAIL FROM:<[email protected]>command. - Specify the recipient's address using the
RCPTS TO:<[email protected]>command. - To enter data into the mail body, type
DATAand press Enter. Now, type the message you wish to send. Once you are finished writing your email, type a.to mark the ending and press Enter. - Now, your message will be sent. If you wish to send more emails, follow the same procedure; or else, you can close your connection with the mail server. Type
QUITto do so.
The series of commands I followed generated a couple of packets that contain details about the session in a very granular form. I also created a capture filter, which captured only the packets associated with the client and server that would help me in closely analyzing the packets related to the session; and preventing other packets entering the list pane. All of these commands mentioned will only work when the server is configured to permit clear text message communication without any authentication, refer to the following screenshot depiction for similar behavior.

Figure 4.19: SMTP session
Packets from 1-3 are TCP-handshake packets. The handshake is happening between the client and the server. In the fourth packet, the client receives a message stating 220 as the response code. This means the server is ready and available to respond to the client's request. In the sixth packet, the client initializes the standard SMTP session using the HELO command (You must be wondering why most of the packets listed in the list pane start with C or S. Requests sent from the client are marked with the character C, and server responses are marked with character S.). Then, enter the sender's and recipient's e-mail addresses, which were confirmed to be correct by the server, with response code 250 in packets 10 and 13. After that, enter the e-mail body using the DATA command, which was successfully received by the server in packet 23. In the end, the user gracefully closes the connection by issuing the QUIT command, which the server confirmed in packet 26, thus sending the FIN, ACK.
Now, I will introduce you to the dark side of SMTP that you might have witnessed, or you will someday. By dark side, I meant the packets that are not supposed to pop up inside the list pane usually. However, if they do, then you have to look into your protocol configuration. For this, I would like to introduce you to some quite common scenarios that you should be aware of.
The first and foremost case I can think of is when the server and the client are not able to create a dedicated channel for communication; in short, the TCP handshake did not go well. This can happen because of many reasons, such as the mail server daemon is not running, the mail server is not running on the default port, the mail server daemon has reached the maximum simultaneous client connections allowed or connections from a particular subnet are not allowed there can be multiple scenarios related to this. The following list pane depicts two kinds of traffic abnormalities:

Figure 4.20: SMTP unusual traffic
The first two packets were generated due to an error, which stopped the TCP handshake from occurring. This error can be generated due to many factors, some of which are mentioned here:
- Mail server daemon is not running
- Mail server daemon default port is changed
- Mail server daemon has reached the maximum simultaneous connections limit (DDoS attack).
- Mail server's configuration has been tampered with
Let's suppose now, that the client came to know about the correct port number to which the connection should be initiated, but still, the session was not created successfully. Observe the traffic starting from packet 3 to the packet 10, the last packet. A TCP three-way handshake happened, but then, suddenly, the client was kicked off from the session. What could be the possible reason for such a response from the server? Perhaps the client is not allowed to get connected because of some restrictions in place, such as IP or MAC filtering.
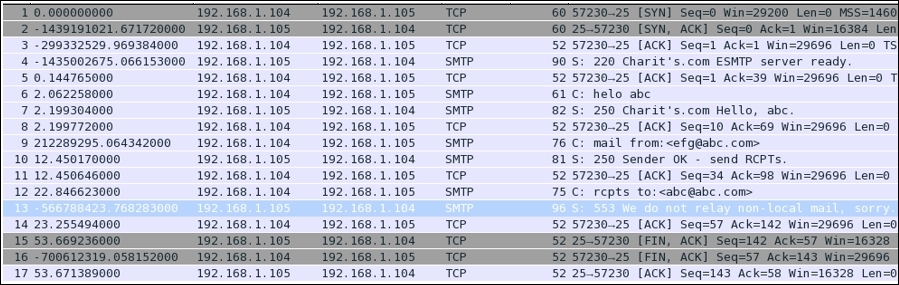
Figure 4.21: Client not allowed to get connected due to some restrictions
Another type of abnormal traffic that can be seen widely these days is harvesting of e-mails used by spammer and spamming botnets roaming in the wild. A spammer tries to harvest emails from the publicly accessible mail servers to verify which email address is valid and which isn't. For example, look at the following screenshot (Figure 4.15) where a malicious user tries to verify the existence of an e-mail ID using the E-mail From field, verification of e-mail addresses can alos be done using VRFY command. Depending on the response, the user will come to know whether the email is valid or not. Observe packet number 13 for the server's response. These kinds of attacks are done using a custom-made dictionary file, which matches the current domain requirements. Once an email is verified, the spammer can perform various forms of social-engineering attacks. A response code greater than 350 in SMTP protocol is probably some kind of error that can reduce your network performance, thus increasing the latency.
SIP is a part of the VOIP protocol family that is just a signaling protocol used to create, manage, and terminate voice over IP sessions in a networking environment. Examples of SIP can be a two-way phone call or a conference call, including multimedia sessions where multiple hosts can be present. This protocol is generally discussed in regards to the initiation of the session between the remove parties ; hosts/nodes that intend to communicate. After the initiation is completed, the data is transferred over the dedicated channel where the Real time Transport Protocol (RTP) helps. Basically, the family of RTP governs the transport and the flow control of all of the multimedia items (RTCP controls the flow).
The two most used tools while working with this protocol are the Statistics menu, under which we will cover Protocol Hierarchy, Packet Lengths, and flow graphs, which will give you an idea of data travelling back and forth between two hosts. Under the Telephony menu, you will see the RTP and VOIP Calls options that can facilitate us in assembling the VOIP call streams. We can then play them back to hear the conversation, this is what makes me really excited about Wireshark.
SIP runs over the UDP protocol and commonly uses port 5060. All of this together in an IP-based environment makes it possible for us to dial instantly to our friends over a VoIP-enabled device. SIP makes it easy for the VOIP telephony server to establish user locations. It facilitates us with different call-managing features such as initiating calls, disconnecting calls, adding someone to a conference call, transferring calls, and various others. SIP is not going to help you maintain the quality of calls, yet SIP is one of the most important standards used by various services. Before we jump directly into looking and listening to the traffic, let's get ourselves acquainted with how the traffic moves in a voice over IP call.
There will be three parties we will consider: two of them are clients and one is the IP telephony server that helps in transferring the required and necessary packets back and forth between the two communicating hosts. The following figure depicts a small infrastructure telephony architecture and lists the various steps taken:
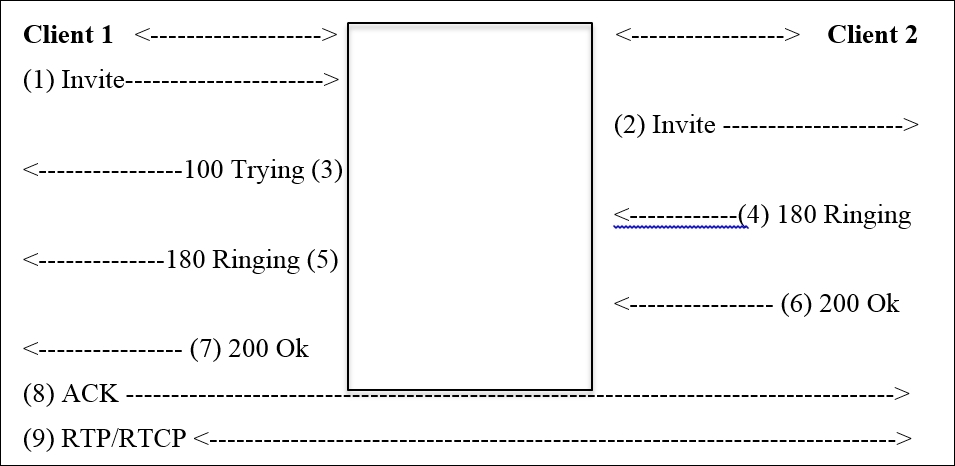
- Client 1 sends an Invite request to initiate the session using SIP.
- The telephony server in between, transfers the request to Client 2.
- The telephony server acknowledges Client 1 with the 100 TRYING packet.
- Client 1 receives a 180 RINGING packet as soon as Client 2 starts ringing. When Client 2 on the other side received the call, it sends the 200 OK packet, which is forwarded to Client 1.
- Now, the client sends the ACK packet to acknowledge the receipt of the 200 OK packet.
- Now, both parties are connected with a dedicated channel over which the RTP/RTCP packet starts flowing back and forth.
- Once both of them are done, there will be a BYE packet sent from by the hosts communicating, which is acknowledged by the other end.
- If you observe, most of the packets are passing through the telephony server. Because the telephony server only knows about the exact location of the connected hosts.
- Once the connection is successfully created, all the packets are sent and received directly by the clients without the server's intervention.
I have configured a small VoIP telephony infrastructure using Asterisk PBX that you can download freely from the vendor's website. VOIP server is located at 192.168.1.107, client 1 at 192.168.1.104, and client 2 at 192.168.1.107. Then, I downloaded X-Lite client using which, I tried calling client 2 from client 1. Now, using the real SIP traffic captured, it becomes easy for us to analyze and learn. Interestingly, there is an option using which, we can play back the communication captured (this can be really dangerous and more amazing).
Here is example traffic captured as seen in the list pane of Wireshark:
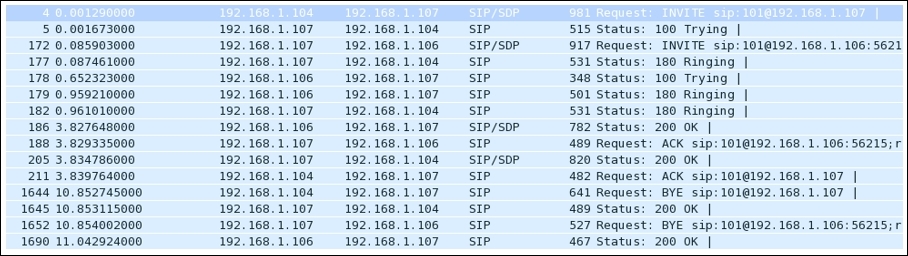
Figure 4.22: SIP traffic
One thing you should consider is place the analyzer close to the telephony server so that you can easily capture every bit of packet-level information moving around. While capturing, if you cannot see any SIP packets, then you won't be able to capture VOIP packets as well. You would end up capturing UDP packets only in the list pane, which won't prove very fruitful for your analysis.
Just for the sake of curiosity, I want to show you the protocol distribution for SIP traffic that can be seen using the Protocol Hierarchy dialog from the Statistics menu. Refer to the following Figure 17:

Figure 4.23: Protocol Hierarchy
Major traffic generated during the session is UDP based, and as seen in the preceding screenshot, SIP traffic is a very small part of it. If you observe closely, it is just 1 percent roughly, whereas RTP has a major role here with 82 percent. This gives an overview about the session we captured and tells us which protocol participates in what percentage. As we already know, SIP is used only to create and manage sessions that occur between two users, or it can be a multiuser conference call.
Flow graphs are one more way of getting a summary of the traffic. They help in understanding the movement of request and acknowledgements sent or received. Refer to the following Figure 4.24:
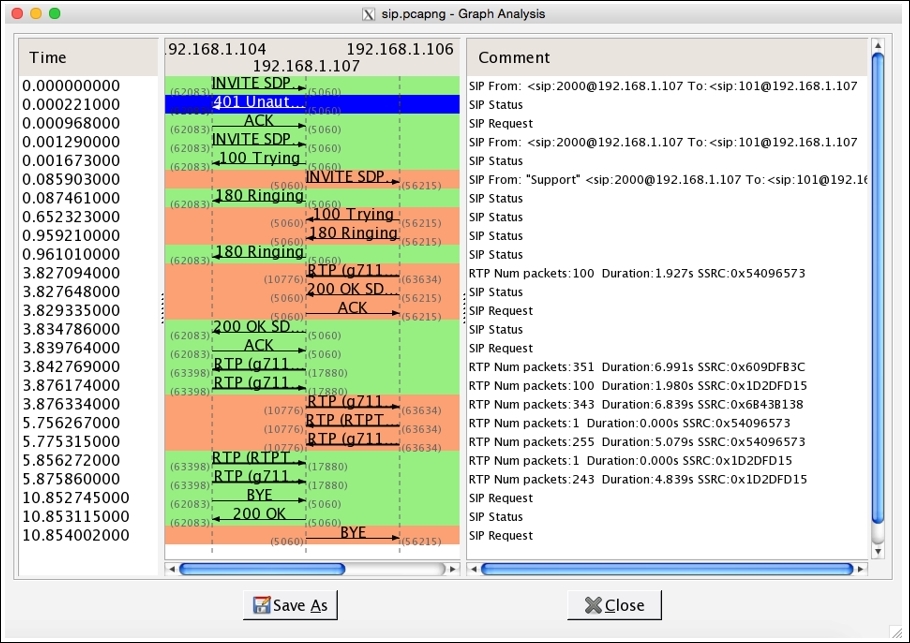
Figure 4.24: Flow graph
There are three IPs listed just below the title bar in the center section. These IPs belong to the server and the two clients that are trying to communicate. The entire request and the responses with their status codes and summary messages can be seen clearly here. Requests sent are colored in orange and the responses with green. This makes every element look more precise and easy to understand.
Yes, this is possible. You can assemble the VOIP packets back to listen to either, or both sides of the communication in parallel. Let's suppose I want to listen what message client 1 sitting at 192.168.1.104 sent to the client 2. We can use the Telephony menu in Wireshark to reassemble the packets and choose the VOIP Calls option from the list. The following screenshot illustrates the resulting dialog.
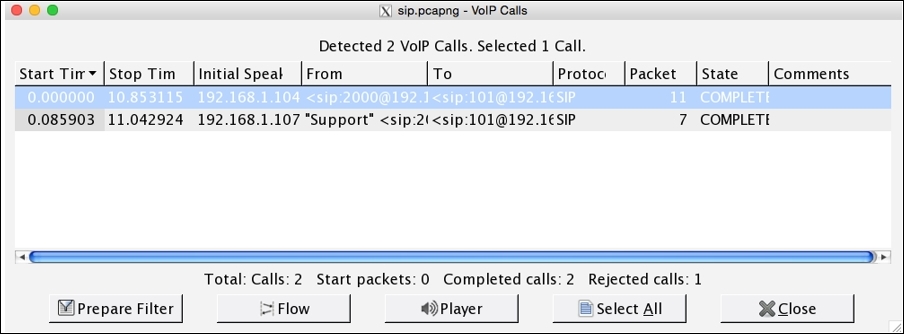
Figure 4.25 : VOIP Calls dialog
Now, choose which side of communication you want to listen to. Then, click on the Player button, which will then ask you to provide maximum Jitter (Jitter is the variance in packet rate at which the packets are being sent and received. If jitter is high, then there is a chance your network is dealing with congestion. Calls having high jitter values are not feasible to listen to.) in our communication session. The maximum jitter value is 22. So, by default, there will be 50 ms value given in the box. You can change this value if your jitter is higher than that; otherwise, just click on Decode:
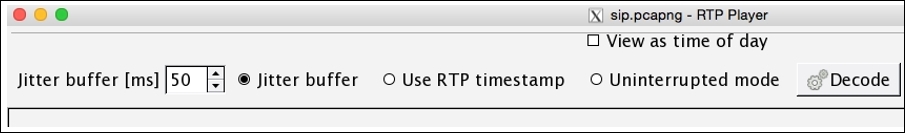
Figure 4.26: Player dialog
I did not change the default value and clicked directly on the Decode button, which reassembled all the VoIP packets for the side of communication I chose. Refer to the following screenshot:

Figure 4.27: RTP Player
If you want to play the message, check the box just below the scrollbar and click on Play. Various useful details related to the assembled VOIP stream are listed.
Wireshark has numerous tools that help a user in maintaining QS for a certain networking infrastructure and also consists of a tool that helps in identifying various day-to-day traffic anomalies. A common type of traffic when dealing with an SIP server is INVITE requests that are sent from one client to initiate the connection with another client. As you might already know, this process is a three-way handshake where the client who initiated the request is supposed to acknowledge when the session creation is completed. What if the client who requested does not respond with ACK and sends another INVITE request? Normally, the server will try to connect the client to the requested client machine, meanwhile waiting for the ACK response for the previous request. Now, let's suppose the client sent 100 INVITE requests through different clients on the network and did not even bother to send ACK for any one of those sessions created. This can result in a DOS attack (INVITE flood attack) where the SIP server won't be able to process any further requests (the buffer size for INVITE is 100). To resolve this, you can apply a display filter to view the INVITE requests sent from a client or apply a filter where the status code is 200:OK.
Other than DOS attacks, there is a chance that your network may slow down due to packet congestion, or you might not be able to get connected to another client on your network. In other words, your call cannot get through, if there is lag in setting up the call (the average call setup time is high). You will witness multiple cases once you work in a production environment. So, Wireshark and the various powerful tools it contains comes to our rescue.
For instance, if some client is trying to make a call to an invalid extension, they will get an error, and the call won't get through. Such a scenario will generate packets as shown here:

I would suggest that you filter SIP packets consisting of error codes greater than 399 and create a display filter using sip.Status-Code > 399. See the following screenshot that lists multiple errors generated while client 1 was trying to call:

Figure 4.28: SIP error
Yes, it is possible to decrypt your online TLS traffic into a plain text SSL stream using Wireshark. Google Chrome and Firefox look for a log file, which stores the TLS session keys. Follow these steps to decrypt encrypted traffic:
- Create an environment variable with the name
SSLKEYLOGFILEthat will point to a text file. Your browser will look for this file every time it starts up. To create environment variables, right-click on My Computer | Go to Advanced Settings | Environment Variables | New | Specify Name:SSLKEYLOGFILEand Value:C:/Users/username/sslkeylog.txtand click on Ok. - I have created a blank text file,
C:/Users/username/sslkeylog.txt(make your new environment variable point to this file). - Now, open your browser and visit a website enabled with TLS/SSL. For demonstration purpose, I have my own SSL webserver located at
192.168.1.105and a client located at192.168.1.105.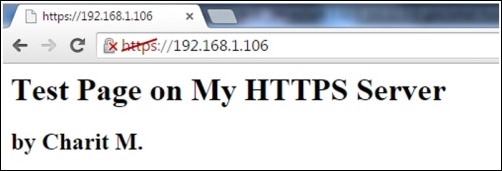
The certificate I created is self-signed; that's why you are seeing a red diagonal line across
httpsin the address bar. After you visit any secure website enabled with SSL, your sslkeylog.txt will be populated with some random numbers, as shown in the following screenshot. If not, cross check your settings before moving on:
- I captured the whole traffic between my client and server in Wireshark. Now, go to Edit | Preferences | Protocol tree | SSL | (Pre)-Master-Secret log filename | /path/to/sslkeylog.txt | Ok. Then, right-click on the SSL packet (Make sure you select Decrypt packet data. The option should be present in the bytes pane) and follow the SSL stream. Now, you will see something like Figure 4.29 here:

Figure 4.29: Decrypt SSL traffic
This is one of the easiest ways by which you can go ahead and decrypt SSL traffic with just a few clicks. One more way is to feed the RSA private key of the server into the Wireshark SSL preferences, which will give you the same result.