This chapter will introduce you to the amazing features launched with the latest version of Wireshark. The following are some of the prominent changes that users will become aware of, and all the sample examples in this chapter are being using version 2:
- Comparison between Wireshark v2 (QT) and the Legacy framework (GTK)
- The intelligent scroll bar
- The Translation feature
- Graph improvements
- Newer TCP streams
- USBPcap
- Summary
- Practice questions
Wireshark has been there with us for approximately two decades now; there weren't any major updates that we witnessed during its lifecycle. However, there were minor updates introduced to make the application more convenient and robust during this long period. But this time, we have a newly branded Wireshark v2 with glazing arsenal. Yes, we are really lucky to witness this major update for the most popular and amazing tool in the protocol analysis industry.
I am really excited to discuss the different sets of tools introduced with the latest release, but, before that, it is necessary that you get acquainted with the background of the QT and GTK frameworks. You definitely have to Google these either now or maybe after reading this chapter. However, make sure that you note them.
For your convenience, I will give you a gist and some background of these frameworks; the reason why I am emphasizing the difference between the two is that the newly developed version 2 of our protocol analyzer is developed using the QT framework. QT and GTK are frameworks used for the development of GUI cross-platform utilities such as Wireshark. In general, from the end user's perspective, the difference would be based purely on graphical changes, but performance wise, GTK is more economical as compared to QT. For better understanding, these aren't just toolkits and frameworks; instead, these are sets of libraries used by developers to create better GUIs for end users. Basically, it's reusing the designs already made by others. The main advantage of reusing designs is that it allows the newly installed program to look more similar to the other already installed programs on your machine. For instance, let's see both the new and old version of the application parallelly; refer to the following screenshot for this:

Figure 9.1: The GTK and QT frameworks
You must be wondering how you can get your machine installed with the latest version of Wireshark. It's really easy; you just have to visit http://wireshark.org, and then go to the download page. There, you will find the latest release. Download the one appropriate to your operating system. During installation, there is one important question that you will be asked, that is, whether you want to install the legacy version along with the newer release or you just want to install the newer version (note that only Windows users have this privilege; Mac and Linux users can just install the latest version of the application).
There is one more component that you will see being installed on your machine: USBpcap. I have dedicated a separate section in this chapter for this particular topic. For the sake of basic introduction, USBpcap facilitates users to capture data that moves back and forth from your machine's USB port. The tool has been available for Linux users for quite a long time, but luckily, Windows users can also utilize this now.
For starters, let's have a look at the main screen , which has a completely different feel from the previous version. Refer to the following screenshot to get a look:

Figure 9.2: The main screen of Wireshark v2
I hope you feel the same way I do about the new, exciting look. Everything in this version looks so properly arranged and cleaner. Even a novice user who has no experience at all in protocol analysis can get a great head start just because this has now become a simple and attractive interface.
Just observe the toolbar area, for instance. In this version, it seems like the developers have filtered out the unwanted and less commonly used tools, which eventually makes the interface quite comfortable for the eyes. In this new version, we have quick access directly to a basic toolset, such as the start and stop capture buttons, the interface customization button, a button to save/open/close the current capture file, some navigational tools, and the auto scroll and coloring activate/deactivate button.
Just below the toolbar area, we have our good old friend, the Display Filter toolset, which is redesigned with great efforts. On the leftmost side of display filter text box, you will see a bookmark kind of icon (in blue—top-left corner) that will show you the default and manually created filter expressions. Refer to the following screenshot that shows an illustration:
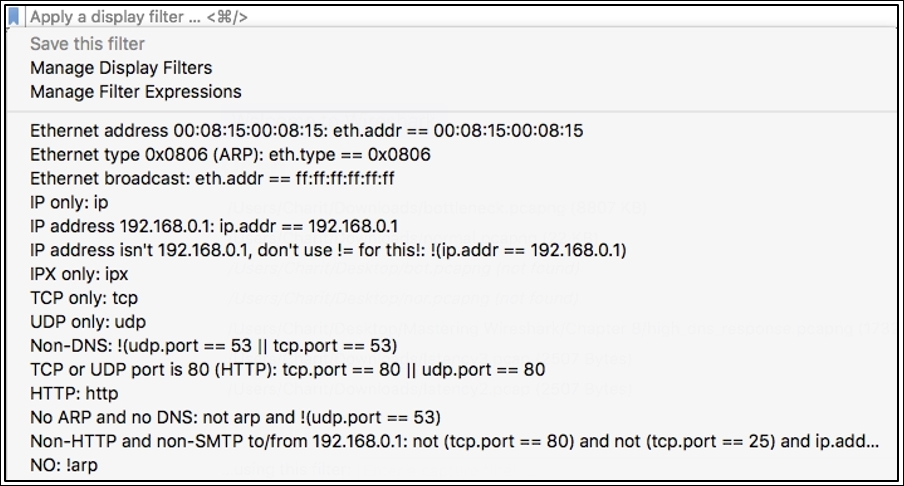
Figure 9.3: The Display Filter toolbar
As you can see, all the filters are listed, which you might have created, or are default ones. So now, it's a matter of just a click if you want to activate any one of them, instead of getting a pop-up window from where you choose and apply the filter, like in the older version. This definitely speeds up the process of analyzing and makes the life of IT professionals easier.
On the other end of the Display Filter toolbar, we have a few old tools that have been remodeled in a fresh look, along with some functionality improvements; refer to the following screenshot for an illustration:

Figure 9.4: The Display Filter toolset
To apply any display filter now, you just need to click on the arrow, and the dropdown next to it will give you access to frequently used filter expressions (history of last-used expressions). Then, you have the Expression button, which will help you access the dialog where you can get access to all possible filter expressions categorized on the basis of protocols. Next, on the rightmost side of the display filter textbox, you have the + sign; by clicking on this, you can create a filter button. Let me help you in creating one for yourself in the newer version to get started.
For example, I want to create a button to see only the ARP packets, so I will type arp in the display filter area and click on the + sign at the end of the toolbar. Then, you need to specify the name of the button you want:

Figure 9.5: Adding a custom display filter expression button
This will add a physical button next to the + sign. This technique will prove worthy and very effective when you have long display filter expressions, which you might need often. So, instead of typing the whole expression again, you can just activate them with a single click. As a result, you will see something like what is shown in the following screenshot. Now, you are just a single click away from applying arp as the display filter:
Figure 9.6: The display filter button created
Next, below the display filter toolbar, you can see the recently used files; just double-click on any file you want to open.
After the Open file section, we have the capture filter toolbar, and I don't think you need any explanation regarding what it is for and how you are going to use it for your perusal.
Now comes the major change that you will witness on the main screen, that is, the interface's name followed by an interactive graph. The graphs you will see are actually live, meaning you will see the fluctuations, that is, the lines going up and down. The miniature graph followed by the interface name represents the amount of traffic moving back and forth from the interfaces you have. The proper terminology for these miniature graphs is sparklines. In the older legacy version, we had the live statistics in numerical form.
Now, if you decide to capture traffic from a particular interface, just double-click on the graph area, and Wireshark will do the rest for you.
This is one of the features launched in the latest release, and you might have already noticed some colored sections/lines in the scroll bar area. If not, then go back to any of the capture files you have, slowly scroll up and down, and observe the coloring pattern in the scroll bar area. Any guesses what difference it would make in the analysis process? Let's understand this with an example.
I will use a previously captured file for demonstration purpose, which has HTTP and HTTPS packets along with some retransmission and duplicate frames. There is no difference that you can figure out at first glance, but as soon as you start scrolling, the coloring pattern will be shown in the scroll bar area. This pattern is based on the coloring rules that you have in your application. For example, as per the default coloring rules, duplicate and retransmission packets are usually seen with a black background and a red foreground, and HTTP packets are shown with a green background and a black foreground. Now, let's verify this in the application itself. Refer to the following figure for the same:
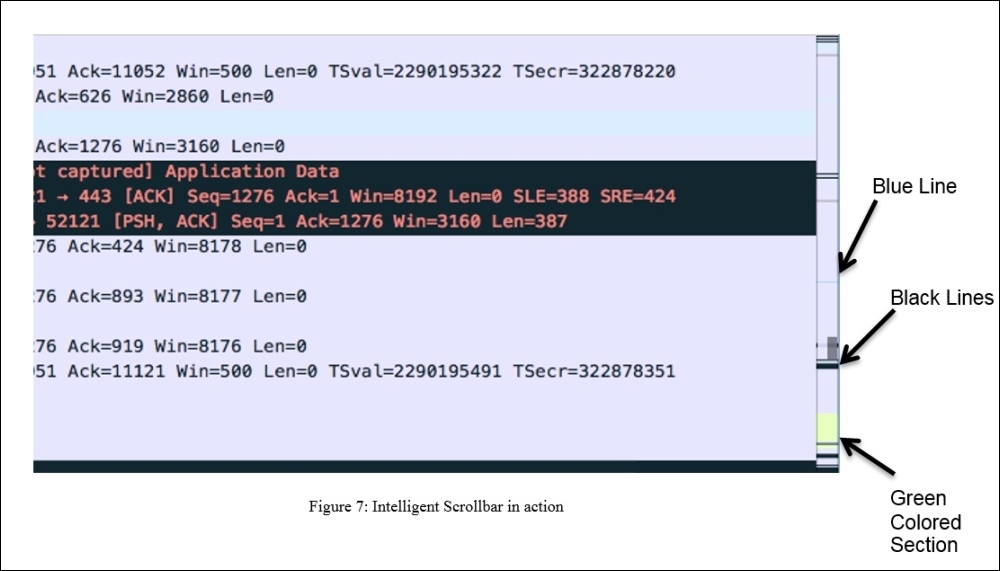
Figure 9.7: The intelligent scroll bar in action
The way packets in the list pane are shown in different colors is similar to the way the scroll bar represents the different sections of your list pane.
In the same way that the blue line indicates the selected packet, the black lines denote the duplicate ACKs and retransmissions, and the green-colored section indicates that at the bottom of the capture file, we have some HTTP packets listed. By just observing the coloring pattern in the scroll bar area, we can figure out what sort of packets we have ahead, and most importantly, navigating to a certain section of packets you are looking for is now much easier and faster.
We already discussed customizing the coloring rules in previous chapters; let's take one more example of the same capture file, and this time, I want to customize the HTTP packet coloring rule. We will change the green background color to yellow. Let's see what difference it would make in the scroll bar area in the following screenshot:
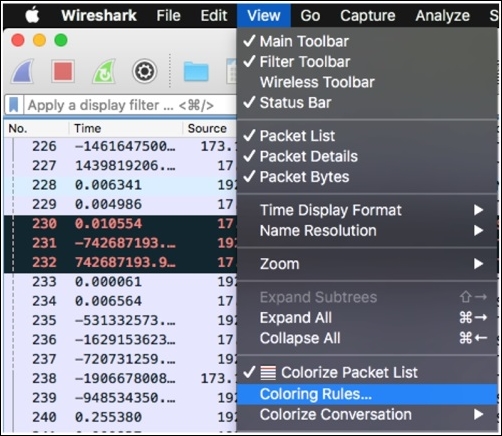
Figure 9.8: Accessing the coloring rules dialog
To access the coloring rules, you need to click on View from the menu bar and then choose Coloring Rules at the bottommost corner, which will show you the dialog where all coloring rules will be listed. Try changing the HTTP coloring rule to yellow. Once this has been done, close the dialog and reopen the capture file in order to see the change.
Now, try scrolling the same file, and I hope you will see the difference in the coloring pattern in the scroll bar and your list pane too, where all HTTP packets are colored with a yellow background. Refer to the following screenshot:
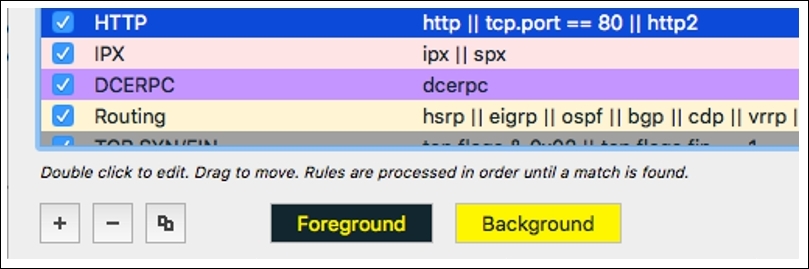
Figure 9.9: The HTTP coloring rule
Now, let's compare what difference it made when we tried scrolling up and down in the list pane after the new coloring rule was applied. Refer to the following screenshot to go through the illustration:
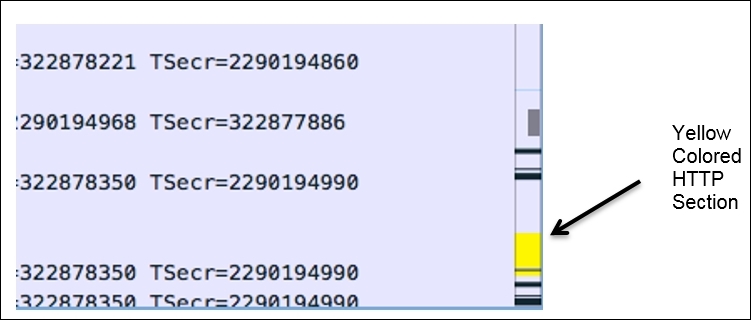
Figure 9.10 Effect of the HTTP coloring rule can be seen in the scroll bar
A good amount of cleanup has been done from the toolbar area where, for example, the coloring rules toolset has been removed, and now you can access it from the view menu. The + and – symbols at the bottom of the coloring rules window can facilitate you with the configuration of the rules.