
This chapter will teach you how to configure and use Wireshark to perform network troubleshooting. You will also master the art of troubleshooting network issues using Wireshark. The following are the topics that we will cover in this chapter:
- Using Wireshark to troubleshoot slow Internet issues
- Lab up
- Troubleshooting network latencies
- Lab up
- Troubleshooting bottleneck issues
- Lab up
- Troubleshooting application-based issues
- Lab up
- Practice questions
The loss of packets during transmissions is one of the most common problems that all network administrators deal with in their day-to-day lives. However, thankfully, we have various built-in error recovery features in the transmission protocol that come to our rescue to deal with the problems. However, it is essential to understand how these error recovery features work in order to troubleshoot the problems by just looking at the packets flow in the list pane if and when human intelligence is required. Troubleshooting latencies or any application-based issues in your network requires you to have an understanding of the traffic flow and the way packets interact with each other. Before we start getting our hands dirty with a troublesome network, we need to understand some basics of the recovery features that would help you diagnose and figure out the root of such problems. Consider yourself blessed that you have the privilege of using Wireshark—the most popular and well-versed tool for network packet analysis—which is an open source tool. This won't state the problems for you, but the time required to troubleshoot network-related issues is drastically reduced.
Now, you might feel like asking the question: "how does it looks like or how you can identify such happenings?" Just as every coin has two sides, the network communication has two ends: a sender and a receiver. On the sender side, recovery features are handled by the Retransmission Timeout (RTO) values, which are a sum of Round Trip Time (RTT) and mean of standard deviation. On the receiver side, recovery mechanism is handled by keeping a track of SEQ and ACK values that are shared between the communicating hosts.
You definitely have heard about flow control features, we discussed the same in previous chapters while dissecting TCP-based communications. Flow control features are used in order to keep the transmission more reliable by taking help of dynamic functionalities such as sliding window and zero window notifications. Now that you have the basic understanding of, I want you to understand things in detail. Note that we will talk about TCP-based communication most of the time in this chapter.
TCP retransmissions and duplicate ACKs are the tactics that are used while recovering from a failed packet transmission or an out-of-order packets transmission scenario. Commonly, network latencies (the total time it takes for a packet to be sent along with the time its ACK is received) are observed, due to which the performance of networks are significantly disturbed. When the amount of retransmissions and duplicate ACK packets are seen very often in the list pane, most probably, there is a chance that your network is facing high latencies; if not, then just sit back and relax. My point is that you should be concerned about such activities, and if possible, mix some network management techniques with your protocol analysis that can keep you updated all the time with what's happening inside
The devices use TCP retransmission in order to send data reliably. Values such as RTT and RTO are maintained by the sender of the data in order to facilitate a reliable form of communication. The sender initiates the retransmission timer as soon as the packet leaves the ACK, and when the same is received, the sender stops the retransmission timer. The timer value here determines the timeout value. Now, if the sender does not receive the ACK, after a certain amount of time, the sender initializes the retransmission of the same packet. If the sender still does not receive any ACK, the timeout value will be doubled and the sender will retransmit the same packet again. The same cycle is followed until the ACK is received or the sender reaches maximum retransmission attempts. The sender, based on the operating system maintains a number of retransmission attempts, which are triggered when a certain timeout value is reached.
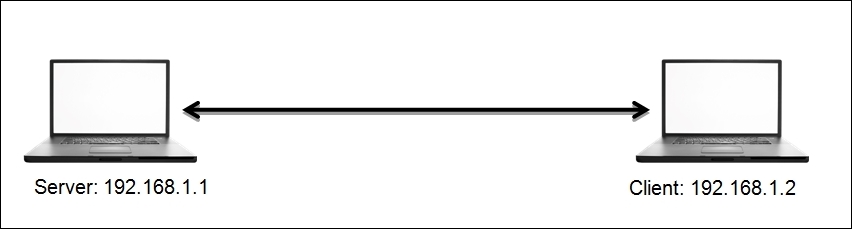
Figure 8.1: TCP duplicate ACK and retransmission
For instance, in the preceding figure, a client is located at 192.168.1.2 and the server is located at 192.168.1.1. Here, the client is requesting some resource that the server holds, following which the transmission between the two hosts starts after the three-way handshake is successfully completed. For every data packet received, the client sends a ACK for the same. Now, suppose that for some random packet in the stream, the server did not receive the ACK even after the timeout value for the data packet expired. The server initiates the retransmission of the similar data packet again. The same process is followed unless and until the server receives an ACK for every packet, or the server at 192.168.1.1 reaches the maximum number of default attempts, five, in a row. Refer to the following figure that shows this retransmission process:
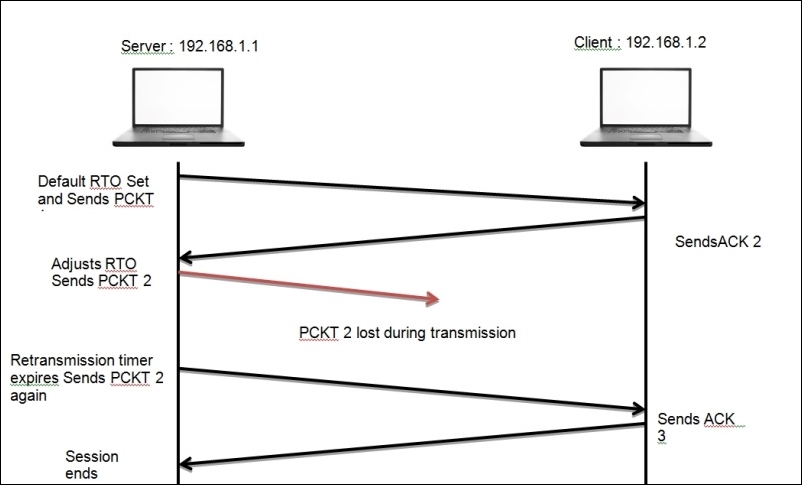
Figure 8.2: TCP retransmission
On the basis of the preceding simplified scenario, I suppose now that you have understood the gist of the retransmission process.
Now, we will discuss duplicate ACKs and fast retransmission, which is another recovery feature that the clients take care of. In the previous chapter, we discussed the SEQ and ACK numbers that are used in order to keep track of TCP-based communication. You might also remember how the ACK values were incremented using the data payload size, where we added the received packet SEQ value and data payload size value and the resulting sum became the ACK value. We sent this value with our ACK packet, and we expect to receive the next data packet marked with the same SEQ value. Suppose that the server starts sending data packets, and the first data packet is marked with a SEQ value of 100 with a data payload size equals 10. Once the client receives the ACK packet, it prepares to send to the server with value set to 110 (remember the formula: SEQ number received + Data payload size = ACK value).
As soon as the server receives the ACK packet with the value 110, it prepares for another data packet to be sent with SEQ 110 with a payload size of 10. After receiving this, the client will respond with ACK 120. The same process goes on till the end of the session. Now, suppose that instead of sending the next packet with SEQ set to 10, the server sends a packet with SEQ 130, which is out of order, and after receiving this, the client would send a duplicate ACK set to 120 to the server to recheck and send the missing packet again from the data stream.
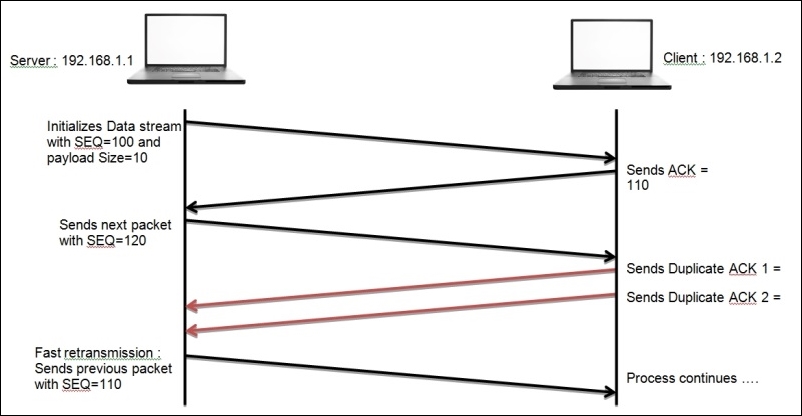
From the preceding scenario, I hope you have understood the process of duplicate ACKs and fast retransmission, which you can use while troubleshooting your realtime network for related anomalies. Before we go ahead and discuss flow control, I would like you to see real packets in my network that are related to both cases of error recovery that we discussed. Refer to the following Figure 8.3 and Figure 8.4:

Figure 8.3: TCP retransmission packets
In the preceding screenshot, a client located at 192.168.1.103 sends FIN and ACK to the server at 216.58.220.36. After this, the client would expect to receive a ACK packet in the next place. However, the client does not receive anything back from the server. Now, after the RTO time expires, the client starts sending the same packet after double the time, and the process of sending TCP retransmission packets after a certain period of time goes on until the client receives an ACK packet or reaches the maximum number of retransmission attempts. Observe the RTO column and how the value starts doubling up until it reaches a maximum limit.
With the next scenario in Figure 8.4, I want you to witness the duplicate ACK packet that is being generated because of a malformed packet sent by the server at 216.58.220.46 to the client at 192.168.1.103. As soon as the client receives it, a duplicate ACK packet is sent in response to the malformed packet that is seen out of sequence.
Observe that the 6027 frame with SEQ = 1920 and Data payload size = 46 is being sent across from one host to another. Next, in the response frame 6070, a malformed packet with a random SEQ value was sent in response. Due to this, the host at 192.168.1.103 generates a duplicate ACK packet and sends it to the host on the other side with the SEQ and ACK values similar to the frame 6027. Now, this time in response, the host at 216.58.220.46 sends a valid ACK frame 6115 with ACK incremented to 1966 (1920+46), as expected, and then the communication goes on.

Figure 8.4: Duplicate ACK
With these real-life examples, I expect that you have understood the behavior of TCP error recovery features more precisely.
This is another feature used by the TCP protocol to avoid any data loss during the transmission. Using flow control, the sender syncs the transmission rate with the receiver's buffer space with a motive to avoid any future data loss. Consider a scenario where the recipient has a buffer space of 1,000 bytes available at an instance, and the sender side is capable of sending up to 5,000 bytes per frame. Now, using this information, both the hosts have to sync their window size to 1,000 bytes only to avoid any data loss. Refer to the following figure that shows this feature:

The preceding figure depicts the way both the communicating hosts negotiate the window size for transmission purpose. Observe the behavior, beginning from the frame with SEQ 1 where Host 2 responds with ACK 2 to specify that the frame was successfully received.
Next, HOST 1 tries to increase the transmission rate to two frames and sends them with SEQ 2 and 3. Host 2 responds with ACK 4, which denotes that both frames were successfully received. Similarly, we succeed in increasing the rate to three frames.
Next, HOST 1 increases the rate to 4 and tries sending packets with SEQ 7, 8, 9, and 10. This time, HOST 2 responds with ACK 10, which means that Host 2 receiving the window size can afford maximum 3 frames at an instance, and the sending side should adjust to it.
Next time, when Host 1 transmits, the windows size would be set to 3 frames, which the recipient can afford to process on his/her end. The window size is not set to a permanent value; it can vary until the whole transmission is completed, and the whole process is called the TCP sliding window mechanism and is used to avoid data loss during a transmission.
Think about what would happen if the recipient side is left with no buffer space, that is, 0 bytes. It can handle at some moment during the transmission. What will the TCP do in such case? Will the communication channel drop or the TCP will come up with something more reliable.
Yes, the TCP has another data loss recovery feature called the Zero window notification. Here, the recipient side sends a Windows update packet set to 0 bytes and asks the sender to halt the transmission of frames. In response, the sending side will understand the situation and respond with a Keep Alive packet that is sent at a particular duration while waiting for the next Window Update packet from the client. Refer to the Figure 8.6 that illustrates the same.
HOST 1 starts communicating after the three-way handshake process has been completed. After a few packets get transmitted successfully, the receiving side buffer space gets filled up with other resources, so HOST 2 responds with a Zero Window packet telling Host 1 to halt sending packets until further notice. Accepting the Host 2 zero window packet, Host 1 starts transmitting Keep Alive packets in order to keep the connection active and waits for further notice. Once Host 1 receives the new window size and ACK for the frames that were transmitted, it will start sending the data packets again in accordance with the receiver's buffer space.
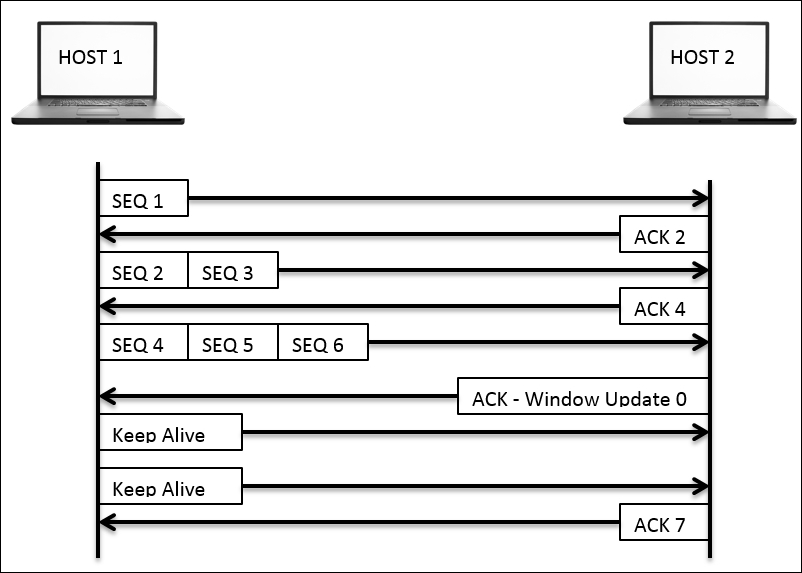
Figure 8.6: The zero window notification
The technique we discussed here is quite efficient in preventing any data loss that might happen during a transmission or due to an overwhelmed sender. The TCP hosts a great mechanism to control the transmission process, thus making it more reliable for any type of communication.
The discussion that we had on delays observed in the list pane can be categorized in two categories: the normal/acceptable delays and the unacceptable delays. Yes, you heard me right, there are some forms of delay that are acceptable, and you should not waste any precious time of yours in troubleshooting any of those cases.
Assign a category to your current scenario on the basis of the test results that you have obtained from the client site (try to put sniff packets from the complaining client's perspective) into one of the following categories: wire latency, client latency, and server latency. Seeing your scenario with the perspective of one of these cases will assist you in solving the problem with a more process-oriented approach, hence making the task less complex, which will end up getting sorted out in lesser time with lesser resources.
Before you start troubleshooting such scenarios, I would highly recommend that you change the default list pane view by customizing the existing time column (customize the time value to
seconds since Previous Displayed Packet), which would work as a column to figure out latency issues, that is, it will show you the total amount of time between two related packets in a sequence. Refer to the following figure to customize the time column.
To further elaborate the best practices that are followed, I will discuss a step-down approach, which you can use as part of your checklists. Make sure that you understand one thing clearly: tracking an issue can be quite critical on a server side because you may see thousands of packets flying in and out per seconds. This can be really messy and would only end up in making the whole problem more intense. Looking at thousand of packets to figure out the source of slow Internet connection doesn't sound feasible. So, the best option would be to filter out things, prioritize them, and look at the problem from the client's end first.
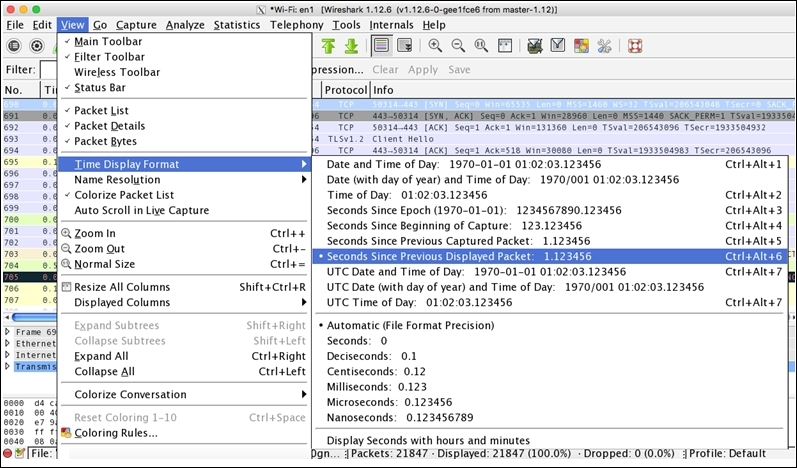
Figure 8.7: Customizing the time column
- Starting your investigation at the client's end makes it much simpler because you won't be dealing with several packets that may not be relevant to your scenario. On the other side, if there is even a hairline chance that you won't be able to see the packets that are relevant to you, this might make the troubleshooting experience a bit challenging.
- Apart from all the challenges that you might face at the client's end, the first thing you should ask your client is to replicate the problem if possible, or if the problem is occurring in a time-based manner, then you should wait at the client's end in order to witness and understand the scenario. The ultimate goal should be to capture the relevant packets and get a crystal clear understanding of the problem that the client is facing from their perspective.
- Now, when you have the trace file in hand, you can look at the process where the client is trying to connect to the server: the whole process where the client issues a DNS query with an objective to attain a server's logical location over the Web. If the local DNS cache already holds the IP address of the server, then you might not observe any DNS packets; instead, a direct SYN packet would be seen in the list pane sent to the server to initiate the independent connection. What you need to make sure here is that if the DNS queries are seen in the list pane, then the round trip time should be low, as expected (approximately less than or equal to 150 ms).
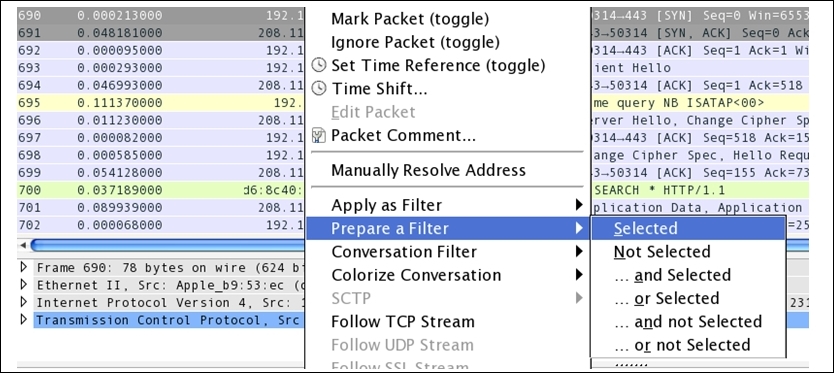
The next would be the three-way handshake packet that you will be observing in the list pane. The best option would be to isolate the communicating hosts that can help you in eliminating any further communication. You can just right-click on the communication and create a filter as illustrated in Figure 8.8
- Once you have filtered out the problematic connection between the hosts, the next task would be to observe the total time. The time between duration when the SYN packet was sent and the corresponding SYN/ACK packet was received. This can be compared with the baseline that you already have to come up with a variance that could help you in pointing out whether the connection is slow or is working fine. Refer to the following screenshot that illustrates the same:

Figure 8.8: The time between the SYN and SYN/ACK packets
- As you can see, the time between the SYN and SYN/ACK packets is relatively low, and this seems to be a good working connection. This kind of connections can be helpful while you are designing a baseline for your network. At a later point in time, the same can be used to compare with problematic scenarios. Refer to the following screenshot that show DNS and TCP packets of the same communication:
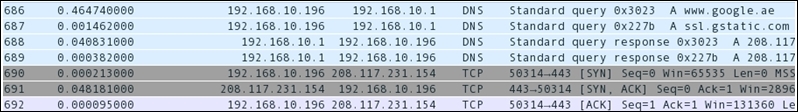
Figure 8.9: The ideal baseline trace
- The client issues a request to visit the
google.ae(frame686) website, which the local server acknowledged in order to first look for the IP address in a local cache. Once the local DNS server completes, the search process, the client receives DNS responses including Google's IP address, which can be used to visit the website (frame688and689). - As soon as this process completes, the client at
192.168.10.196issues a SYN request to one of Google's IP address in order to visit the web page. Without any further delay (less than tenth of a second), the server responds withSYN/ACK, and the process goes on.
Let's suppose that the total time between the SYN and SYN/ACK packets is high by approximately 0.90-1.0 seconds. At first glance, you ignore this an move ahead, and you will observe a quick ACK packet sent in response from the client followed by a HTTP GET request (in case the client is visiting a website). Next, the ACK packet acknowledging your GET request surprisingly takes more than a second to come. Now, this points to some serious latency issues. The question is, who will be the one you are going to blame—the client or the server? The client did its part by sending the SYN packet on time. Then, is it the server who is handling a high load of traffic and is quite busy with other applications, because of which you are handling high round trip time? The answer is neither the client nor the server. Then why is the round trip time high? The probable answer for such cases in my knowledge would be the wire. Yes, you heard it right. The wire can also take part in making your network slower then expected. So, while troubleshooting slow networks, if you observe high round trip times associated with the SYN/ACK and ACK packets, then you can be sure that your client and server are not the source of the issue.
What you can do is start examining the devices between the hosts, such as the routers, switches, firewalls, proxy servers, and so on. Although the example we talked about doesn't give you the exact source of the problem, it definitely gives you a clear understanding that both the communicating hosts are not promoting any form of latency.
Now, for better understanding, I would like to show you the same in practical terms. Refer to the following screenshot that lists out a few packets shared between two hosts, starting from a three-way handshake:

Figure 8.10: Wire latency
First, the client located at 192.168.10.196 and the server located at 128.173.97.169 start communicating. In the beginning, we see that a three-way handshake takes place between the client and the server, but did you notice the amount of time it took for the SYN/ACK packet to come (more than 0.36 seconds). Look at the frame 39, and it is something that you should take care of. Moving on, we saw one more similar event after the GET request was issued, where the ACK packet took approximately 0.30 seconds to come back. The latency observed is not because of the client or the server, as we discussed earlier. The latency here is promoted by the devices that lie on the wire. The best troubleshooting option in such cases would be to look at the routers, switches, or any firewalls that were implemented without wasting time in troubleshooting the source and the destination.
You might think about the scenarios where you would come across or see latency issues that the client/server promotes. Let me explain this to you with some real-life examples; first, we will take a look at the latencies promoted by the clients.
A few days ago, I was just visiting some random websites over the Internet to look for some research material, and meanwhile, Wireshark was running in the background and capturing every packet I was tying to visit. I surfed the Web for approximately 3-4 minutes and then closed the browser as well as stopped Wireshark from sniffing any packets. After the whole thing, I decided to look into the trace file to investigate any client-side latency issues.
Refer to the following screenshot from my trace file, which shows frequent client-side latencies that will eventually affect the performance of my network:
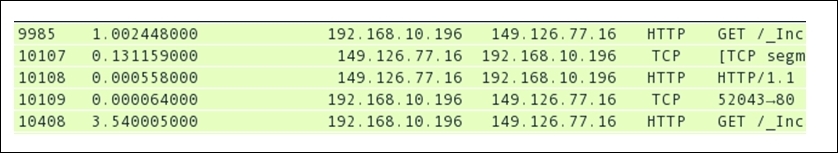
Figure 8.11: Client-side latency
As you can see in the frame 9985 and frame 10408, there are GET requests that my machine at 192.168.10.196 had issued, and the amount of time it took was 1 second for the first time and more then 3.5 seconds the next time. I became curious and started thinking about why this happened and what can be the most appropriate reason for such latencies.
Once I started further investigation, I saw that the three-way handshake process happened in a timely manner and there were no signs of latencies. Now, my attention went to my machine. Maybe, there is something that is tampering with my network connectivity. I looked at the resource allocation window in terms of primary memory and CPU utilization. What I saw was that the CPU and memory utilization meter were showing high consumption, which led me to enquire more about the number of applications running. There were three virtual machines running that I forgot to turn off, which were utilizing all the memory. This, in my belief, is one of the strongest reasons, because of which I was experiencing latencies on the client side (my machine). I hope that, with this practical example, you might have understood how client-side latencies can be one of the reasons for low network and Internet performances.
Moving on with this simple example, let's get ourselves introduced with server-side latency issues. I followed the same approach of surfing the Web with random websites while capturing packets with Wireshark for a couple of minutes and then analyzing the cause of any form of latency that can be seen in the list pane. This time, I came across an interesting session between my machine and a website. First, I would like you to have a look at it. Refer to the following screenshot that illustrates this:

Figure 8.12: Server-side latencies
As you can see, the session between my machine at 192.168.10.96 and the server at 198.41.184.93 begins with a smooth three-way handshake without any sign of latencies. Next, the client issues a web request, following which the server sends an acknowledgement. Uptil here, everything has gone flawlessly, and there were no traces of latencies. However, when the server was about to start the data transfer, the server stopped for a while, as you can see in the frame 503. The server took around 0.35 seconds to initiate the data transfer. This clearly illustrates that the server might have experienced heavy network traffic, or may be, the server was running several applications that were causing high CPU and memory consumption. There can be several other reasons as well for the latency that we just witnessed. Observing all of it, we can give a conclusion that the server is the reason for the latency; in this case, the server was incapable of processing the client's request in a reasonable amount of time, which ended up as a minor latency issue.
You learned how the devices over the wire, the client side, and the server side can promote high latencies while you surf the Internet or even your internal LAN network can be a victim of the same. We talked about delays before the server's SYN/ACK packet is received. These delays can happen because of the device in between (over the wire) and may be witnessed due to the server's high response time. Let's make things more interesting with a small practical example about identifying high HTTP response time. This will be useful for you to identify high response time. Follow these steps to replicate the same in parallel:
- Open your browser and visit some websites while Wireshark runs in the background listening to your packets.
- Once you have visited at least 3-4 websites, you can stop the capture process.
- Now, switch to Wireshark and make some necessary changes. First, disable Allow subdissector to reassemble TCP streams. Select any TCP packet in the list pane, then right-click on the TCP section in the details pane, and then click on the Allow subdissector to reassemble TCP streams option to disable it. Look the the following screenshot that illustrates this:

Figure 8.13: Disable the Allow subdissector setting
- Next, we have to add the
http.timedelta column to the list pane in order to see things more clearly and to easily identify any traces of latencies. - Select any HTTP packet from the list pane and then expand the HTTP protocol section in the details pane. Then, right-click on the Time since request parameter and click on the Apply as Column option. Refer to the following screenshot that illustrates this:

Figure 8.14: Apply Time since request as a column
- Once this is done, you would be able to see the Time Since Request columns just before the info column in the list pane.
- Now, you are left with just one step: to identify the highest response time from the web servers that you visited. Simply sort the newly added columns in a descending order to the highest response time. Refer to the following screenshot that illustrates this:

Figure 8.15: Sorting the http.time delta column
- Once this is sorted, you would be able to see the highest response time at the top of the list pane, as shown in the following screenshot:
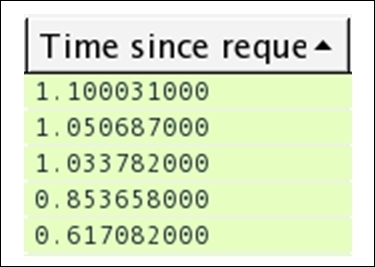
Figure 8.16: High HTTP response time
- The session at the top of my list pane between my machine and a web server that I visited denotes quite a high response time of more than a second. See how easy it was to identify the
httpdelays in order to make your troubleshooting job easy. I hope it would be easy for you to replicate the same.
You can also achieve this in a visual representation, where you can create an IO graph to identify high latencies. Refer to the following small illustration using which you can replicate the scenario (note that I am using the same trace file that we saw earlier in the previous example):
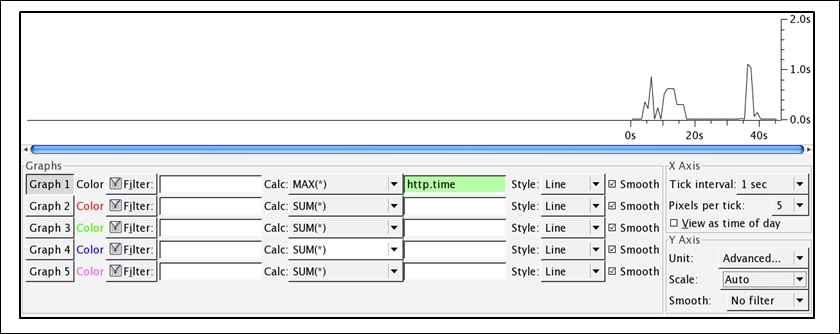
Figure 8.17: Using an IO graph to identify the delays in HTTP response
As you can clearly observe in the graph, the response time for the requests you made took more than a second to complete in a total browsing session of approximately 45 seconds.
There can be multiple situations where you will witness such traffic patterns; this one is definitely because of a web server that makes your web surfing experience bad. The reasons behind such a pattern can vary from a server in a heavy traffic load to a server hosting several applications, or it can be possible that the server you are trying to visit might be consulting some other web server in order to fulfill your request.
Next, let's see an example where DNS queries and their responses are responsible for causing your Internet or local networking experience to suffer. As we saw, other protocols in conjunction with DNS make the whole networking experience better, but at times, the same DNS protocol can cause trouble. Follow the next steps to identify the source of problems using DNS response time:
- Open your browser and visit at least 3-4 websites. Wireshark should be capturing your web session packets while in the background.
- Stop the capturing process and apply
dnsas a display filter in your trace file in order to see onlydnspackets. - Now, select any
dnsresponse packet from the list pane and expand the corresponding DNS section in the details pane for the same packet. Right-click on the Time parameter and click on Apply as Column. Refer to the following screenshot to see this: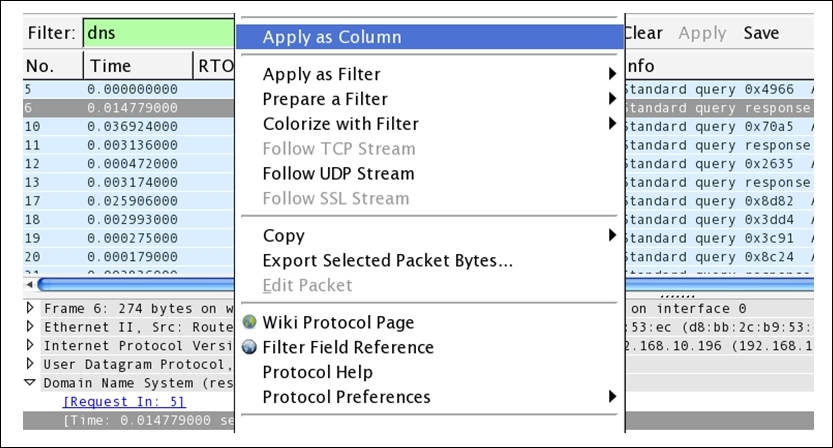
Figure 8.18: Applying DNS Time parameter as column
- Once you've done this, you will see a time column next to the info column in the list pane.
- Our next objective is to sort the column in a descending order to figure out the highest DNS response time. Refer to the following screenshot to replicate the same:
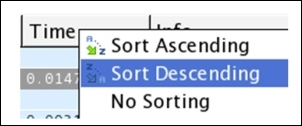
Figure 8.19: Sorting the DNS time column in a descending order
- Once this is sorted, you would be able to see the session details in the list pane with the highest DNS response time that can be used to investigate further. If the server belongs to your premises, then you are the only one who has to take care of it. Refer to the following screenshot that illustrates this:
Figure 8.20: High DNS response time
- Seems like some of the servers are responding really slow, and this badly affects your overall web surfing/networking experience.
- Similarly, you can create an IO graph to see the whole scenario in a graphical form, and it would be far easier to visualize and understand the case. Refer to this screenshot that illustrates this:
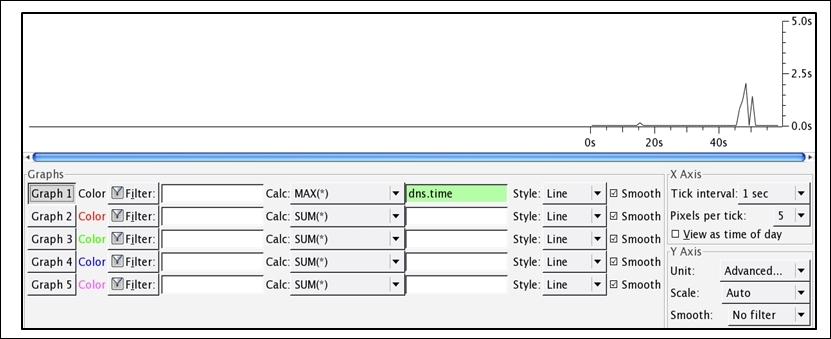
Figure 8.21: DNS high response time depicted with the help of an IO graph
You can easily observe in the preceding graph that the DNS response time was quite high and reached to an approximate of 2.5 seconds, and it is something that should be taken care of.
Through the preceding realistic examples, I hope you have understood the approach that can give you a kickstart in troubleshooting such scenarios in future corporate infrastructures, which you might be asked someday to troubleshoot.
Next, we have a commonly occurring issue in corporate networks. You might have already gone through the harsh suffering of troubleshooting them using various hardware and software tools. The first thing to do is to understand what these issues are and what kind of problems we can we face.
When packets are queued up or there is a delay in the transmission process between the host, which is not expected to happen, you might think "why do such delays happen?" The answer to this depends on many factors such as when your system of the server side is not able to send/receive information with the speed at which it is being processed. These kind of issues severely affect the performance of networks by slowing the rate at which the TCP/IP packets are transmitted, because of which the data between the hosts starts moving back and forth at a comparatively slower rate.
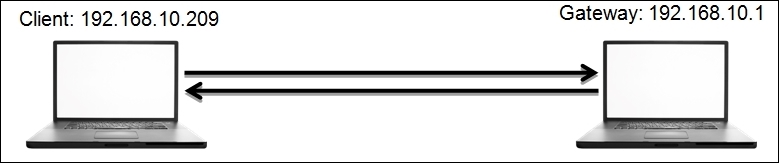
Using my small LAN network, I decided to create an exercise, which you can also replicate on your end easily. For the infrastructure, I have a gateway at 192.168.10.1 and my client at 192.168.10.209. Refer to the following figure that illustrates this:
What you need next is a network traffic generator. Research it a bit and try to use anyone that makes you feel comfortable. Lastly, you need a ping utility, which is already installed on every known operating system.
So, here's the scenario. I will start a non-top ping from the client to the server. While the client is pinging, I will launch the traffic generator application, which will try to interrupt the ping process by trying to consume the gateway's resources in order to create a bottleneck scenario for the client.
We will first see a normal traffic pattern in the IO graph so that we would work as our baseline when we would be required to compare with the bottleneck issue. Here is the screenshot for the normal traffic pattern shown in terms of an IO graph:

Figure 8.22: Normal traffic in an IO graph
In the preceding graph, no major deviation can be observed; hence, we can include such a traffic pattern while creating a baseline for our network. Just the ICPMP packets are sent from the client to the server without much trouble.
Next, I want you to see and observe the difference between the traffic pattern that we saw and the one below the IO graph, which was captured for the same network infrastructure. However, there was one more application that was involved in the replication of the event, which generated unnecessary traffic. This resulted in network clogging, which is popularly known as a bottleneck.
The application I used is the network traffic generator that can be used to deviate a normal traffic pattern. This results in a network bottleneck scenario and can even result in a denial of service. Refer to the following screenshot for reference:
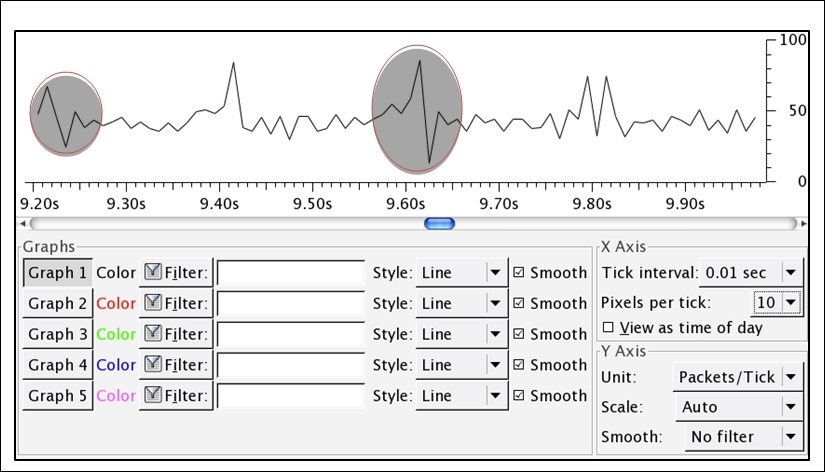
Figure 8.23: A bottleneck scenario
Bottleneck issues are represented by ups and downs, as shown in the preceding graph. The rate at which the throughput drops is the same rate at which it jumps up, and this pattern of deviation in normal traffic denotes that there is a bottleneck being formed.
When every technique you know about troubleshooting fails, then at the end, you can use the network baseline, which can prove worthy while dealing with the slowness of the network. As discussed earlier, a network baseline is just crucial information that you have collected through various points in your network. The sole purpose of the network baseline you have is to compare abnormal traffic with it in order to understand the level of deviation.
We already discussed slow DNS and HTTP responses that make up your web surfing experiences. If you already have a baseline regarding your network, then it would be thousand times easier for you to troubleshoot. You would be able to identify the root cause of the situation you are dealing with, and definitely, this will save a lot of time for other analysis.
Remember one thing that the baseline created for two different networks can vary in vast aspects, so you should not compare them with each another. An interesting and creative way of creating a baseline would be to create separate baselines, that is, one for the network, one for the hosts in your network (how well they coordinate with each other without creating much noise), and one for the applications communicating over a network.
While creating baselines, you can also consider each and every site you are working with separately. In my opinion, the best approach would be break up each site with similar categories. When you are dealing with a WAN, a troubleshooting site baseline can prove useful. Several components can be considered while dealing with WAN sites, such as data transfer rate, several applications in use, the pattern of the broadcast traffic, and various other categories that you may come up with can come handy while making a standardized baseline for a particular site.
Troubleshooting slow networks is definitely a piece of art. I would say, you won't be able to get its real gist unless you get your hands dirty. With experience, you will gradually gain the insight required to solve problems ranging from slow Internet to complex infrastructure-related issues
There can be scenarios where applications running in your network can be one of the major sources of issues that clients face. You cannot blame the network every time for not working popularly; there can be other reasons as well for the anomalies. When troubleshooting any application-based issue, capturing packets from one end won't be fruitful enough. You should try to move to analyzers all around and capture as many traces of the application's traffic as possible. Capturing from multiple points will give you a much closer insight into network-based applications.
As discussed earlier, you can create baselines by following certain different parameters. Similarly, for network-based applications, there can be a certain defined set of rules, by using which the best baseline for your network can be formed, for example, dependencies applications have another coordinating application, analyzing the startup and shutdown process, the rate at which the application transmits packets, various protocols that coordinate in order to make the application work flawlessly, the way an application interacts with the network once a new installation is in process, and so on.
While creating a baseline for application-based performance issues, it won't be feasible all the time to capture traffic directly from the complaining hosts because it may cause the hosts to suffer high-traffic load and might make it unusable. For your trace file, there might be an unusual number of dropped packets that would get captured and would make your application baseline less appropriate.
As long as dissectors in Wireshark are able to translate the application-based requests and responses in a plain-text format, you are good to go. In the following section, I will take two popular application protocols, HTTP and DNS, to illustrate a few basic scenarios that you can replicate in order to follow the methodology.
First, we will look at the HTTP application-based anomalies. Remember that you should be able to identify the responses from the error-prone application if you are aware of the response code. As you know, HTTP is based on the request/response model, where a client requests for a certain resource to the server and the server responds with the valid resource if available; if not, then with a certain error code, which your browser is able to translate.
HTTP error codes are categorized into five sections of errors, where each error is based on certain logical parameters. To learn more about error code, visit http://www.w3.org/Protocols/rfc2616/rfc2616-sec10.html. For illustration purpose, I will explain the procedure so that you can figure out the most commonly seen error code, which is client errors.
The infrastructure I am going to use is pretty simple, easy, and similar to the one that we used earlier. The client is located at 192.168.10.196 and the gateway is located at 192.168.10.1. I will try to make a few requests to the gateway and a few to any web server located in the wild (note that my intention is just to replicate error code that you can see in the list pane of Wireshark, and not to compromise any web server.)

At first, we will try to generate some client error code. Follow the next steps to walk through this; otherwise, you can just read it once and then replicate the whole scenario:
- Open your browser and visit the default home page of your gateway. Hopefully, it will present you with a login screen like the one shown here:

Figure 8.24: The gateway's Login panel
- Open Wireshark, and let it run in the background while capturing all your activities.
- Enter an incorrect password in the password field and click on Login. This will show you the incorrect login name and password message on the screen or something similar.
- Next, visit any random website and click on any link. After the link is successfully opened, change the web extension of the web page visible in the address bar to anything such as
.foo,.abc, and so on. Doing this will give you an error on the web page, such as page not found. Just ignore it for time being. - Now, come back to Wireshark and stop the packet capturing process that we started earlier.
- You should be able to see a number of packets in the list pane, but our concern in this section is to look at error code messages and nothing else.
- Now, click on the display filter box and apply the
http.response.code > = 400filter. Then, click on apply. Refer to the following screenshot that illustrates this:
Figure 8.25: Display filter
- Once the filter has been applied, you will be able to see only those packets that match the criteria. Refer to the following screenshot that illustrates this:
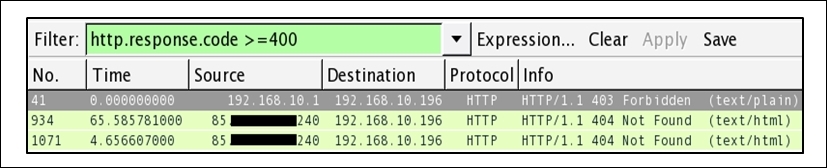
Figure 8.26: HTTP Response code >= 400
- See, how easily you were able to identify error code from an enormous trace file.
- You can also create a button for the same. Once you click on it, you will only be able to see relevant packets. You can colorize them for a better viewing experience.
- We learnt about Coloring options in the earlier chapter. I want you to learn how to create a button for specific display filters this time.
- Do not clear the current filter; just click on the Save button that is next to the Apply button in the display filter area.

Figure 8.27: The display filter toolbar
- Once you click on Save, you will be presented with a dialog. To provide a name for the button, specify any name of your choice and click on OK. Refer to the following screenshot that illustrates this:

Figure 8.28: Creating a button
- Once you click on OK, you will be able to see the button next to the Save button in the display filter toolbar area.
- Now, whenever you want, you can create a similar display filter without typing it into the display filter box. You just need to click on the button that you created recently.

Figure 8.29: The newly added button
To make this more interesting, I would advise you to create a coloring rule for the HTTP 404 error. This will definitely help you identify particular error types more conveniently.
Next, we will see another application protocol that is commonly used by various applications in order to translate a domain name to its IP address. Yes, I am referring to DNS. As we know, the DNS protocol runs over a UDP or TCP. There are various response code that relate to DNS errors that range from 0 to 21. The dissectors present in Wireshark do know about response code. Using this, Wireshark is able to show you messages relevant to the error code. To replicate an error, I will visit a website that does not exist on the Web; hence, I will receive an error. But my gateway does not know about this, so it will try to resolve the IP address associated with that name. In return, we will see a DNS response containing an error. The infrastructure is the same that we used in the preceding examples. The client is located at 192.168.10.209 and the gateway is at 192.168.10.1.

You can replicate the scenario step by step with me or do it later once you finish reading. Follow these steps to replicate the scenario:
- Open Wireshark, and start capturing. Let it run in the background.
- Open a terminal (Command Prompt) of whichever operating system you are using, type
nslookupin it, and press Enter. - Now, you'll enter the interactive mode of the
nslookuptool. If you are not aware of the tool, do read about it before you proceed. There are plenty of documents available for the tool. Refer to the following screenshot: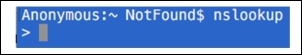
Figure 8.30: The NSLOOKUP tool
- To generate DNS error response code, just type any domain name and press Enter. Before you specify a domain change the type of query to
Aby using theset type=acommand and then give the domain you want.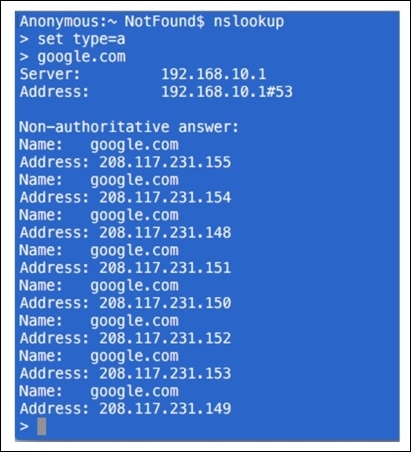
- First, we can try the same for a domain that exists, such as google.com. Then, you can try it for the nonexistent domain. Refer to the Figure 8.31 shown here.
- The preceding screenshot shows the various IP addresses that are associated with the google.com domain. The domain already exists. That's why we are able to see the reply. What if you try a domain that doesn't exist. Refer to the following screenshot that illustrates this:
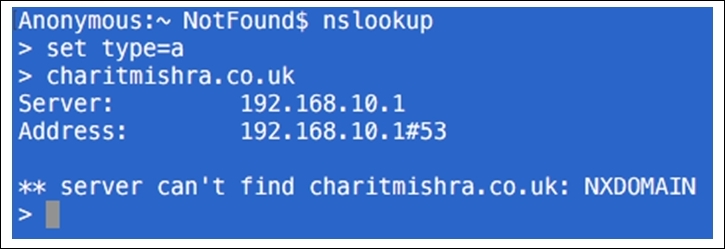
Figure 8.31: The nonexistent domain
- I typed my name in place of the domain name and pressed Enter, and this is what I saw because there was no domain with that name. The DNS server was not able to resolve an IP address, hence resulting in the reply
server can't find. - Now, you can go back to Wireshark and stop the capture process. We will now start analyzing error code.
- The best option would be to segregate the DNS error response code from the normal frames in the trace file that we have. To achieve this, apply the
dns.flags.rcode == 3display filter, which means that the shown DNS response frame with error code3is for nonexistent domains. For more information on DNS error code, visit https://tools.ietf.org/html/rfc2929. - Once you have applied the preceding display filter, you will only see relevant packets matching your filter expression.
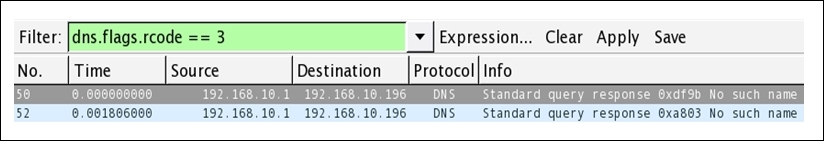
Figure 8.32: DNS error response
- As you can see in the list pane, only packets that are related to error code
3are visible. - If you want, you can save the filter expression in the form of a button for later use following the same approach we used earlier.
Troubleshooting application-based issues depends on how well you are aware of the error code. There might be a case that you can witness where you don't have the option of installing Wireshark for your assistance. You will be presented with error code for troubleshooting purposes. So I recommend that you at least know about the common error codes in the most popular application protocols that are normally used.