
Materials for energy efficiency and thermal comfort in domestic buildings
Abstract:
There are more than 22 million dwellings in the EU27 and approximately 8 million dwellings in USA and Canada that were built before 1919. A large proportion of these are likely to be of uninsulated solid wall construction. The UK has between 5.5 and 7.3 million solid wall dwellings. They are potentially responsible for almost 50% of the total CO2 emissions attributable to the UK housing stock with heat loss through the solid wall the primary cause of these emissions. Architectural vernacular barriers to the adoption of external wall insulation have perhaps been overstated as less than 25% of solid wall dwellings are in conservation zones in the UK. Technologies and systems based on conventional insulation materials have been available in the marketplace for the past three decades. The carbon payback for these systems is less than 2 years but the economic payback computed using whole life cycle costing metrics is decades in length. Alternative legislative and policy approaches are needed to stimulate this marketplace as the achievement of national emission targets are unlikely if this technology is excluded as a consequence of perceived economic or socio-cultural barriers.
22.1 Introduction
It is widely recognised that if the EU is to meet its CO2 emission reduction targets in the coming decades then the energy efficiency of the existing housing stock will have to be improved dramatically (Levine et al., 2007). A particular problem is the prevalence of solid wall dwellings in the stock. This chapter aims to provide some degree of quantification of the scale of the challenge in terms of numbers of dwellings. It then goes on the consider the situation in the UK in particular to quantify the contribution of solid wall dwellings to housing stock and national CO2 emissions. Existing solutions to address solid wall fabric heat loss applicable to the UK are then considered from the perspective of carbon payback, the market, the householder and the cost. Conclusions are reached which may have relevance to where materials research might be necessary in the future.
22.2 EU domestic housing stock
There were reported to be approximately 166 million dwellings in the EU27 in the year 2000 (UNECE, 2006). Of these, 50% were located in three countries: Germany (22%), UK (14%) and France (14%) (Fig. 22.1). The housing stock in each country can be disaggregated by age of construction to reveal quite disparate results depending on the country considered (Fig. 22.2). For instance, the proportion of the existing national housing stock built before 1919 was highest in Denmark (21%) and lowest in Greece (3%). Interestingly, figures for North America show that approximately 8% of the existing housing stock was built before 1919.


Translating these raw statistics into construction type is made difficult by the transition of architectural vernacular adopted in each country. This was found to be quite disparate. For instance, in Denmark the conventional wall construction method changed from uninsulated solid wall to uninsulated twin leaf cavity around 1930 whereas in Greece this transition occurred in 1960 (Balaras, 2003). Similarly, the transition from uninsulated to insulated cavity wall occurred around 1950 in Denmark compared to 1980 in Greece.
22.3 UK domestic housing
The UK domestic sector is responsible for 27% of total CO2 emissions and 28% of primary energy use in 2006 (DEFRA, 2009). Primary energy consumption has risen by approximately 20% since 1970 (BERR, 2009). Energy intensity per household has fallen by approximately 11% whereas the number of households has risen by 40% over the same time period (DEFRA, 2009). The predominant cause of energy consumption (and subsequent CO2 emissions) is space heating energy (BERR, 2009). This was responsible for approximately 58% of total domestic sector primary energy use and 47% of total domestic sector CO2 emissions (BERR, 2009). Clearly, then, the development of a strategy that leads to a reduction of between 36 and 42% in national CO2 emissions by 2020 and an 80% reduction by 2050 (DEFRA, 2008) are only likely to be successful if they encompass pathways that lead to a reduction of domestic space heating demand.
22.3.1 The stock
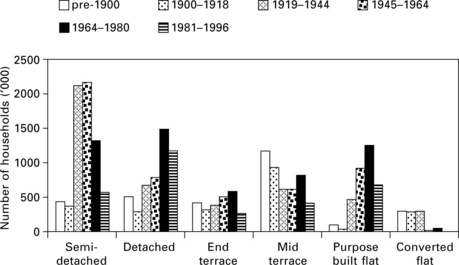
In 2007 there were approximately 25.5 million households in the UK; 21.2 million in England, 2.3 million in Scotland, 1.3 million in Wales and 0.7 million in Northern Ireland. It is possible to disaggregate these by age and type of dwelling (Fig. 22.3) (DCLG, 2008). Some 64% of the housing stock was built in three distinct periods; 1919–44, 1944–64, 1964–80. In the relatively recent past, then, there have been three distinct booms in housebulding largely associated with population growth, post-war renewal and slum clearance (Hinnels, 2006).
Disaggregation by age and type of dwelling is important as it begins to allow analysis of the range in constructions prevalent in the stock. The two principal construction methods for housing in the UK are solid masonry and cavity masonry. It is reported that these account for approximately 6.6 million (26%) and 12.6 million (49%) homes in the UK respectively (BRE, 2008; Shorrock and Utley, 2003). An alternative study considered the range of solid wall dwellings in the UK as being between 5.9 and 7.3 million dwellings (Pett, 2001). Estimating these proportions is a non-trivial task, made so by the relatively slow transition from solid wall to cavity wall that took place largely in the first half of the 20th century. The first recorded example of a cavity wall involving wall ties (as opposed to bonded bricks) was in the Isle of Wight dating from the 1840 s (Lewis, 2009). Cavity wall construction became commonplace in the 1930s and effectively became mandatory after the 1965 Building Regulations (Pett, 2001).
22.4 Building fabric heat loss and CO2 emissions
It is interesting to compute the heat loss characteristics of different wall constructions so that the proportion of total CO2 emissions arising from heat loss through the external wall of a dwelling can be estimated. From this, the importance of reducing heat loss through external walls can be explored relative to the overall CO2 emission reduction targets discussed earlier.
The heat loss characteristics of a wall can be modelled using, for instance, knowledge of the construction method coupled to the standard U-value calculation approach (Anderson, 2006). However, it has been reported that the measurement of in situ U-value of solid walls generally produces lower values than those computed in the manner described. A recent study for Historic Scotland, for instance, found substantial variation depending on the internal finishing (Table 22.1) (Baker, 2008). This is not unexpected if one considers the variation in air voids that will be created by the construction detailing.
Table 22.1
In-situ measurement of solid walls
| 600 mm masonry walls – internal finish description | U-value range (W/m2·K) |
| Wall plastered on the hard | 1.5 ± 0.4 |
| Wall with lath and plaster | 1.0 ± 0.3 |
| Wall with plasterboard | 0.9 ± 0.1 |
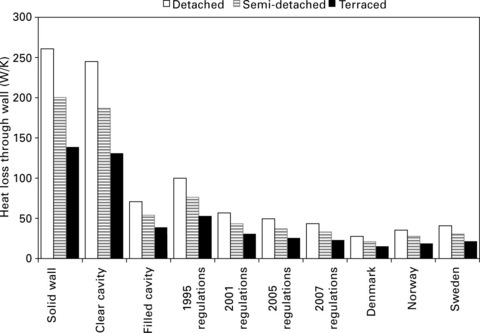
In addition to the transition from solid wall to cavity alluded to earlier, domestic sector construction methodology has undergone change as a consequence of changes to the building regulations. Since the OPEC crisis of 1973 the focus of this regulation has been on reducing the heat loss characteristics of new dwellings with this emphasis accelerating over the last 15 years. The effect of the changes in regulation on heat loss characteristics of a typical detached, semi-detached and terraced dwelling (112m2, 20% glazing ratio) were computed using steady state computer models developed for the TARBASE research project (Peacock et al., 2007) (Fig. 22.4). The data for the dwellings as if built to Nordic regulations (much of which has been in place since the mid-1970s) is shown by comparison. The heat loss characteristics of the solid wall dwellings can be five and six times that of a dwelling built either to Nordic or more recent UK standards.
22.4 Effect of wall construction and insulation level on the heat loss characteristics of a detached, a semi-detached and a terraced dwelling of treated floor area 112 m2.
This has a substantial effect on the CO2 emissions attributable to the dwelling. It is possible to estimate the extent of this effect using the domestic stock model developed by the Environmental Change Institute for the Building Market Transformation research project (Hinnels, 2006). Between 27 and 47% of total domestic sector emissions can be attributed to solid wall dwellings in the UK dependant on the transition of prevalent construction technology adopted by the UK construction industry (Fig. 22.5).

22.5 Proportion of total UK domestic sector emissions that is attributable to dwellings of solid wall construction.
It is possible to quantify the extent to which emissions arising from the occupation of solid wall dwellings are predicted on replacing the heat lost through the solid wall. For instance, for a detached dwelling with a wall U-value of 1.5 W/m2·K, a natural gas-based heating system and ownership and usage factors for appliances typical of a family of average income with two children, the proportion of total household emissions attributable to heat loss through the wall is approximately 30–40% depending on the treated floor area (Fig. 22.6). A similar exercise can be performed for semi-detached (25–35% of total CO2 emissions associated with heat loss from the wall) and a terraced property (20–30% of total dwelling CO2 emissions associated with heat loss through the wall). These ratios can be applied to the stock model exercise indicated above to estimate that approximately 2–5% of total UK CO2 emissions could be attributed to the energy required to replace the heat that is lost through solid walls of dwellings in the UK. It should be stressed that this figure should be taken as a guide only but it is interesting to frame data in this manner as it allows different narratives to be explored. For instance, placing this figure in some perspective, this is somewhere between 8 and 25% of the CO2 emissions arising from UK coal-fired electricity production in 2007 (BERR, 2009). It is a substantial figure and addressing its scale through supply side measures would be extremely challenging. It would seem likely that if the UK domestic sector is to contribute towards the reduction in CO2 emissions enshrined in the Climate Change Bill (DEFRA, 2008), then measures that address this solid wall construction will have to be developed, marketed and promoted.

22.5 Architectural vernacular
The ability to treat solid wall dwellings is compromised to some degree by their historical and (by extension) cultural importance. The conservation movement was initiated in the UK by William Morris who founded the Society for the Protection of Ancient Buildings in 1877. His aim was to ‘treat our ancient buildings as monuments of a bygone art, created by bygone manners, that modern art cannot meddle with without destroying’ (SPAB, 2009). The ethos encapsulated in this statement was initially applied to institutions or the land-owning class but over almost a century it diffused to address all aspects of architectural heritage as witnessed by the legislative creation in 1968 of conservation areas. There are approximately 14 500 conservation areas in the UK (CIPFA, 2001). The description of a conservation area is those areas that have a ‘Special architectural or historic interest, the character or appearance of which it is desirable to preserve or enhance’ (OPSI, 1990).
It has been estimated that 1.2 million dwellings are located in conservation areas in the UK (Bottrill, 2005). If we consider the ethos and descriptions of conservation areas, it is reasonably safe to assume that the vast majority of them will be considered with pre-1919 housing. Whilst a number of these may have used other construction methods (e.g. timber frame), it is thought that the majority would be of solid masonry construction. To simplify matters, if it is assumed that all 1.2 million dwellings contained within conservation areas are of solid masonry construction, then this would constitute 13% of all solid masonry dwellings or approximately 5% of all UK dwellings.
A market barrier that is often quoted with respect to the uptake of external wall insulation in the UK is planning issues associated with the preservation of specific architectural vernacular. Whilst this may represent an insurmountable problem for a number of properties, the substantial majority of solid masonry dwellings would not appear to be encumbered by this specific barrier. It is also relevant to consider the purpose of the legislation; ‘May form groups of buildings, open spaces, trees, historic street patterns, village greens or features of historic or archaeological interest. It is the character of the areas rather than individual buildings, that Conservation Areas seek to enhance’ (DCLG, 1994). It would seem to be related therefore to the mood, feeling and character of the public architectural space defined within a particular conservation area. This public space need not necessarily be concerned therefore with modifications to the rear of the dwelling. It is thought, for instance, that as much as 60% of the total building envelope of a Victorian terrace is at the rear of the dwelling (Lowe, 2006).
22.6 Intervention strategies
With solid masonry construction there are two clear pathways to achieving a reduction in fabric heat loss, namely internal and external wall insulation. Ignoring the relative effects of each approach on the thermal performance of a dwelling for a moment, it is useful to explore the impact of solid wall insulation in comparison with other technological intervention strategies possible in individual dwellings.
A range of different strategies are possible with, for instance, the UK utility supplier obligation (OFGEM, 2008) potentially offering a choice of 17 different interventions for a single dwelling. The TARBASE research project was a £1.4 million research project that was conducted between 2004 and 2009 and was part of the Carbon Vision Buildings suite of projects (TARBASE, 2009). The aim of project TARBASE was to model technological solutions (end use equipment, building fabric, heating, ventilating and air conditioning (HVAC) and supply side) which would allow a radical, visible, step change input to policies and programmes designed to reduce the CO2 emissions attributable to the existing UK building stock by 50% by 2030. A range of different domestic building types were studied among which was a solid wall detached dwelling (Peacock et al., 2007). A series of bespoke models were developed throughout the research project to estimate the CO2 emission saving potential of different interventions, both singularly and in conjunction with other improvements. The relative importance of external wall insulation when compared with a range of other measures that could potentially be applied to the solid wall detached dwelling is shown in Fig. 22.7. If applied to 80% of the external wall, it outperforms all the technologies considered in Fig. 22.7. Even if applied to only the rear of the dwelling, external wall insulation has a greater impact on CO2 emissions for this dwelling than all other interventions other than 30 m2 of PV and 3 kW micro-combined heat and power (μCHP) systems based on fuel cell technology (that is unproven and yet to reach the market).

22.7 CO2 savings attributable to a range of different technological intervention strategies as applied to a detached solid wall dwelling of treated floor area 144 m2.
The ability of this dwelling to achieve deep cuts in CO2 emissions will clearly be compromised by the absence of external wall insulation. The individual measures shown in Fig. 22.8 were bundled together to form intervention sets for the solid wall detached dwelling. This assessment accounted for both the synergistic and antagonistic effects associated with combining interventions (in so much as they would be present).

22.8 Deep cut technological intervention sets with and without external wall insulation applied to the detached solid wall dwelling of 144 m2 treated floor area.
In the absence of external wall insulation, the 2020 targets could only be achieved by an intervention set comprising all the remaining heat saving fixes, the electricity saving fixes on all lights and appliances, solar water heating and 10 m2 of solar-PV. The 2020 target could be exceeded if the effect of extant, near-term climate change on reducing the intensity of the domestic heating season were accounted for. If the UK electricity infrastructure was successful in deploying 18 GW of network scale wind, 5 GW of coal plant with carbon capture and storage (CCS) technology and maintained 10 GW of nuclear capacity, it is feasible that an annual average grid emission factor (GEF) of 0.28 kgCO2/kWh may be achieved (compared to 2005 GEF of 0.52 kgCO2/kWh). If this potential externality was applied to the pre-1900 detached dwelling with demand side measures, boiler improvement, solar water heating and reduced heating season as a consequence of extant climate change, then the savings attributable to the dwelling would be approximately 49%. However, it seems fanciful that the 2050 target could ever be achieved for this dwelling if external wall insulation were not included in the package of measures.
The role of some form of solid wall insulation would seem to be paramount if the emissions-saving targets enshrined in the Climate Change Bill are to be met. This underlying conclusion is given greater weight by consecutive reports from IPCC which have confirmed with high agreement and much evidence that ‘energy efficiency measures in buildings can achieve substantial reductions in CO2 emissions using mature technologies that already exist widely and that have been successfully used’ (Levine et al., 2007). With solid masonry construction there are two evident pathways to achieving a reduction in fabric heat loss, namely internal and external wall insulation.
22.7 Internal wall insulation
The application of insulation to the internal face of the external wall has benefits in that the external appearance of the dwelling is unchanged. It therefore deals neatly with the issues associated with preservation of architectural vernacular. However, its deployment raises certain key issues associated with thermal mass. Internal insulation isolates the thermal mass of the wall from the internal space. Any internal gains or solar gains that are permitted into or are generated in the internal space will in effect be trapped by the insulating layer and their dissipation can only be achieved by the adoption of some form of ventilation schedule. These gains may be useful in offsetting heating loads during the heating season. However, they may also contribute to increased instances of overheating. A useful description of thermal comfort is that action taken by an individual to maintain their perception of a comfortable environment. This action may involve behavioural and/or technological adaptation.
Issues of overheating in UK dwellings may seem an opaque concept but there is some evidence to suggest that near-term, extant warming of the UK climate may precipitate a domestic cooling season. It is thought that early market growth in domestic air conditioning systems may be driven by distress purchasing during extreme events, for example the 2003 heat waves (Wright et al., 2005). There is, however, evidence from the United States to suggest that the eventual market saturation level of domestic air conditioning will be determined not by extreme events but by cooling degree days (Sailor and Pavlova, 2003). It is possible to apply the relationships developed in the US to predict the eventual prevalence of domestic air conditioning in the UK. When cooling degree days were computed using a base comfort temperature of 18.3 °C, no market for domestic air conditioning in Edinburgh and London was found when the 2005 CIBSE TRY climate files were used in conjunction with these algorithms. It is possible to morph the CIBSE TRY climate files using UKCIP02 algorithms to produce climate files that are indicative of those that might be expected in the time slice 2010–40, i.e. near term (Belcher et al., 2005; UKCIP, 2009). When these morphed climate files were used, a saturation level of 0.18, i.e. air conditioning would be installed in 18% of homes, was found for London. No market evolved for Edinburgh. If the action of UK householders to maintain thermal comfort as a consequence of near-term climate warming mimics the response of householders in the US, then in London alone 550 000 homes will install air conditioning equipment. The energy demand of domestic air conditioning systems has been estimated as being between 6 and 15 kWh/m2 p.a. (He et al., 2005). If applied to the whole house this would be between approximately 550 and 1400 kWh per annum although most systems would be expected to be constrained to specific areas of the dwelling, e.g. living room and bedroom.
Perhaps of greater concern than the rise in energy consumption, however, is the psychological or cultural message encapsulated in the widespread adoption of another energy consuming technology within the household at precisely the time when strategies are being developed to decarbonise service provision. This debate has been explored, for instance, by Wilhite who suggested that domestic appliances contain behavioural scripts, i.e. they alter the behaviour of the occupants in unforeseen ways (Wilhite, 2007). One example of this might be the effect of the volume of refrigerated space in the home on food consumption behaviour and the consequent area of chilled space in supermarkets. Another (and one to which Wilhite alluded) was that the behavioural scripts contained within domestic air conditioning systems may have contributed to the dominant role of the passenger car in the US transport network.
The certainty of extant climate change means that the single focus of building fabric mitigation strategies can no longer be to reduce CO2 emissions. Rather, any building fabric strategy has to have two unquenchable aims: (a) to be an adaptation strategy that is cognisant of extant, near-term climate change and does not compromise (indeed should aid) the capacity of the dwelling to achieve desired levels of thermal comfort by passive means during the summer months, and (b) reduces CO2 emissions attributable to the provision of services (heat, laundry, cooking, etc.) to the dwelling. For this reason alone, the widespread adoption of internal wall insulation without concurrent adoption of an appropriate and adequate ventilation strategy is likely to be a retrograde step, particularly in the south of the UK where these adaptation pressures are going to be most keenly felt.
22.8 External wall insulation
22.8.1 Market statistics
It is estimated that the solid wall insulation market is valued at £91 million at contractors’ prices (EST, 2008). This was reported to be split evenly between external and internal wall insulation. This data was reported to include domestic, commercial and industrial buildings. The total number of solid wall insulation installations is estimated to be 16 000 new builds and 17 500 retrofits per year (33 500 solid wall insulation installations in total).
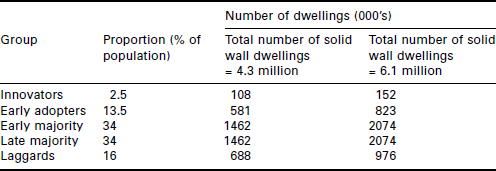
It is possible to make a series of assumptions to estimate the size the market will have to grow to in order that an external wall insulation intervention strategy might contribute towards the UK CO2 emission reduction targets. If we assume the number of solid wall dwellings to be between 5.5 and 7.3 million. If we further assume that 1.2 million of these dwellings are not suitable for external wall insulation because of planning restrictions. This leaves between 4.3 and 6.1 million dwellings. If we were to assume that external wall insulation was to be taken up over the decade 2010–20 in the target market, then the industry might be expected to accommodate between 430 000 and 790 000 installations per annum.
However, it is likely to be higher than this – unless the uptake of the technology is mandated through legislation. If the uptake of the technology is to some degree market led, it is likely to follow some variation of a classic diffusion model as proposed by Rogers (2003). Rogers defined five societal groups who are involved in the adoption of a technology at different stages. Taking a somewhat idealised approach, the proportion of the population that will fall into each category can be estimated (Table 22.2). These proportions can then in turn be applied to the number of solid wall dwellings in the UK – assuming that these groups will be distributed proportionately in this construction. Assuming that it may take five years to move through the first two classes, this would leave five years to 2020 to reach the early, late majority classes. This would represent installations of between 600 000 and 1000 000 per annum.
It is clear that the current level of market activity (17 500 retrofit including domestic, commercial and industrial) is nowhere near equivalent to either of these approaches. Even if this level of market activity was wholly domestic, it would take between 246 and 451 years to reach 100% market saturation.
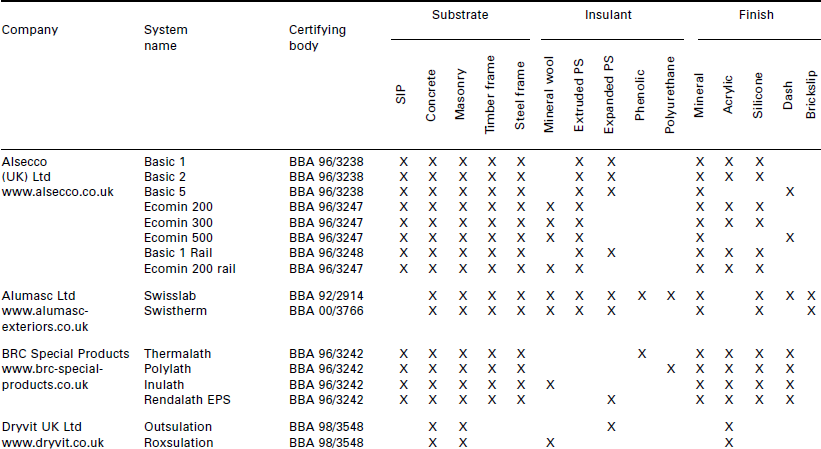
22.8.2 System types
There are 33 different external wall insulation systems from 10 companies that are registered on the INCA website and that have received certification for use as a building product, e.g. by the British Board of Agrément (Table 22.3) (INCA, 2009). These systems differ in specific details of their fixing (insulation to substrate and render to insulation) but can also be disaggregated by (a) their applicability to different construction methods, (b) the insulation material used and (c) the finishing material offered. The concept of technology maturity alluded to in the IPCC document is emboldened if one considers the modal certification date for these systems is 1996 with some systems having been in use since the 1970s. Conventional insulation materials are used, with thicknesses of 15 mm to 140 mm offered (Table 22.3).

22.9 Carbon payback time
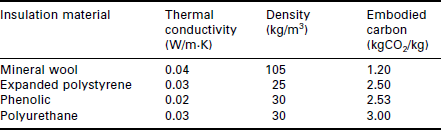
CO2 emissions are embodied in any technological intervention that may be deployed to reduce the operational CO2 emissions of a dwelling. It is important to consider the time period taken for the operational CO2 savings to exceed the CO2 embodied in the intervention. This can be termed the carbon payback of the intervention. To explore this using the conventional insulation materials shown in Table 22.3, a simple, generic external insulation system was specified (Fig. 22.9). This shows a series of timber dabs fixed to the substrate which effectively form an air gap between the substrate and the insulation. The insulation board is subsequently fixed to the dabs. The supporting mesh and cementitious render are for simplicity shown as a contiguous layer. The core material properties of the four conventional insulation materials are given in Table 22.4 – expanded and extruded polystyrene are assumed to have the same physical properties.

The effect of deploying the generic wall insulation system on the operational CO2 emissions of the aforementioned detached pre-1900 dwelling with the properties assumed in Table 22.5 was computed. The thickness of the external insulation material was varied to achieve whole wall U-values in the range 0.1 to 0.6 W/m2·K. The embodied carbon contained in the external wall system was simplified to include only the embodied CO2 emissions of the insulation material and the cementitious render.
Table 22.5
Three-bedroomed, pre-1900 detached dwelling – fabric and occupancy
| Property | Condition |
| External footprint | 144 m2 |
| Initial wall U-value | 1.6 W/m2·K |
| Glazing and door ratio | 22% |
| Net external wall area | 173 m2 |
| External wall area available for external wall insulation | 80% of net external wall |
| Location | Edinburgh |
| Whole house internal temperature | 20.4 °C |
| Occupants | Family of four – 2 adults working, 2 children at school. This defined for instance appliance usage and ownership and building occupancy |
| Heating system | Natural gas fired boiler, hydronic |
| Seasonal boiler efficiency | 88% |
| CO2 emission factor for natural gas | 0.19 kgCO2/kWh |
The embodied CO2 emissions for each of the insulation materials and the finishing render were taken from the ICE database (Hammond and Jones, 2006). The carbon payback for the generic external wall system deployed to achieve a range of different U-values for the external wall of the pre-1900 detached dwelling was computed according to Eq. 22.1.
where ![]() is carbon payback (months), EE is embodied CO2 emissions of the insulation and render layers, and EO is operational CO2 emissions saved as a consequence of deploying the external wall system.
is carbon payback (months), EE is embodied CO2 emissions of the insulation and render layers, and EO is operational CO2 emissions saved as a consequence of deploying the external wall system.
The carbon payback of all the external wall insulation systems was less than 2 years regardless of the resultant U-value achieved (Fig. 22.10). Given that the warranty offered on the majority of the systems shown in Table 22.3 is in the region of 20–30 years, this would seem to represent a rational outlay of initial CO2 emissions for the longer term.

22.10 Carbon payback time of external wall insulation systems with different insulation materials as applied to the solid wall detached dwelling.
22.9.1 Whole life cycle costing
The calculation of whole life costs was based on a discounted cash flow analysis of the costs and revenues associated with the investment in external wall insulation over a selected period of time (Masini et al., 2010). External wall insulation leads to a decrease in energy consumption and therefore expenditure on utility bills. The only economic benefit that is applied to the deployment of external wall insulation is the reduction in utility bills. Any other benefits (for instance, enhanced asset value) are ignored. The costs incurred by the deployment of an external wall system were assumed to be (a) the initial capital cost, (b) anticipated maintenance costs of the intervention, and (c) energy costs of the dwelling over a nominal 25-year study period (2005–30). This seemed a reasonable time frame as defined by the warranty attracted by the installation of an external wall system. The pre-1900 detached dwelling described in Table 22.5 was used in this exercise.
The selection of discount rate is a key variable in defining the net present value (NPV) of an investment and its assignment is a matter of some contention. While it is reported that studies evaluating energy efficiency technology typically use a discount rate of 4–8%, the discount rate used here was 3.5%, as this is the discount rate recommended by the UK Treasury in the appraisal of any investment in the public sector (Geller and Attali, 2005; HM Treasury, 2003). The whole life cost of the interventions proposed and the base case scenario for this study is represented by the generic WLC equation:
• C is the capital cost which includes the initial investment for the external wall insulation and the system design (this will be equal to zero for the base case).
• A is the sum of all the yearly anticipated operation and maintenance (O&M) costs.
• M is the sum of non-annually recurring operating, maintenance and repair costs.
• E is the energy cost, i.e. the sum of the yearly gas and electricity expenditure.
• R is the replacement cost, i.e. the sum of all replacement anticipated over the life of the intervention.
• The PV subscript indicates the present value of each factor.
The WLC of each intervention set was calculated over a 25-year period and expressed in NPV terms. The base date chosen was 2005 and hence the values of variables such as cost of energy consumed, capital and operational costs of the technologies relate to this base date. The major assumptions made in producing the costing assessment are given in Table 22.6.
Table 22.6
Major assumptions used in the WLC calculation
| Property | Condition |
| Capital cost of system | £93/m2 [Peacock et al., 2009] |
| Total cost of system | £12 850 |
| Periodic maintenance assumption | 2% of wall area every 8 years |
| Periodic maintenance cost | £250 |
| Initial utility tariff (gas) | £0.0208 |
| Energy saving (80% of external wall) | 7750 kWh |
The discounted cost of the investment was computed using a range of different annual increases in gas utility tariff. Only when these annual increases became substantial, i.e. 12% each year of the period studied, did the discounted cost of the investment in external wall insulation reach zero within the 25-year period (Fig. 22.11). It would therefore appear that only a limited economic case can be made for investing in an external wall system of the type described here. A number of extremely important caveats need to be considered when arriving at this conclusion, however, some of which are discussed in more detail.
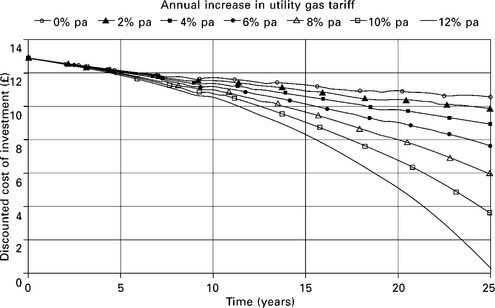
22.11 Effect of annual gas tariff increase on the discounted cost of investing in external wall insulation for the solid wall detached dwelling.
Caveat 1
The only benefit that is applied to the installation of the external wall system is the resultant fall in utility bills for the dwelling. The presence of secondary benefits that are outside the narrow remit of energy consumption have been the subject of numerous studies dating back more than 15 years. However, their identification has not led to their inclusion in conventional techno-economic assessment of energy efficient technologies of the sort being carried out here. Space does not permit an adequate assessment and subsequent quantification of the specific secondary benefits that may be accrued by the deployment of external insulation systems. It does, however, represent a significant research gap. An excellent review of the literature concerning the quantification of the co-benefits of improved efficiency in buildings is provided by Ürge-Vorsatz et al. (2009).
Caveat 2
The capital cost figures were sourced from a current market entrant in 2005. The current total market size for retrofit external insulation wall systems in the UK is approximately 17 500. As we have seen, if this technology is to contribute to the UK CO2 emission reduction targets, the number of installations per annum will probably have to rise to somewhere between 0.5 and 1.0 million per annum. This market growth will fundamentally alter the supply chain dynamics and knowledge/skill base of both the system acquisition and the installation of the product on site.
In order that the discounted cost of the system is zero or less over the 25-year period (assuming that the rise in utility gas tariff is 3% p.a.), the capital cost would have to fall from £12 800 (£93/m2) to £5 400 (£39/m2). Assuming that the required market growth indicated above is realised and that the number of installations grew to approximately 600 000 per annum, this would represent a learning rate (reduction in capital cost per doubling of market volume) of 19.5%. This is not a fanciful figure given the range of rates reported in the literature for a range of technologies, some of which are not subject to the strict rigours imposed by factory production (Table 22.7) (Tam, 2007).

Clearly, this learning rate would benefit building owners or householders who were late market entrants. The number of systems that would have to be installed to achieve this fall in capital cost would be approximately 270 000. If these systems were to receive a subsidy (a learning investment) to reduce the capital cost to the level enjoyed by the late entrants, the total cost of subsidy would be approximately £561 million. However, as important as identifying the possible size of subsidy required is the intention of using it specifically to promote technology diffusion in the marketplace. The mechanism of distribution, marketing, start-up and exit strategy of any subsidy scheme is as important as the scale of the subsidy itself (Heimdal and Bjørnstad, 2009).
Caveat 3
Narrow techno-economic assessments of the sort carried out here assume that householders are (a) rational economic actors who obey price signals and act accordingly and (b) have the ability to view investments over a long time frame (in the case cited here – 25 years). The perception of cost and value is not, however, as precise an exercise as perhaps the whole life cycle costing exercise suggests. The WLC approach neglects important cultural signals that may exist to link consumerism and ownership with, for instance, status, aspirations and societal responsibility. The extent to which the consumer becomes aspirationally attuned towards ownership of an energy efficient dwelling may play as important a role in the evolution of a mass market for energy efficiency products as their capital cost.
22.9.2 Householder willingness to pay
To explore the relationship between householder perceptions and cost of intervention strategies, the TARBASE research group conducted a ‘willingness to pay’ survey between 31 March and 4 April 2008. It was representative spatially and socio-demographically amongst 1004 UK homeowners over the age of 18. The aim of the survey was to probe householders’ response to the idea of spending relatively large sums of money on energy saving technologies. The timing of the survey was such that it was after the collapse of the Northern Rock Bank in the UK but before the fall of Lehman Brothers. An element of the effect of the credit crunch was already prevalent at the time of the survey. This is an important factor in considering its relevance to today’s market conditions. An overview of some key findings from the survey is provided here. A more comprehensive analysis has been conducted by Berry et al. (2009).
The respondents were asked to consider purchasing a set of measures that will (a) save 60% of their current fuel bills but will have a one-off fee of £10 000, (b) save 40% of their current fuel bills but will have a one-off fee of £5000, or (c) save 20% of their current fuel bills but will have a one-off fee of £1000. A brief description of the type of technologies was provided. These included insulation measures, although a precise description of external wall insulation measures was not provided. The approximate fiscal saving associated with a 60%, 40% and 20% reduction was not provided although the respondents were informed that the average UK household utility bill was approximately £1200. This allowed the respondents to calculate a saving and simple payback themselves if they so desired.
Not unsurprisingly, the proportion of respondents who were very interested in purchasing the measures increased as the cost fell (Fig. 22.12). Interestingly, 5% of respondents (53 in total) were very interested in spending £10 000 on the heat saving fixes (Fig. 22.12). Potentially, this is an extremely important group. If we consider Rogers’ model of new product diffusion that was discussed earlier, this group could be said to represent the innovator sector – those people who would be willing to adopt a new technology or in this case basket of technologies.
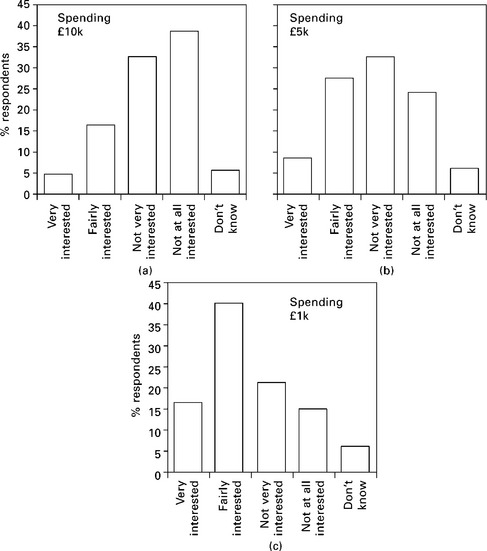
22.12 Proportion of respondents who would be interested in purchasing energy saving technological interventions.
Two key factors that distinguish this potential innovator class are selected for analysis here. The first is the gross household income. The innovator class was found to be wealthier than the group as a whole. The average household income in the survey was approximately £30 000 p.a. The average household income for those respondents who were very interested in spending £10 000 on energy efficiency technologies was found to be approximately £40 000 p.a. with an analysis of variance revealing a statistically significant difference (P-value = 0.0) found between the respondents as disaggregated by their willingness to pay (Fig. 22.13). The size of the innovator sector also increased as the income level increased (Fig. 22.14). For instance, it was found to be 3.6% and 9.5% of respondents for income levels below and above £30 k respectively and 14.5% for respondents with salaries in excess of £70 k p.a.


Another key discriminating factor associated with the innovator sector was that they were more likely to expect the value of their home to be positively affected by the adoption of energy saving measures (Fig. 22.15). Indeed, approximately 80% of respondents in the innovator sector thought that the value of their home would increase by at least as much as the cost of the interventions themselves. This suggests that the motivation for adopting these measures remains predominantly fiscal. The innovator sector perceives that the interventions will at worst be cost neutral when asset value is considered.

22.9.3 Other factors
Respondents who had children were more likely to be in the innovator sector – 7% compared to 4% of those respondents who did not have children in the house. The respondent’s educational attainment was not found to be a clear indicator of a positive attitude to adopting energy efficiency measures, whereas it was found to be an indicator of a negative attitude to their adoption. For instance, of those respondents who had some form of tertiary education qualification, 5.7% of respondents were found to be in the innovator sector compared to 5.1% of those who had no tertiary education qualification. However, 33% of respondents with a tertiary education qualification expressed no interest in spending £10 k on energy efficiency measures compared to 41% of those with no qualification. A series of behaviours were described and respondents were asked whether they had carried them out to reduce energy consumption in their home. These included replacing incandescent light bulbs with CFLs, monitoring household energy consumption and not leaving appliances on standby. Whilst the innovator sector suggested that they were more likely to display these kinds of pro-environmental behaviour, the differences were marginal and were not found to be significant when compared to other sectors.
The respondents were asked if they would be interested in having an energy-related makeover for their home where a company came in and carried out all of the work in a short period of time. They responded on a scale of 1 to 10 where 1 is not at all interested and 10 is extremely interested. The innovator sector scored 8.2 on this measure indicating strong support for this type of one-off deployment. A potentially major barrier to the adoption of deep cut intervention sets is the transactional exhaustion associated with the householder having to deal with more than five companies/technologies to achieve the overall savings.
22.10 Summary
The UK domestic stock is responsible for approximately 27% of total UK CO2 emissions. By disaggregating this stock it is possible to deduce that almost half of the total emissions from the sector can be attributed to solid wall dwellings. In turn, the proportion of the total emissions of a single dwelling that are as a consequence of heat loss from a solid, uninsulated wall are between 30 and 40%. There is therefore a compelling case for the widespread adoption of fabric improvement measures.
External wall insulation systems should be favoured over internal insulation systems as the latter may exacerbate the potential emergence of a domestic cooling season in the south of the UK as a consequence of isolating the thermal mass of the dwelling from the internal space.
A substantial number of solid wall dwellings would appear to exist that are outside conservation areas in the UK and therefore not necessarily subject to planning restrictions associated with a change in appearance.
The existing market for external wall insulation systems is extremely small but technologies exist based on conventional insulation materials that have been in the marketplace for as long as 20 years.
The carbon payback for external wall insulation systems is likely to be less than 2 years. However, based on a narrow techno-economic calculation, the economic payback time is unlikely to be anything much less than 25 years even with substantial reductions in capital cost. There is an urgent need to broaden the scope of this form of analysis. To a degree the applicability of technological innovation is a function of the narrative and story that we generate. Successive studies have shown on the one hand that the achievement of deep cut emission targets cannot be realised without domestic sector intervention, whilst at precisely the same time deep cut intervention sets are not economically rational for householders. An alternative narrative has to be developed to address this evident dichotomy.
One possible route forward may be in addressing the problem as one of classic market development and technology diffusion. Subsidies are therefore targeted at key technologies to establish a marketplace with the delivery mechanism, timing and exit strategy of the subsidy being as important as the scale of subsidy. This subsidy should be designed so as to stimulate a nascent innovator and early adopter class so that late market entrants can benefit from the capital reductions that are likely to flow from the development of a mass market. This conclusion is applicable to all domestic sector technological innovations aimed at producing deep cuts in emissions.
22.11 Sources of further information and advice
A number of UK-based research groups are working in the areas covered in this chapter. The RESOLVE project led by Professor Tim Jackson at Surrey University is seeking to provide robust, evidence-based advice to policy-makers in the UK and elsewhere who are seeking to understand and to influence the behaviours and practices of ‘energy consumers’.
The Carbon Vision Buildings programme was a UK-based research project that considered both behavioural and technical aspects of reducing CO2 emissions in the existing building stock. Project websites and information can be found at http://www.epsrc.ac.uk/ResearchFunding/Programmes/Energy/Funding/CarbonVision/BuildingsProjects.htm
22.12 References
Anderson, B.Conventions for U-value Calculations. BRE Scotland, 2006.
Baker, P.In situ u-value measurements in traditional buildings – preliminary results. Historic Scotland: Glasgow Caledonian University, 2008.
Balaras, C.A., EPA-ED, Benchmarking for existing European dwellings. 2003. [April 2003, Task 1].
Belcher, S.E., Hacker, J.N., Powell, D.S. Constructing design weather data for future climates. Building Services Engineering Research and Technology. 2005; 26:49–61.
BERRDigest of UK Energy Statistics. BERR, 2009. [May 2009].
Berry, A., Branston, H., Jackson, T.To pay now, or to pay later – that is the question: an assessment of homeowners’ willingness to pay for energy saving measures. University of Surrey, 2009. [RESOLVE Working Paper].
Bottrill, C. Homes in Historic Conservation Areas in Great Britain: Calculating the Proportion of Residential Dwellings in Conservation Areas, 40% House Background Document K. Environmental Change Institute. 2005, 2005.
BRE. Energy analysis focus report – A study of hard to treat homes using the English house condition survey, Part 1: dwelling and household characteristics of hard to treat homes. BRE Housing; 2008.
CIPFAChartered Institute of Public Finance and Accountancy. London: Planning and Development Statistics, 2001.
DCLG. Planning Policy Guidance 15: Planning and the Historic Environment, 1994. [1994.].
DCLG. Housing Statistics. http://www.communities.gov.uk/publications/corporate/statistics/housingstatistics2008, 2008.
DEFRA. Climate Change Act 2008 – key provisions. http://www.defra.gov.uk/environment/climatechange/uk/legislation/provisions.htm, 2008. [Available from:, (accessed May 2009)].
DEFRA. e-Digest of Statistics. http://www.defra.gov.uk/environment/statistics/globatmos/gakf07.htm, 2009. [(accessed May 2009)].
ESTUK Domestic Solid Wall Insulation, Sector Profile – Executive Summary, 2008. UK: Energy Saving Trust, 2008.
Geller, H., Attali, S.The experience with energy efficiency policies and programmes in IEA countries. International Energy Agency, 2005.
Hammond, G., Jones, C., Inventory of carbon and energy (ICE). University of Bath, 2006. [Version 1.5, Beta, 2006].
He, J., Young, A.N., Pathan, A., Oreszczyn, T. Air Conditioning Energy Use in Houses in Southern England. Dynamic Analysis, Simulation and Testing Applied to the Energy and Environmental Performance of Buildings of Conference, Athens, 2005.
Heimdal, S.I., Bjørnstad, E., A policy model for diffusion of electricity saving technologies, European Council for an Energy Efficient Economy, Summer Study, Cote d’Azur, 2009.
Hinnels, M., Building Market Transformation. Environmental Change Institute, Oxford, 2006. http://www.eci.ox.ac.uk/research/energy/downloads/bmt-july06.pdf
Treasury, H.M. The Green book: appraisal and evaluation in central government. http://www.hm-treasury.gov.uk/media/3/F/green_book_260907.pdf, 2003. [Available from:, (accessed May 2009)].
INCA. Insulated Render and Cladding Association, UK. http://www.inca-ltd.org.uk, 2009. [(accessed May 2009).].
Levine, M., Ürge-Vorsatz, D., Blok, K., Geng, L., Harvey, D., Lang, S., Levermore, G., Mehlwana, A.M., Mirasgedis, S., Novikova, A., Rilling, J., Yoshino, H. Residential and commercial buildings. In: Metz B., Davidson O.R., Bosch P.R., Dave R., Meyer L.A., eds. Climate Change 2007: Mitigation. Contribution of Working Group III to the Fourth Assessment Report of the Intergovernmental Panel on Climate Change. Cambridge: Cambridge University Press, 2007.
Lewis, M. Australian building: a cultural investigation, section 6.3: the cavity wall. www.mileslewis.net, 2009. [(accessed May 2009)].
Lowe, R. private communication, 2006.
Masini, G., Bowles, G., Peacock, A.D., Ahadzi, M. Whole life costing of domestic energy demand reduction technologies and its social implications. In: Construction Management and Economics. Article in press; 2010.
OFGEMCarbon Emissions Reduction Target (CERT) 2008-2011 Technical Guidance Manual. UK: OFGEM, 2008.
OPSI. Town and Country Planning Act, 1990. Section. 69, 1990.
Peacock, A.D., Banfill, P.F., Newborough, M., Kane, D., Turan, S., Jenkins, D., Ahadzi, M., Bowles, G., Eames, P.C., Singh, H., Jackson, T., Berry, A. Reducing CO2 emissions through refurbishment of UK housing. In: European Council for an Energy Efficient Economy (ECEEE) 2007 Summer Study, Côte d’Azur, France, 4–9. 2007. [June 2007].
Peacock, A.D., Jackson, T., Berry, A., Ahadzi, M., Massini, A., Market Development Potential of Residential Refurbishment Packages. European Council for an Energy Efficient Economy (ECEEE) 2009 Summer Study, Côte d’Azur, France, 4-6 June 2009, 2009. [CoJune 2009].
Pett, J. Affordable warmth for hard to treat homes: Finding a way forward?, 2001. [Briefing Paper, ACE, 2001].
Rogers, E.M.Diffusion of Innovations. New York: Free Press, 2003.
Sailor, D.J., Pavlova, A.A. Air conditioning market saturation and long-term response of residential cooling energy demand to climate change. Energy. 2003; 28:941–951.
Shorrock, L.D., Utley, J.I., Domestic energy fact file 2003. BRE, 2003.
SPAB. The society for the protection of ancient buildings (SPAB). the manifesto. http://www.spab.org.uk/html/what-is-spab/the-manifesto/, 2009. [(accessed May 2009)].
Tam, C.Deploying Demand Side Technologies, ETP 2008. Paris: IEA, 2007.
TARBASE. TARBASE Project website. www.tarbase.com, 2009.
UKCIP. UK Climate Impacts Programme. http://www.ukcip.org.uk/, 2009.
UNECE. United Nations Economic Commission for Europe. Bulletin of Housing Statistics for Europe and North America, 2006. 2006.
Ürge-Vorsatz, D., Novikova, A., Sharmina, M., Counting good: quantifying the co-benefits of improved efficiency in buildings, European Council for an Energy Efficient Economy, Summer Study, Côte d’Azur, 2009.
Wilhite, H., Will efficient technologies save the world? A call for new thinking on the ways that end-use technologies affect energy using practices, European Council for an Energy Efficient Economy, Summer Study, Côte d’Azur. 2007.
Wright, A.J., Young, A.N., Natarajan, S. Dwelling temperatures and comfort during the August 2003 heat wave. Building Service Engineering. 2005; 26:285.