2
Let’s Start Drawing
There’s nothing quite like getting your first graphics application running. There’s a real sense of achievement when you see your ideas for the rearrangements of pixels come together on the screen. My first coding language was BASIC on an Amstrad CPC664 and even though the code was quite laborious, I liked nothing better than to draw shapes and change the colors on the screen.
Computer-drawn images ultimately end up as single pixels (such as the ones drawn in the previous section) with differing colors on a graphics display. To draw all objects pixel by pixel whenever you’d like to create an image would be a long, drawn-out process. It might have been how images were rendered on a screen in the 1950s, but now, with advanced technology, Cartesian coordinate systems, and mathematics, we are able to specify drawing primitives and use these over and over to compose a picture.
In this chapter, you will learn about the most primitive of concepts and shapes upon which all graphics are built and discover how to work with them in Python and Pygame. The overall goal will be to provide you with an understanding of, and practical skills in, the application of these concepts, which will form the basis for everything you create moving forward.
In this chapter, you will learn about these fundamental concepts through the exploration of the following:
- Color
- Lines
- Text
- Polygons
- Raster images
Technical requirements
The exercises in this chapter use the same Python and PyCharm software and configurations as were set up in Chapter 1, Hello Graphics Window: You’re On Your Way. Remember to keep the code from each chapter separate. Before you continue reading, be sure to make a new folder to place the code in for this chapter.
The solution files containing the code can be found on GitHub at https://github.com/PacktPublishing/Mathematics-for-Game-Programming-and-Computer-Graphics/tree/main/Chapter02.
Color
Computer graphics, by their very definition, are a visual medium and as such rely on color to be seen. A color space is the range of colors that can be generated from the primary colors of a device. For example, imagine you are creating an oil painting. Say you had a tube of red, a tube of yellow, and a tube of blue, and you mixed them together in every conceivable ratio, then all the resulting colors would be the color space for that set of three tubes. If your friend did the same thing with slightly different reds, yellows, and blues, they would produce another color set unique to them. If you both mixed a green from equal parts of your own blue and yellow, you would get green that was 50% blue and 50% yellow, but because you both started with slightly different versions of blue and yellow, the resulting greens would be different.
The same applies to computer screens, printers, cameras, and anything else with a colored screen or print. The color you consider green on one monitor might look completely different on another and it may look different again when you print it on paper. The range of colors that can be created by mixing paints or seen on a computer screen is called a gamut. Given the previous example with the tubes of paint, we could say that you and your friend are working with different color gamuts.
To help alleviate this problem, there exist numerous standard color spaces and they dictate how a color should appear. The most common one is RGB, whose initials stand for Red, Green, and Blue. All colors displayed on a computer screen can be defined by mixing different amounts of red, green, and blue.
The values of each color are specified in one of two ranges, either 0 to 1 or 0 to 255. For values between 0 and 1, a 0 indicates none of the color and a 1 all the color. Given that the RGB value is specified as a tuple in the form (red, green, blue), (0.5, 0, 1) would denote a color with a half strength of red, no green, and a full strength of blue. In a similar vein, where the color values are specified in the range 0 to 255, the same color would be represented by (128, 0, 255), where you have half the amount of available red mixed with the full amount of blue.
It’s most likely you’ve experienced mixing RGB colors before, as you can set them in many software packages for anything from text to paintbrushes. Figure 2.1 shows the color picking tools in Adobe Photoshop and Microsoft Word and points out where the RGB values are set:

Figure 2.1: Color pickers from popular software: (a) Adobe Photoshop and (b) Microsoft Word
Hint
When setting a color while coding, if you aren’t sure what the RGB values are for the color you want, use a color picker from any software you have available to you. If the coding language you are using takes color values between 0 and 1 instead of between 0 and 255, simply divide the values by 255. For example, a color specified as (100, 50, 90) for color values between 0 and 255 would become (100/255, 50/255, 90/255) = (0.39, 0.20, 0.35).
Let’s do it…
In this exercise, we will investigate the use of color for displaying a rainbow of pixels across the screen:
- Create a new Python file called RBGSpace.py and add the basic starter code created in Chapter 1, Hello Graphics Window: You’re On Your Way, to open a window.
- Pygame takes color values in the range 0 to 255. Although you can’t easily display the blending of three colors in a two-dimensional window, you can still explore the range between two of the color values with a program like this where the code you need to add the basic starter code is displayed in bold:
import pygame
pygame.init()
screen_width = 1000
screen_height = 800
screen = pygame.display.set_mode((screen_width,
screen_height))
done = False
while not done:
for event in pygame.event.get():
if event.type == pygame.QUIT:
done = True
for y in range(800):
for x in range(1000):
screen.set_at((x, y),
pygame.Color(int(x/screen_width * 255),
int(y/screen_height * 255), 255))
pygame.display.update()
pygame.quit()
The color() method takes the red, green, and blue channels respectively as arguments. You will notice that the red and green channel values will vary while the blue channel stays fully turned on with the value 255.
The result shown in Figure 2.2 shows you the range of colors by mixing all the reds with all the greens, while the blue channel is turned on to the maximum:

Figure 2.2: The range of colors available by mixing across the red and green color channels with blue fully on
Your turn…
Exercise A: Draw the range of colors that mix the green and blue channels with no red.
As discussed, graphics would be nothing without color. In the previous exercise, we used it for coloring pixels. However, there are many other graphics constructs that build upon the simple pixel and so let’s now move on to discover another graphics fundamental: lines.
Lines
The drawing of lines holds a very special place in my heart on my computer graphics learning journey. While you were back in school learning about Cartesian coordinates, you most likely also learned how to draw a straight line and that the relationship of the y coordinate to the x coordinate is as follows:

Where m is the gradient (or slope) and c is the y-intercept. The gradient refers to how vertical or horizontal the line appears. A perfectly horizontal line has a gradient of 0, whereas a perfectly vertical line has a gradient of infinity. The y-intercept is the value on the y axis (where x = 0) that the line crosses.
Note
For a refresher on the ways to represent a line mathematically, see https://en.wikipedia.org/wiki/Linear_equation.
Exploring line equations makes more sense when you can see them on the screen and investigate the effect of modifying their variables. Lucky for us, there is freely available software on the web that can help with this.
Let’s do it…
We can visualize this relationship of the variables in a line equation in DESMOS with the following steps:
- Visit https://www.desmos.com/calculator.
- In the equation box shown in Figure 2.3, type y = 2x + 4 to see the same graph of the line plotted:

Figure 2.3: Plotting a straight line from its equation in DESMOS
The value of 2 in the equation is the slope (this is how steep the line is). The smaller the value, the flatter (more horizontal) the line.
- To try making the slope more horizontal, change the value of 2 to 1. A value of 1 gives you a 45-degree line. You can go even lower if you like, with 0.5, or if you use 0, you will get a perfectly horizontal line.
- The value of 4, which is the y-intercept in this case, in Figure 1.14 adjusts where the line crosses the y axis. Change this as you see fit to witness the same changes in the line.
After this short introduction to DESMOS, you’ll now have the skills to use the software for evaluating other equations including lines. This will come in handy as we progress through the book, and you might need to check whether what you are drawing on the screen is correct. For example, if you believe your code should be drawing a horizontal line and it is drawing one at 45 degrees, then you can use tools such as DESMOS to double-check your working out.
Your turn…
Exercise B: Use DESMOS to plot a line with a slope of 8 and a y-intercept of 0.5. Now that you are aware of the basic anatomy of a line, let’s have a look at the way to plot them with Pygame. Unlike DESMOS, which takes the equation of a line, Pygame requires just two points: the starting point and the end point. It takes a lot of the heavy lifting out of drawing a line, as you will discover in the section Line Plotting Pixel by Pixel.
Let’s do it…
You are about to discover just how easy it is to plot a line with Pygame. In this exercise, we will also include mouse clicks to add a dynamic factor to line drawing by allowing a user to select the line endpoints:
- Create a new Python file called PygameLine.py.
- Add the following code, which uses the built -in Pygame line method:
import pygame
from pygame.locals import * #support for getting mouse
#buttons
pygame.init()
screen_width = 1000
screen_height = 800
screen = pygame.display.set_mode((screen_width,
screen_height))
done = False
white = pygame.Color(255, 255, 255)
times_clicked = 0
while not done:
for event in pygame.event.get():
if event.type == pygame.QUIT:
done = True
elif event.type == MOUSEBUTTONDOWN:
if times_clicked == 0:
point1 = pygame.mouse.get_pos()
else:
point2 = pygame.mouse.get_pos()
times_clicked += 1
if times_clicked > 1:
pygame.draw.line(screen, white, point1,
point2, 1)
times_clicked = 0
pygame.display.update()
pygame.quit()
Tool Tip
A # is used in Python to begin a comment.
This code uses a variable called times_clicked to keep track of how many times the mouse button has been clicked. These clicks trigger the MOUSEBUTTONDOWN event. Each time the mouse is depressed, a point is recorded. After two clicks, the two points collected are used as the opposite ends of a line, which in this case is drawn in white with a thickness of 1 as shown in Figure 2.4.
Note
For more information on the pygame.draw library, see the Pygame documentation at https://www.pygame.org/docs/ref/draw.html.
As you’ve discovered, Pygame makes it easy to draw a colored line between two points:

Figure 2.4: A straight line produced by Pygame
It also makes it easy to create more graphical text effects, as you are about to discover.
Text
It’s rare that you will find a graphical user interface without text. In the past, display devices operated in two modes, a text mode, and a graphics mode. If you ever used the original versions of DOS or Unix, you were operating in text mode. This meant there was no way to draw graphics on the screen (other than the characters of the text themselves), so text couldn’t be written on buttons or appear upside-down or sideways and the design of the characters themselves was limited. The fanciest images available on a screen were drawn with text, such as this fish:
| \\__ o
| \_/ o o
> _ (( <_ oo
| / \__+___/
|/ |/
The images, called ASCII art (see www.asciiart.eu for more examples), originated in the 1970s and 1980s on computer bulletin board systems, but their popularity waned as computer displays and graphics cards became more advanced and graphical interfaces were introduced. However, people still use ASCII art in text-based messaging situations such as chat in multiplayer online games, email, and message boards.
Nowadays, text is drawn on the screen, meaning that it is graphics based and as such we have access to a variety of attributes that we can change to define how it looks. Some of these include the typeface, color, size, spacing, and orientation.
The typeface, more commonly referred to as a font, is a specific set of characters that share the same style. Some of the more commonly known ones are Arial, Verdana, and Times New Roman. There are two categories font design falls into: serif and sans serif. A serif is a decorative line that embellishes the font, with small lines on the ends of character strokes, as seen in Figure 2.5:

Figure 2.5: A serif font and sans serif font
For graphical displays, while it’s quite acceptable and possible to use serif fonts, sans-serif fonts are easier to read on computer displays.
The following code demonstrates how to draw text with Pygame (with the result shown in Figure 2.5):
import pygame
pygame.init()
screen_width = 800
screen_height = 200
screen = pygame.display.set_mode((screen_width,
                                  screen_height))
done = False
white = pygame.Color(255, 255, 255)
pygame.font.init()
font = pygame.font.SysFont('Comic Sans MS', 120, False,
                           True)
text = font.render('Penny de Byl', False, white)
while not done:
  for event in pygame.event.get():
    if event.type == pygame.QUIT:
      done = True
  screen.blit(text, (10, 10))
  pygame.display.update()
pygame.quit()
First, pygame.font.init() is used to initialize the use of fonts, which only needs to be called once per program. Next, the typeface is set up; in this case, it is Comic Sans MS.
For a list of all the system fonts printed to the console you can use this:
print(pygame.font.get_fonts())Next, font.render creates a display of text that uses the font. The parameters following the string are a bool for antialiasing and the color. At this point, the text isn’t displayed but only set up.
Inside the while loop, you will find a call to screen.blit. This places the text on the screen at the given (x, y) location.
You might be wondering why text needs a screen.blit when drawing a line doesn’t. The purpose of screen.blit is to draw an existing drawn surface on top of an existing one. You can think of a drawn surface in this case as an image with transparency. The text is drawn into an image called text with the font.render method. So, it’s being held in memory. screen.blit copies text on to the display window pixel by pixel, combining the colors in text with what is already on the screen. We will see further use of screen.blit when we start loading in external images.
The result of our example is shown in Figure 2.6:

Figure 2.6: Pygame being used to draw text
To use a custom font with Pygame, first you need a font definition file. The file format for these is TrueType font and they have a suffix of .ttf. It’s possible to create your own with software, however, for the point of the next exercise, you can download a free one.
Let’s do it…
In this exercise, you will learn how to take a downloaded font and use it with Pygame to display text in the graphics window:
- Visit www.dafont.com, select a font, and download the .ttf file.
- Drag and drop the font file (while holding the Ctrl key) into PyCharm’s project window. The software might ask you to perform a refactor – just say yes.
- Create a new Python file called CustomText.py and start with the final code from the previous exercise.
- Replace the line beginning font = with the following:
font = pygame.font.Font('fonts/Authentic Sheldon.ttf',120)
Here, the string is the name of your font file. Note that it is possible to create a new folder inside the project window and place the font file in there if you’d like to keep things organized. To get the path to the font file, wherever it is located, right-click on the font filename and copy its path from the content root as shown in Figure 2.7:

Figure 2.7: How to get the path and filename of a file in PyCharm
- Now all you have to do is press Play to see the results, as illustrated in Figure 2.8:

Figure 2.8: Using a TrueType font to change the font face with Pygame
Now that you know how, placing text into a window using any font will become common place. In graphics applications, text is most widely used for graphical user interfaces. The next challenge will help reinforce your understanding of font use.
Your turn…
Exercise C: Find another TrueType font file that you like. Use it to display another line of text below the one already coded.
Note
If you are interested in creating your own font from scratch, take a look at the online font editor from fontstruct.com.
As you might imagine, the mathematics involved in drawing a font are quite complex. They can be drawn using a series of curves or, more specifically, Bézier curves, which we will examine in Part Three: Essential Geometry. But for now, we are containing our discussion of graphics elements to those constructed of straight lines, and the polygons we will look at in the next section are a perfect example.
Polygons
A polygon is a flat shape defined by several straight lines connected to enclose an area. The polygon with the least number of sides is a triangle. A generic polygon is called an n-gon where n is the number of sides. A triangle is a 3-gon, whereas squares and rectangles are 4-gons. The side of a polygon is a straight line and is called an edge. The points at which they connect are called vertices.
Polygons are classified according to their shapes, as shown in Figure 2.9:
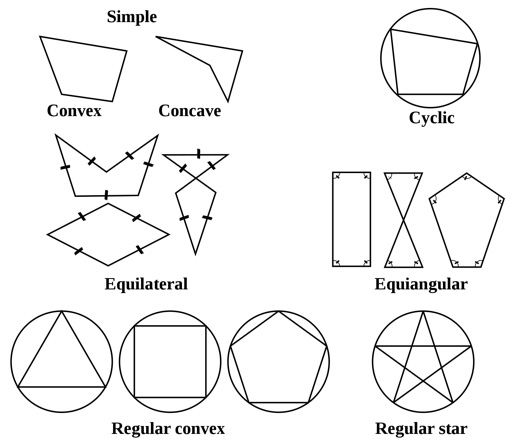
Figure 2.9: Types of polygons (from: https://en.wikipedia.org/wiki/Polygon#/media/File:Polygon_types.svg)
In both 2D and 3D, the majority of objects drawn in graphics are made up of polygons; from the rectangle used to define an onscreen button, to the thousands of triangles used to construct a 3D model. It is therefore important to your knowledge of working in this area to have a strong understanding of what they are, how to construct them, and how to manipulate them.
Here are some interesting and useful facts about polygons:
- A convex polygon has all interior angles add up to less than or equal to 180 degrees, for example, each angle in an equilateral triangle is 60 degrees.
- A regular convex polygon has edges that all have the same length and fits neatly inside a circle.
- The sum of the interior angles of a simple n-gon is (n-2) x 180 degrees.
- The sum of the exterior angles of a simple n-gon is always 360 degrees.
For more useful facts, check out the Wikipedia entry at en.wikipedia.org/wiki/Polygon. We will be examining polygons and their geometry quite a bit throughout the book as we begin developing game and graphics scenarios, however, we will have a quick look at how they are dealt with in Pygame.
Let’s do it…
The only difference between drawing a line and a polygon with Pygame is the addition of more than two points that define the corners of the shape. Try this out now:
- Create a new Python file called Polygons.py and add in the usual starter code for drawing a window.
- Before the while loop, define a variable for the color white like this:
white = pygame.Color(255, 255, 255)
- Inside the while loop, immediately above the update() method definition, start typing pygame.draw. The context sensitive help in PyCharm will reveal the types of things you can draw; in the list, you will see polygon.
- Now complete the line with the following:
pygame.draw.polygon(screen, white, ((150,200),
(600,400),(400,600)))
Here, take special note of where all the brackets are positioned. Each x, and y coordinate is encased in brackets and then all three coordinates are also inside brackets. This is essential to pass the three coordinates to the polygon() method.
- Run the program. You will see a triangle like the one in Figure 2.10:

Figure 2.10: A drawing of a polygon with the vertex coordinates marked
The required parameters for the shape are the surface the polygon is being drawn on, the color of the polygon, and finally, a list of the vertices.
Your turn…
Exercise D: Instead of hardcoding the vertices of the polygon into the program, create a program that uses mouse clicks (like you did for drawing a line) to define the three points of a triangle.
Whether it is lines or polygons, all drawn items end up on the screen as pixels. In the case of these items, they have a mathematical structure that determines how the pixels are colored. The next element of a graphics image is already represented by pixels. Raster images are particularly useful for times that mathematics won’t suffice. For example, using real photographs, placing textures onto 3D objects, and representing background images.
Raster Images
The last of the graphics elements we are going to examine in this chapter are raster images. These are the regular types of images used with computers such as those produced by displaying PNG or JPG files. They are presented as a grid of pixels where each pixel can be seen when the image is zoomed in, as illustrated in Figure 2.11:

Figure 2.11: A raster image of Smudge and a closeup of the corner of his eye showing individual pixels
If an image has a high resolution, you won’t be able to make out each pixel.
As mentioned in our discussion of creating text, in Pygame, images can be drawn onto surfaces that don’t appear on the main display until required. This also goes for raster images.
First, they are loaded into memory and then you can put them onto the display over and over again at different locations using screen.blit. The image you choose can include transparency. This is a nice feature as it allows you to draw a sprite over the top of an existing background.
Blitting is a common technique used in graphics along with Boolean operations to place one image on top of another by comparing pixel values. For a thorough explanation, I would encourage you to read en.wikipedia.org/wiki/Bit_blit. In the following exercise, we will employ the blit operation to place a background image in a window and overlay a sprite.
Let’s do it…
In this exercise, we will work with a background image for the entire window, as well as one for a sprite. To do this, follow these steps:
- Create a new Python file called ShowRaster.py and add the usual starting code.
- Browse the web for a background image to fill the entire window. Whatever the size of the image you select, you can adjust the size of the window so it’s a neat fit.
- Drag and drop that image file into PyCharm in the same manner that you did for the font (i.e., hold down the Ctrl key to ensure it is copied across). If you like, you can also create a separate folder called images to place image files within.
- Now modify your code to include the script to load and display the image like this:
import pygame
pygame.init()
screen_width = 800
screen_height = 400
screen = pygame.display.set_mode((screen_width,
screen_height))
#Add a title to the display window
pygame.display.set_caption('A Beautiful Sunset')done = False
#load background image
background =
pygame.image.load('images/background.png')while not done:
for event in pygame.event.get():
if event.type == pygame.QUIT:
done = True
screen.blit(background, (0, 0))
pygame.display.update()
pygame.quit()
To begin, I have made the window the same size as the image I chose, which is 800 x 400. Next, I’ve included the set_caption method to show you how to change the title of the window. The image itself is loaded into the display called background with the pygame.image.load method. Note, this method takes a string as the path to the image.
You can find this path using the same method we employed for the TrueType text file. The loading of the image happens outside the while loop as it only needs to occur once. The background image is then blitted onto the screen with its upper left-hand corner aligned at (0, 0). Figure 2.12 (a) illustrates an image used as the background of a window:

Figure 2.12: The background image (a) and with a sprite (b)
- We are now going to blit another image with a transparent part over the top of the background. For this, you will require a PNG image like something that you might use as a 2D game character. You can find such an image at www.iconarchive.com. Download one you like the look of at a resolution of 64 x 64 and import it into PyCharm.
- The process to add the PNG file to the window is the same as for adding the background. First, the image is placed into a variable outside of the while loop and then the image is blitted onto the surface. Placing the code for the new image after the background image will ensure the second image is on top, as you can see in Figure 2.12 (b). The partial listing of this code showing the line additions in bold is as follows:
background =
pygame.image.load('images/background.png')sprite =
pygame.image.load('images/Bird-blue-icon.png')while not done:
for event in pygame.event.get():
if event.type == pygame.QUIT:
done = True
screen.blit(background, (0, 0))
screen.blit(sprite, (100, 100))
pygame.display.update()
pygame.quit()
The load() method puts the sprite into memory where the sprite name is an actual display. It just hasn’t been drawn in the window. That’s the job of the following blit() method.
Despite all the clever mathematics that computer scientists have devised throughout the years, often the image quality and complexity is just sometimes better and easier represented as a raster image. There are many algorithms out there and some that we will explore in this book that can be used to procedurally generate pretty convincing images. But sometimes, they aren’t necessarily a good substitute for the real thing.
Summary
We’ve now covered the fundamental aspects of computer graphics. With all these elements, anything can be drawn on the screen. Although the examples we have worked with have been exclusively 2D, the very same principles are used throughout 3D, as you will discover while working through this book. You now have enough knowledge to construct your own simple 2D graphics projects that integrate external images and fonts and make use of mouse interactions.
In Chapter 3, Line Plotting Pixel by Pixel, we will take a look behind the scenes of the higher-level drawing methods that have been examined in this chapter, with a step-by-step look at an algorithm that has been used since the birth of computer graphics to process how individual pixels should be colored when drawing a line.
Answers
Exercise A:
screen.set_at((x, y), pygame.Color(0, int(x/1000 * 255),
                   int(y/800 * 255)))
Exercise B:
y = 8x + 0.5Exercise C:
For another line of text with a different font, you will need to declare two fonts and two texts like this:
font1 = pygame.font.Font('fonts/Authentic Sheldon.ttf', 120)
font2 = pygame.font.Font('fonts/PinkChicken-Regular.ttf', 120)
text1 = font1.render('Penny de Byl', False, white)
text2 = font2.render('Another line of text', False, white)
Then, inside the while loop, blit both:
screen.blit(text1, (10, 10))
screen.blit(text2, (10, 100))
Exercise D:
import pygame
from pygame.locals import *
pygame.init()
screen_width = 800
screen_height = 800
screen = pygame.display.set_mode((screen_width, screen_height))
pygame.display.set_caption('Triangle Clicker')
done = False
white = pygame.Color(255, 255, 255)
timesClicked = 0
pygame.font.init()
while not done:
  for event in pygame.event.get():
    if event.type == pygame.QUIT:
      done = True
    elif event.type == MOUSEBUTTONDOWN:
      if timesClicked == 0:
        point1 = pygame.mouse.get_pos()
      elif timesClicked == 1:
        point2 = pygame.mouse.get_pos()
      else:
        point3 = pygame.mouse.get_pos()
      timesClicked += 1
      if timesClicked > 2:
        pygame.draw.polygon(screen, white,
                  (point1, point2, point3))
        timesClicked = 0
  pygame.display.update()
pygame.quit()