
14
Understanding Distributed Tracing
In this chapter, we will learn how to use distributed tracing to better understand how our microservices cooperate, for example, in fulfilling a request sent to the external API. Being able to utilize distributed tracing is essential for being able to manage a system landscape of cooperating microservices. As already described in Chapter 8, Introduction to Spring Cloud, Spring Cloud Sleuth will be used to collect trace information, and Zipkin will be used for the storage and visualization of said trace information.
In this chapter, we will learn about the following topics:
- Introducing distributed tracing with Spring Cloud Sleuth and Zipkin.
- How to add distributed tracing to the source code.
- How to perform distributed tracing, visualizing both successful and unsuccessful API requests. We will see how both synchronous and asynchronous processing can be visualized.
- How to use either RabbitMQ or Kafka to send trace events from our microservices to the Zipkin server.
Technical requirements
For instructions on how to install the tools used in this book and how to access the source code for this book, see:
- Chapter 21 for macOS
- Chapter 22 for Windows
The code examples in this chapter all come from the source code in $BOOK_HOME/Chapter14.
If you want to view the changes applied to the source code in this chapter, that is, see what it took to add distributed tracing using Spring Cloud Sleuth and Zipkin, you can compare it with the source code for Chapter 13, Improving Resilience Using Resilience4j. You can use your favorite diff tool and compare the two folders, $BOOK_HOME/Chapter13 and $BOOK_HOME/Chapter14.
Introducing distributed tracing with Spring Cloud Sleuth and Zipkin
To recapitulate Chapter 8, Introduction to Spring Cloud, in reference to the Using Spring Cloud Sleuth and Zipkin for distributed tracing section, the tracing information from a complete workflow is called a trace or a trace tree, and sub-parts of the tree, for example, the basic units of work, are called spans. Spans can consist of sub-spans forming the trace tree. The Zipkin UI can visualize a trace tree and its spans as follows:

Figure 14.1: Example of a trace with its spans
Spring Cloud Sleuth can send trace information to Zipkin either synchronously over HTTP, or asynchronously using a message broker such as RabbitMQ or Kafka. To avoid creating runtime dependencies on the Zipkin server from the microservices, it is preferable to send trace information to Zipkin asynchronously using either RabbitMQ or Kafka. This is illustrated in the following diagram:
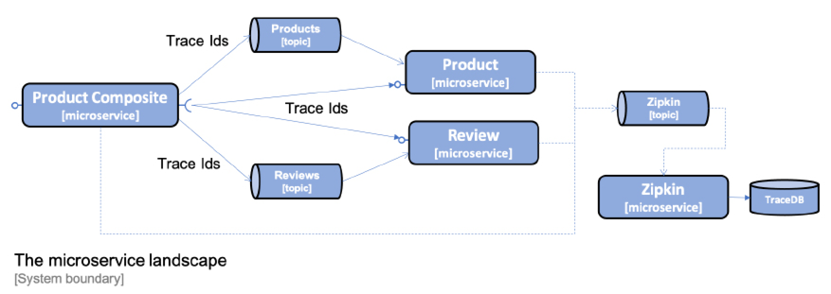
Figure 14.2: Sending trace information to Zipkin using a message broker
Zipkin comes with native support for storing trace information either in memory, or in a database such as Apache Cassandra, Elasticsearch, or MySQL. Added to this, a number of extensions are available. For details, refer to https://zipkin.io/pages/extensions_choices.html. In this chapter, we will store the trace information in memory.
With Zipkin introduced and placed in the system landscape, let's see what changes are required in the source code to enable distributed tracing.
Adding distributed tracing to the source code
In this section, we will learn how to update the source code to enable distributed tracing using Spring Cloud Sleuth and Zipkin. This can be done with the following steps:
- Add dependencies to the build files to bring in Spring Cloud Sleuth and the capability of sending trace information to Zipkin
- Add dependencies on RabbitMQ and Kafka for the projects that haven't used them before, that is, the Spring Cloud projects
authorization-server,eureka-server, andgateway - Configure the microservices to send trace information to Zipkin using either RabbitMQ or Kafka
- Add a Zipkin server to the Docker Compose files
- Add the
kafkaSpring profile indocker-compose-kafka.ymlto the Spring Cloud projectsauthorization-server,eureka-server, andgateway
To run the Zipkin server as a Docker container, we will use a Docker image published by the Zipkin project. Refer to https://hub.docker.com/r/openzipkin/zipkin for details.
Adding dependencies to build files
To be able to utilize Spring Cloud Sleuth and the ability to send trace information to Zipkin, we need to add a couple of dependencies to the Gradle project build files, build.gradle.
This is accomplished by adding the following two lines:
implementation 'org.springframework.cloud:spring-cloud-starter-sleuth'
implementation 'org.springframework.cloud:spring-cloud-sleuth-zipkin'
For the Gradle projects that haven't used RabbitMQ and Kafka before, that is, the Spring Cloud projects authorization-server, eureka-server, and gateway, the following dependencies have also been added:
implementation 'org.springframework.cloud:spring-cloud-starter-stream-rabbit'
implementation 'org.springframework.cloud:spring-cloud-starter-stream-kafka'
Adding configuration for Spring Cloud Sleuth and Zipkin
Configuration for using Spring Cloud Sleuth and Zipkin is added to the common configuration file, config-repo/application.yml. In the default profile, it is specified that trace information will be sent to Zipkin using RabbitMQ:
spring.zipkin.sender.type: rabbit
By default, Spring Cloud Sleuth only sends 10% of the traces to Zipkin. To ensure that all traces are sent to Zipkin, the following property is added in the default profile:
spring.sleuth.sampler.probability: 1.0
When sending traces to Zipkin using Kafka, the Spring profile kafka will be used. In the kafka profile, we override the setting in the default profile so that trace information is sent to Zipkin using Kafka:
---
spring.config.activate.on-profile: kafka

spring.zipkin.sender.type: kafka
Finally, the Gateway service needs a parameter in the configuration file config-repo/gateway.yml to enable Sleuth to track trace IDs correctly:
spring.sleuth.reactor.instrumentation-type: decorate-on-last
For details, see: https://docs.spring.io/spring-cloud-sleuth/docs/3.0.1/reference/html/integrations.html#sleuth-reactor-integration.
Adding Zipkin to the Docker Compose files
As we mentioned previously, the Zipkin server is added to the Docker Compose files using an already existing Docker image, openzipkin/zipkin, published by the Zipkin project. In docker-compose.yml and docker-compose-partitions.yml, where RabbitMQ is used, the definition of the Zipkin server appears as follows:
  zipkin:
    image: openzipkin/zipkin:2.23.2
    mem_limit: 1024m
    environment:
      - RABBIT_ADDRESSES=rabbitmq
      - STORAGE_TYPE=mem
    ports:
      - 9411:9411
    depends_on:
      rabbitmq:
        condition: service_healthy
Let's explain the preceding source code:
- The version of the Docker image,
openzipkin/zipkin, is specified to be version2.23.2. - The
RABBIT_ADDRESSES=rabbitmqenvironment variable is used to specify that Zipkin will receive trace information using RabbitMQ and that Zipkin will connect to RabbitMQ using the hostnamerabbitmq. - The
STORAGE_TYPE=memenvironment variable is used to specify that Zipkin will keep all trace information in memory. - The memory limit for Zipkin is increased to 1,024 MB, compared to 512 MB for all other containers. The reason for this is that since Zipkin is configured to keep all trace information in memory, it will consume more memory than the other containers after a while.
- Zipkin exposes the HTTP port
9411for web browsers to access its web user interface. - Docker will wait to start up the Zipkin server until the RabbitMQ service reports being healthy to Docker.
While it is OK to store the trace information in Zipkin in memory for development and test activities, Zipkin should be configured to store trace information in a database such as Apache Cassandra, Elasticsearch, or MySQL in a production environment.
In docker-compose-kafka.yml, where Kafka is used, the definition of the Zipkin server appears as follows:
  zipkin:
    image: openzipkin/zipkin:2.23.2
    mem_limit: 1024m
    environment:
      - STORAGE_TYPE=mem
      - KAFKA_BOOTSTRAP_SERVERS=kafka:9092
    ports:
      - 9411:9411
    depends_on:
      - kafka
Let's explain the preceding source code in detail:
- The configuration for using Zipkin together with Kafka is similar to the configuration we just saw for using Zipkin with RabbitMQ.
- The main difference is the use of the
KAFKA_BOOTSTRAP_SERVERS=kafka:9092environment variable, which is used to specify that Zipkin will use Kafka to receive trace information and that Zipkin will connect to Kafka using the hostnamekafkaand the port9092. - Docker will wait to start up the Zipkin server until the Kafka service has been started.
In docker-compose-kafka.yml, the kafka Spring profile is added to the Spring Cloud services eureka, gateway, and auth-server:
    environment:
      - SPRING_PROFILES_ACTIVE=docker,kafka
That's what it takes to add distributed tracing using Spring Cloud Sleuth and Zipkin, so let's try it out in the next section!
Trying out distributed tracing
With the necessary changes to the source code in place, we can try out distributed tracing. We will do this by performing the following steps:
- Build, start, and verify the system landscape with RabbitMQ as the queue manager.
- Send a successful API request and see what trace information we can find in Zipkin related to this API request.
- Send an unsuccessful API request and see what error information we can find.
- Send a successful API request that triggers asynchronous processing and see how its trace information is represented.
- Investigate how we can monitor trace information that's passed to Zipkin in RabbitMQ.
- Switch the queue manager to Kafka and repeat the preceding steps.
We will discuss these steps in detail in the upcoming sections.
Starting up the system landscape with RabbitMQ as the queue manager
Let's start up the system landscape. Build the Docker images with the following commands:
cd $BOOK_HOME/Chapter14
./gradlew build && docker-compose build
Start the system landscape in Docker and run the usual tests with the following command:
./test-em-all.bash start
Before we can call the API, we need an access token. Run the following commands to acquire an access token:
unset ACCESS_TOKEN
ACCESS_TOKEN=$(curl -k https://writer:secret@localhost:8443/oauth2/token -d grant_type=client_credentials -s | jq -r .access_token)
echo $ACCESS_TOKEN
As noticed in previous chapters, an access token issued by the authorization server is valid for one hour. So, if you start to get 401 Unauthorized errors after a while, it is probably time to acquire a new access token.
Sending a successful API request
Now, we are ready to send a normal request to the API. Run the following command:
curl -H "Authorization: Bearer $ACCESS_TOKEN" -k https://localhost:8443/product-composite/1 -w "%{http_code}
" -o /dev/null -s
Expect the command to return the HTTP status code for success, 200.
We can now launch the Zipkin UI to look into what trace information has been sent to Zipkin:
- Open the following URL in your web browser:
http://localhost:9411/zipkin/. - To find the trace information for our request, we can search for traces that have passed through the
gatewayservice. Perform the following steps:- Click on the large plus sign (white + sign on red background) and select serviceName and then gateway.
- Click on the RUN QUERY button.
- Click on the Start Time header to see the results ordered by latest first (a down arrow should be visible to the left of the Start Time header).
The response from finding traces should look like the following screenshot:
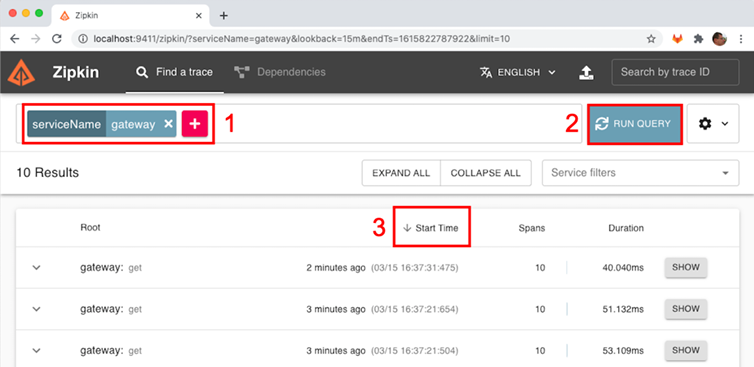
Figure 14.3: Searching for distributed traces using Zipkin
- The trace information from our preceding API request is the first one in the list. Click on its SHOW button to see details pertaining to the trace:
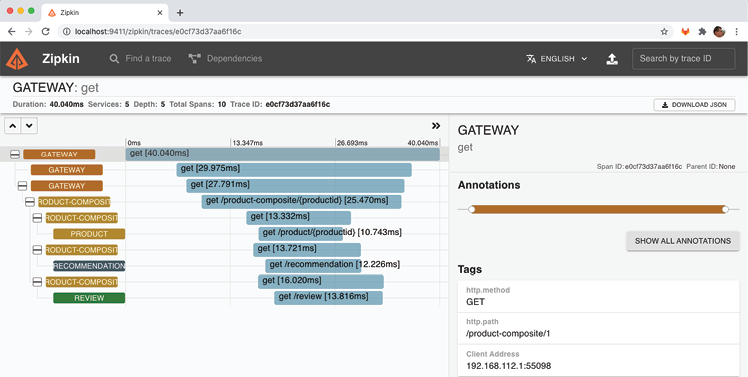
Figure 14.4: Sample distributed trace visualized in Zipkin
In the detailed trace information view, we can observe the following:
- The request was received by the
gatewayservice. - The
gatewayservice delegated the processing of the request to theproduct-compositeservice. - The
product-compositeservice, in turn, sent three parallel requests to the core services:product,recommendation, andreview. - Once the
product-compositeservice received the response from all three core services, it created a composite response and sent it back to the caller through thegatewayservice. - In the details view to the right, we can see the HTTP path of the actual request we sent: /product-composite/1.
- The request was received by the
Sending an unsuccessful API request
Let's see what the trace information looks like if we make an unsuccessful API request; for example, searching for a product that does not exist:
- Send an API request for product ID
12345and verify that it returns the HTTP status code forNot Found, 404:curl -H "Authorization: Bearer $ACCESS_TOKEN" -k https://localhost:8443/product-composite/12345 -w "%{http_code} " -o /dev/null -s - In the Zipkin UI, go back to the search page (use the back button in the web browser) and click on the RUN QUERY button again. To see the results ordered by latest first, click on the Start Time header. Expect a result similar to the following screenshot:
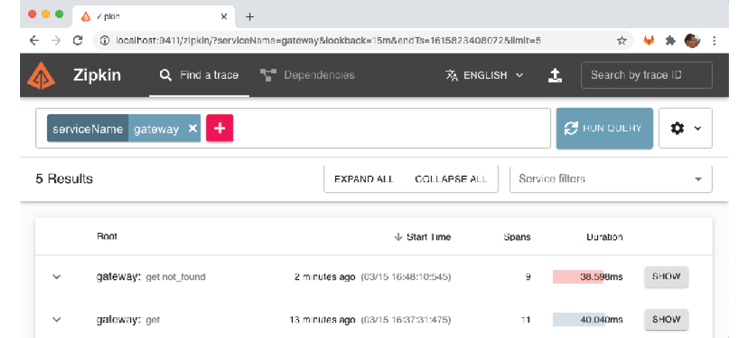
Figure 14.5: Finding a failed request using Zipkin
- You should see the failed request at the top of the returned list. Note that its duration bar is red, indicating that an error has occurred. Click on its SHOW button to see details:

Figure 14.6: Viewing a trace of a failed request using Zipkin
Here, we can see the request path that caused the error, /product-composite/12345, as well as the error code: 404 (Not Found). The color coding in red indicates that it is the request to the product service that caused the error. This is very useful information when analyzing the root cause of a failure!
Sending an API request that triggers asynchronous processing
The third type of request that is interesting to see represented in the Zipkin UI is a request where parts of its processing are done asynchronously. Let's try a delete request, where the delete process in the core services is done asynchronously. The product-composite service sends a delete event to each of the three core services over the message broker and each core service picks up the delete event and processes it asynchronously. Thanks to Spring Cloud Sleuth, trace information is added to the events that are sent to the message broker, resulting in a coherent view of the total processing of the delete request.
Run the following command to delete the product with a product ID of 12345 and verify that it returns the HTTP status code for success, 200:
curl -X DELETE -H "Authorization: Bearer $ACCESS_TOKEN" -k https://localhost:8443/product-composite/12345 -w "%{http_code}
" -o /dev/null -s
Remember that the delete operation is idempotent, that is, it will succeed even if the product doesn't exist!
In the Zipkin UI, go back to the search page (use the back button in the web browser) and click on the RUN QUERY button again. To see the results ordered by latest first, click on the Start Time header. Expect a result similar to the following screenshot:

Figure 14.7: Finding a delete request using Zipkin
You should see the delete request at the top of the returned list. Note that the root service name, gateway, is suffixed by the HTTP method used, delete. Click on its SHOW button to see details:

Figure 14.8: Viewing a delete request using Zipkin
Here, we can see the trace information for processing the delete request:
- The request was received by the
gatewayservice. - The
gatewayservice delegated the processing of the request to theproduct-compositeservice. - The
product-compositeservice, in turn, published three events on the message broker (RabbitMQ, in this case). - The
product-compositeservice is now done and returns a success HTTP status code,200, through thegatewayservice back to the caller. - The core services (
product,recommendation, andreview) receive the delete events and start to process them asynchronously, that is, independently of one another.
To confirm the involvement of the message broker, click on the first product span:

Figure 14.9: Viewing information about the asynchronous processing of an event using Zipkin
The selected span has a rather unhelpful name, unknown. But in the Tags section of the selected span, to the right, we can see information that is more interesting. Here, we can see that the product service was triggered by a message delivered on its input channel, products. We can also see the name of the message broker, broker, in the field Broker Address.
The Zipkin UI contains much more functionality for finding traces of interest!
To get more accustomed to the Zipkin UI, try out the query functionality by clicking on the plus sign and selecting tagQuery. For example, to find requests that failed on a 404 - not found error, set its value to tagQuery=error and http.status_code=404, searching for traces that failed on a Not Found (404) error. Also, try setting limits for lookback range (start and end time) and the maximum number of hits by clicking on the gear icon to the right of the RUN QUERY button.
Monitoring trace information passed to Zipkin in RabbitMQ
To monitor trace information sent to Zipkin over RabbitMQ, we can use the RabbitMQ management Web UI. Trace messages are sent to Zipkin using a queue named zipkin. To monitor messages sent through this queue, open the following URL in your web browser: http://localhost:15672/#/queues/%2F/zipkin. If required, log in using the username "guest" and the password "guest". Expect a web page that looks like the following:

Figure 14.10: Trace records sent through RabbitMQ
In the graph named Message rates, we can see that trace messages are sent to Zipkin, currently at an average rate of 1 message per second.
Wrap up the tests of distributed tracing using RabbitMQ by bringing down the system landscape. Run the following command:
docker-compose down
Using Kafka as a message broker
Let's also verify that we can send trace information to Zipkin using Kafka instead of RabbitMQ!
Start up the system landscape using the following commands:
export COMPOSE_FILE=docker-compose-kafka.yml
./test-em-all.bash start
Repeat the commands we performed in the previous sections, where we used RabbitMQ, and verify that you can see the same trace information in the Zipkin UI when using Kafka.
Kafka doesn't come with a management web UI like RabbitMQ. Therefore, we need to run a few Kafka commands to be able to verify that the trace events were passed to the Zipkin server using Kafka:
For a recap on how to run Kafka commands when running Kafka as a Docker container, refer to the Using Kafka with two partitions per topic section in Chapter 7, Developing Reactive Microservices.
- First, list the available topics in Kafka:
docker-compose exec kafka /opt/kafka/bin/kafka-topics.sh --zookeeper zookeeper --listExpect to find a topic named
zipkin:
Figure 14.11: Finding the Zipkin topic in Kafka
- Next, ask for trace events that were sent to the
zipkintopic:docker-compose exec kafka /opt/kafka/bin/kafka-console-consumer.sh --bootstrap-server localhost:9092 --topic zipkin --from-beginning --timeout-ms 1000Expect a lot of events similar to the following:

Figure 14.12: Viewing a lot of trace events in the Zipkin topic in Kafka
The details of a trace event are not important. The Zipkin server sorts that out for us and makes the information presentable in the Zipkin UI. The important point here is that we can see that the trace events actually were sent to the Zipkin server using Kafka.
Now, bring down the system landscape and unset the COMPOSE_FILE environment variable:
docker-compose down
unset COMPOSE_FILE
That concludes this chapter on distributed tracing!
Summary
In this chapter, we have learned how to use distributed tracing to understand how our microservices cooperate. We have learned how to use Spring Cloud Sleuth to collect trace information, and Zipkin to store and visualize the trace information.
To promote the decoupling of runtime components, we have learned how to configure microservices to send trace information to the Zipkin server asynchronously while using RabbitMQ and Kafka as message brokers. We have seen how adding Spring Cloud Sleuth to microservices is effected by adding a couple of dependencies to the build files and setting up a few configuration parameters. We have also seen how the Zipkin UI makes it very easy to identify which part of a complex workflow caused either an unexpectedly long response time or an error. Both synchronous and asynchronous workflows can be visualized with the Zipkin UI.
In the next chapter, we will learn about container orchestrators, specifically Kubernetes. We will learn how to use Kubernetes to deploy and manage microservices, while also improving important runtime characteristics such as scalability, high availability, and resilience.
Questions
- What configuration parameter is used to control how trace information is sent to Zipkin?
- What is the purpose of the
spring.sleuth.sampler.probabilityconfiguration parameter? - How can you identify the longest-running request after executing the
test-em-all.bashtest script? - How can we find requests that have been interrupted by the timeout introduced in Chapter 13, Improving Resilience Using Resilience4j?
- What does the trace look like for an API request when the circuit breaker introduced in Chapter 13, Improving Resilience Using Resilience4j, is open?
- How can we locate APIs that failed on the caller not being authorized to perform the request?