
18
Using a Service Mesh to Improve Observability and Management
In this chapter, you will be introduced to the concept of a service mesh and see how its capabilities can be used to handle challenges in a system landscape of microservices, in areas including security, policy enforcement, resilience, and traffic management. A service mesh can also be used to provide observability, the capability to visualize how traffic flows between microservices.
A service mesh overlaps partly with the capabilities of Spring Cloud and Kubernetes that we learned about earlier in this book. But most of the functionality in a service mesh complements Spring Cloud and Kubernetes, as we will see in this chapter.
The following topics will be covered in this chapter:
- An introduction to the service mesh concept and Istio, a popular open source implementation
- Deploying Istio in Kubernetes
- Creating, observing, and securing a service mesh
- Ensuring that a service mesh is resilient
- Performing zero-downtime updates
- Testing the microservice landscape using Docker Compose to ensure that the source code in the microservices is not locked into either Kubernetes or Istio
Technical requirements
For instructions on how to install tools used in this book and how to access the source code for this book, see:
- Chapter 21 for macOS
- Chapter 22 for Windows
The code examples in this chapter all come from the source code in $BOOK_HOME/Chapter18.
If you want to view the changes applied to the source code in this chapter, that is, see what it took to create a service mesh using Istio, you can compare it with the source code for Chapter 17, Implementing Kubernetes Features to Simplify the System Landscape. You can use your favorite diff tool and compare the two folders, $BOOK_HOME/Chapter17 and $BOOK_HOME/Chapter18.
Introducing service meshes using Istio
A service mesh is an infrastructure layer that controls and observes the communication between services, for example, microservices. The capabilities in a service mesh, for example, observability, security, policy enforcement, resilience, and traffic management, are implemented by controlling and monitoring all internal communication inside the service mesh, that is, between the microservices in the service mesh.
One of the core components in a service mesh is a lightweight proxy component that is injected into each microservice that will be part of the service mesh. All traffic in and out of a microservice is configured to go through its proxy component. The proxy components are configured at runtime by a control plane in the service mesh, using APIs exposed by the proxy. The control plane also collects telemetry data through these APIs from the proxies to visualize how the traffic flows in the service mesh.
A service mesh also contains a data plane, consisting of the proxy components together with separate components for handling external traffic to and from the service mesh, known as an ingress gateway and an egress gateway. The gateway components also communicate with the control plane using a proxy component. This is illustrated by the following diagram:

Figure 18.1: Service mesh with a control plane and a data plane
The first publicly available implementation of a service mesh was the open source project Linkerd, managed by Buoyant (https://linkerd.io), having its origins in Twitter's Finagle project (http://twitter.github.io/finagle). It was launched in 2016 and, one year later, in 2017, IBM, Google, and Lyft launched the open source project Istio (https://istio.io). Since then, several service mesh projects have been launched. For an overview of available implementations, see the service mesh category in CNCF's cloud-native landscape map: https://landscape.cncf.io/card-mode?category=service-mesh&grouping=category. In this book, we will use Istio.
Introducing Istio
Istio can be deployed on a number of Kubernetes distributions and platforms using various installation tools as described in https://istio.io/docs/setup. We will use Istio's CLI tool, istioctl, to install Istio in our Minikube-based, single-node Kubernetes cluster.
Istio is, as explained previously, divided into a control plane and a data plane. As an operator, we will define the desired state by creating Istio objects in the Kubernetes API server, for example, declaring routing rules. The control plane will read these objects and send commands to the proxies in the data plane to take actions according to the desired state, for example, configuring routing rules. The proxies handle the actual communication between the microservices and report back telemetry data to the control plane. The telemetry data is used in the control plane to visualize what's going on in the service mesh.
When deploying Istio on Kubernetes, most of its runtime components are deployed in a separate Kubernetes Namespace, istio-system. For the configuration we will use in this book, we will find the following Deployments in this Namespace:
istiod, Istio's daemon that runs the whole control plane.Fun fact: Up until Istio v1.4, the control plane was divided into a set of cooperating microservices. Starting with v1.5, they were consolidated into a single binary run by
istiod, simplifying installation and configuration of the control plane at runtime. Also, runtime characteristics such as startup time, resource usage, and responsiveness improved. This evolution of Istio's control plane is, to me, an interesting lesson learned when it comes to the use of fine-grained microservices.istio-ingressgatewayandistio-egressgateway, Istio's ingress and egress gateway components, are part of the data plane.- A number of integrations with other popular open source projects are supported by Istio to bring in extra functionality to the control plane. In this book, we will integrate the following components:
- Kiali: Provides observability to the service mesh, visualizing what is going on in the mesh. For more information, see https://www.kiali.io.
- Tracing: Handles and visualizes distributed tracing information, based on either Jaeger or Zipkin. We will use Jaeger. For more information, see https://www.jaegertracing.io.
- Prometheus: Performs data ingestion and storage for time series-based data, for example, performance metrics. For more information, see https://prometheus.io.
- Grafana: Visualizes performance metrics and other time series-related data collected by Prometheus. For more information, see https://grafana.com.
In Chapter 20, Monitoring Microservices, we will explore performance monitoring capabilities using Prometheus and Grafana.
- For more information on available integration in Istio, see https://istio.io/latest/docs/ops/integrations/.
The only Istio components that are deployed outside of the istio-system Namespace are the proxy components, which are injected into the microservices that are part of the service mesh. The proxy component is based on Lyft's Envoy proxy (https://www.envoyproxy.io).
The runtime components in Istio's control plane and data plane are summarized in the following diagram:
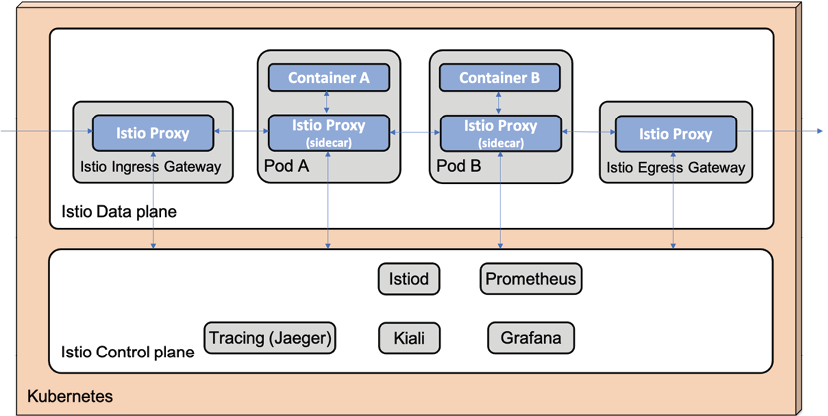
Figure 18.2: Istio runtime components
Now that we've had an introduction, we will look into how these proxy objects can be injected into the microservices.
Injecting Istio proxies into microservices
The microservices we have deployed in Kubernetes in the previous chapters run as a single container in a Kubernetes Pod (refer to the Introducing Kubernetes API objects section in Chapter 15, Introduction to Kubernetes, for a recap). To make a microservice join an Istio-based service mesh, an Istio proxy is injected into each microservice. This is done by adding an extra container to the Pod that runs the Istio proxy.
A container added to a Pod with the aim of supporting the main container, such as an Istio proxy, is referred to as a sidecar.
The following diagram shows how an Istio proxy has been injected into a sample Pod, Pod A, as a sidecar:

Figure 18.3: Istio proxy injected into Pod A
The main container in the Pod, Container A, is configured to route all its traffic through the Istio proxy.
Istio proxies can be injected either automatically when a Pod object is created or manually using the istioctl tool. To tell Istio to automatically inject an Istio proxy into new Pods in a Namespace, the Namespace can be labeled with istio-injection: enabled. If some Pods in the Namespace are to be excluded from the auto-injection, they can be annotated with sidecar.istio.io/inject: "false".
To inject an Istio proxy manually into the Pods of an existing Deployment object, the following command can be used:
kubectl get deployment sample-deployment -o yaml | istioctl kube-inject -f - | kubectl apply -f -
This command may, at first glance, appear somewhat daunting, but it is actually just three separate commands. The previous command sends its output to the next command using pipes, that is, the | character. Let's go through each command:
- The
kubectl get deploymentcommand gets the current definition of a Deployment namedsample-deploymentfrom the Kubernetes API server and returns its definition in the YAML format. - The
istioctl kube-injectcommand reads the definition from thekubectl get deploymentcommand and adds an extra container for an Istio proxy in Pods that the Deployment handles. The configuration for the existing container in the Deployment object is updated so that incoming and outgoing traffic goes through the Istio proxy.The
istioctlcommand returns the new definition of the Deployment object, including a container for the Istio proxy. - The
kubectl applycommand reads the updated configuration from theistioctl kube-injectcommand and applies the updated configuration. An upgrade of the Pods belonging to the Deployment will start up in the same way as we have seen before (refer to the Trying out a sample deployment section in Chapter 15, Introduction to Kubernetes).
In this book, we will inject the Istio proxies automatically by applying the following definition of the hands-on Namespace:
apiVersion: v1
kind: Namespace
metadata:
  name: hands-on
  labels:
    istio-injection: enabled
From the preceding definition, we can see how the Namespace is given the label istio-injection with the value enabled.
At the time of writing, Istio is not fully capable of acting as a proxy for MySQL, MongoDB, and RabbitMQ, so they will be excluded from the service mesh by adding the following annotation to their Helm chart's values.yaml file:
annotations:
  sidecar.istio.io/inject: "false"
After this introduction to how Istio proxies can be injected into the Pods, we can now learn about the Istio API objects used in this book.
Introducing Istio API objects
Istio also comes with a set of Kubernetes Custom Resource Definitions (CRDs). CRDs are used in Kubernetes to extend its API, that is, to add new objects to its API. Refer to the Introducing Kubernetes API objects section in Chapter 15, Introduction to Kubernetes, for a recap of the Kubernetes API. In this book, we will use the following Istio objects:
- Gateway is used to configure how to handle incoming traffic to, and outgoing traffic from, the service mesh. A gateway depends on a virtual service routing the incoming traffic to Kubernetes Services. We will use a gateway object to accept incoming traffic to DNS names ending with
minikube.me, using HTTPS. The Istio gateway objects will replace the Ingress objects used in the previous chapter. Refer to the Replacing Kubernetes Ingress controller with Istio ingress gateway section for details. - VirtualService is used to define routing rules in the service mesh. We will use virtual services to describe how to route incoming traffic from an Istio gateway to the Kubernetes Services and between services. We will also use virtual services to inject faults and delays to test the reliability and resilience capabilities of the service mesh.
- DestinationRule is used to define policies and rules for traffic that is routed (using a virtual service) to a specific service (that is, a destination). We will use destination rules to set up encryption policies to encrypt internal HTTP traffic and define service subsets that describe available versions of the services. We will use service subsets when performing zero-downtime (blue/green) deployments from an existing version of a microservice to a new version.
The division of responsibility between
VirtualServiceandDestinationRulemight seem a bit unclear in the beginning. AVirtualServiceobject is used to configure routing to a service andDestinationRuleis used to configure how to handle traffic for a selected service. So, first areVirtualServiceobjects, used to determine where to send a request. Once that is decided, the receiving service'sDestinationRuleis applied.
- PeerAuthentication is used to control service-to-service authentication inside the service mesh. Istio can protect communication between services in a service mesh by automatically provisioning mutual TLS (mTLS) for transport authentication, where client services are authenticated by using a client certificate that is provided by Istio. To allow Kubernetes to call liveness and readiness probes using plain HTTP, we will configure Istio to allow a mix of mTLS and plain HTTP, called
PERMISSIVEmode. - RequestAuthentication is used to authenticate end users based on credentials provided in a request. Istio supports the use of JSON Web Tokens (JWTs) in general and specifically when used according to the OpenID Connect (OIDC) specification. Istio supports the use of the standard discovery endpoint in OIDC to specify where Istio can fetch the public key set (JWKS) to validate signatures of the JWTs. We will configure Istio to authenticate external requests using the auth server by specifying its JWKS discovery endpoint. For a recap, see Chapter 11, Securing Access to APIs.
- AuthorizationPolicy is used to provide access control in Istio. We will not use Istio's access control in this book. Instead, we will reuse the existing access control implemented in the
product-compositemicroservice. We will therefore configure anAuthorizationPolicyobject that allows access to theproduct-compositemicroservice for any authenticated user, that is, for requests that contain a valid JWT in the form of an OIDC access token.
For more information on these API objects, see https://istio.io/v1.9/docs/reference/config/networking/ and https://istio.io/v1.9/docs/reference/config/security/.
Now that we have introduced the API object we will use, we will go through the changes applied to the microservice landscape arising from the introduction of Istio.
Simplifying the microservice landscape
As we have seen in the preceding section, Istio comes with components that overlap with components currently used in the microservice landscape in terms of functionality:
- The Istio ingress gateway can act as an edge server, an alternative to a Kubernetes Ingress controller
- The Jaeger component that comes bundled with Istio can be used for distributed tracing instead of the Zipkin server that we deploy together with the microservices
In the following two subsections, we will get an overview of why and how the Kubernetes Ingress controller is replaced with an Istio ingress gateway, and our Zipkin server is replaced with the Jaeger component that comes integrated with Istio.
Replacing Kubernetes Ingress controller with Istio ingress gateway
In the previous chapter, we introduced the Kubernetes Ingress controller as an edge server (refer to the Replacing the Spring Cloud Gateway section in Chapter 17, Implementing Kubernetes Features to Simplify the System Landscape). An Istio ingress gateway has a number of advantages over a Kubernetes Ingress controller:
- It can report telemetry data to the control plane for the traffic that flows through it
- It can be used for more fine-grained routing
- It can both authenticate and authorize requests before routing them into the service mesh
To benefit from these advantages, we will replace the Kubernetes Ingress controller with the Istio ingress gateway. The Istio ingress gateway is used by creating Gateway and VisualService objects described previously in the Introducing Istio API objects section.
The definition of the previously used Ingress objects has been removed from the dev-env and prod-env Helm charts in kubernetes/helm/environments. Definition files for Istio Gateway and VirtualService objects will be explained in the Creating the service mesh section.
The Istio ingress gateway is reached using a different IP address than the IP address used to access the Kubernetes Ingress controller, so we also need to update the IP address mapped to the hostname, minikube.me, which we use when running tests. This is handled in the Setting up access to Istio services section.
Replacing the Zipkin server with Istio's Jaeger component
As mentioned in the Introducing Istio section, Istio comes with built-in support for distributed tracing using Jaeger. Using Jaeger, we can offload and simplify the microservice landscape by removing the Zipkin server we introduced in Chapter 14, Understanding Distributed Tracing.
The following changes have been applied to the source code to remove the Zipkin server:
- The dependency on
org.springframework.cloud:spring-cloud-starter-zipkinin all microservice build files,build.gradle, has been removed - The definition of the Zipkin server in the three Docker Compose files,
docker-compose.yml,docker-compose-partitions.yml, anddocker-compose-kafka.yml, has been removed - The Helm chart for the Zipkin server has been removed
- The Zipkin-specific property,
spring.zipkin.sender.type, has been removed from the common configuration file,config-repo/application.yml
Jaeger will be installed in the Deploying Istio in a Kubernetes cluster section coming up.
With these simplifications of the microservice landscape explained, we are ready to deploy Istio in the Kubernetes cluster.
Deploying Istio in a Kubernetes cluster
In this section, we will learn how to deploy Istio in a Kubernetes cluster and how to access the Istio services in it.
We will use Istio's CLI tool, istioctl, to install Istio using a demo configuration of Istio that is suitable for testing Istio in a development environment, that is, with most features enabled but configured for minimalistic resource usage.
This configuration is unsuitable for production usage and for performance testing.
For other installation options, see https://istio.io/docs/setup/kubernetes/install.
To deploy Istio, perform the following steps:
- Ensure that your Minikube instance from the previous chapter is up and running with the following command:
minikube statusExpect a response along the lines of the following, provided it is up and running:

Figure 18.4: Minikube status OK
- Run a precheck to verify that the Kubernetes cluster is ready for installing Istio in it:
istioctl experimental precheckExpect a response including the following headers (details from the output have been removed for clarity):

Figure 18.5: Istio precheck OK
- Install Istio using the demo profile with the following command:
istioctl install --skip-confirmation
  --set profile=demo
  --set meshConfig.accessLogFile=/dev/stdout
  --set meshConfig.accessLogEncoding=JSON
The
accessLogparameters are used to enable the Istio proxies to log requests that are processed. Once Pods are up and running with Istio proxies installed, the access logs can be inspected with the commandkubectl logs <MY-POD> -c istio-proxy. - Wait for the Deployment objects and their Pods to be available with the following command:
kubectl -n istio-system wait --timeout=600s --for=condition=available deployment --all - Next, install the extra components described in the Introducing Istio section – Kiali, Jaeger, Prometheus, and Grafana – with the commands:
istio_version=$(istioctl version --short --remote=false)
echo "Installing integrations for Istio v$istio_version"

kubectl apply -n istio-system -f https://raw.githubusercontent.com/istio/istio/${istio_version}/samples/addons/kiali.yaml

kubectl apply -n istio-system -f https://raw.githubusercontent.com/istio/istio/${istio_version}/samples/addons/jaeger.yaml

kubectl apply -n istio-system -f https://raw.githubusercontent.com/istio/istio/${istio_version}/samples/addons/prometheus.yaml

kubectl apply -n istio-system -f https://raw.githubusercontent.com/istio/istio/${istio_version}/samples/addons/grafana.yaml
If any of these commands fail, try rerunning the failing command. Errors can occur due to timing issues, which can be resolved by running commands again. Specifically, the installation of Kiali can result in error messages starting with
unable to recognize. Rerunning the command makes these error messages go away. - Wait a second time for the extra components to be available with the following command:
kubectl -n istio-system wait --timeout=600s --for=condition=available deployment --all - Finally, run the following command to see what we got installed:
kubectl -n istio-system get deployExpect output similar to this:
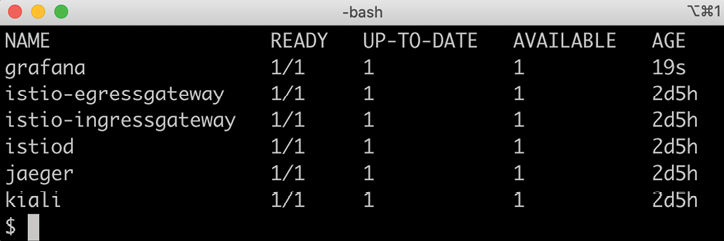
Figure 18.6: Deployments in the Istio Namespace
Istio is now deployed in Kubernetes, but before we move on and create the service mesh, we need to learn a bit about how to access the Istio services in a Minikube environment.
Setting up access to Istio services
The demo configuration used in the previous section to install Istio comes with a few connectivity-related issues that we need to resolve. The Istio ingress gateway is configured as a load-balanced Kubernetes service; that is, its type is LoadBalancer. To be able to access the gateway, we need to run a load balancer in front of the Kubernetes cluster.
Minikube contains a command that can be used to simulate a local load balancer, minikube tunnel. This command assigns an external IP address to each load-balanced Kubernetes service, including the Istio ingress gateway. The hostname, minikube.me, that we use in our tests needs to be translated to the external IP address of the Istio ingress gateway. To simplify access to the web UIs of components like Kiali and Jaeger, we will also add hostnames dedicated to these services, for example, kiali.minikube.me.
We will also register a hostname to the external health endpoint as described in the Observing the service mesh section. Finally, a few hostnames for services installed and used in subsequent chapters will also be registered so we don't need to add new hostnames in the following chapters. The services that we will install in the next chapters are Kibana, Elasticsearch, and a mail server.
To enable external access using these hostnames to the Istio services, a Helm chart has been created; see kubernetes/helm/environments/istio-system. The chart contains a Gateway, VirtualService, and DestinationRule object for each Istio component. To protect requests to these hostnames from eavesdropping, only HTTPS requests are allowed. The cert-manager, which was introduced in the previous chapter, is used by the chart to automatically provision a TLS certificate for the hostnames and store it in a Secret named hands-on-certificate. All Gateway objects are configured to use this Secret in their configuration of the HTTPS protocol. All definition files can be found in the Helm charts templates folder.
The use of these API objects will be described in more detail in the Creating the service mesh and Protecting external endpoints with HTTPS and certificates sections below.
Run the following command to apply the Helm chart:
helm upgrade --install istio-hands-on-addons kubernetes/helm/environments/istio-system -n istio-system --wait
This will result in the gateway being able to route requests for the following hostnames to the corresponding Kubernetes Service:
kiali.minikube.merequests are routed tokiali:20001tracing.minikube.merequests are routed totracing:80prometheus.minikube.merequests are routed toprometheus:9000grafana.minikube.merequests are routed tografana:3000
To verify that the certificate and secret objects have been created, run the following commands:
kubectl -n istio-system get secret hands-on-certificate
kubectl -n istio-system get certificate  hands-on-certificate
Expect output like this:
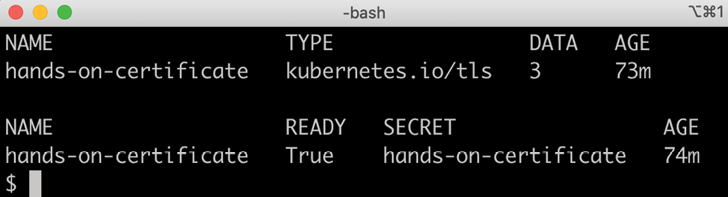
Figure 18.7: The cert-manager has delivered both a TLS Secret and a certificate
The following diagram summarizes how the components can be accessed:
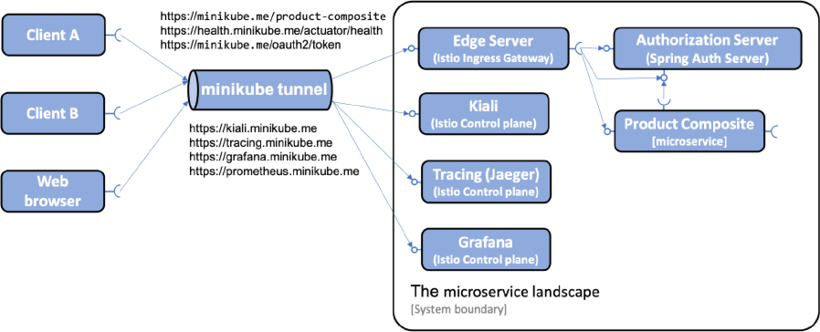
Figure 18.8: Hostnames to be used for accessing components through the Minikube tunnel
Perform the following steps to set up the Minikube tunnel and register the hostnames:
- Run the following command in a separate terminal window (the command locks the terminal window when the tunnel is up and running):
minikube tunnelNote that this command requires that your user has
sudoprivileges and that you enter your password during startup and shutdown. It takes a couple of seconds before the command asks for the password, so it is easy to miss!Once the tunnel is up and running, it will list the
istio-ingressgatewayas one of the services it exposes (the only one in our case). - Configure the hostnames to be resolved to the IP address of the Istio ingress gateway. Start by getting the IP address exposed by the
minikube tunnelcommand for the Istio ingress gateway and save it in an environment variable namedINGRESS_IP:INGRESS_IP=$(kubectl -n istio-system get service istio-ingressgateway -o jsonpath='{.status.loadBalancer.ingress[0].ip}') echo $INGRESS_IPThe
echocommand will print an IP address, for example,10.102.72.36.On Windows and WSL 2, this IP address will always be
127.0.0.1since we are using Minikube's Docker driver. - Update
/etc/hostsso that allminikube.mehostnames we will use point to the IP address of the Istio ingress gateway:MINIKUBE_HOSTS="minikube.me grafana.minikube.me kiali.minikube.me prometheus.minikube.me tracing.minikube.me kibana.minikube.me elasticsearch.minikube.me mail.minikube.me health.minikube.me" echo "$INGRESS_IP $MINIKUBE_HOSTS" | sudo tee -a /etc/hosts - On Windows, we also need to update the Windows own
hostsfile:- In Windows, open a
PowerShellterminal. - Open the Windows
hostsfile in Visual Code Studio with the command:code C:WindowsSystem32driversetchosts - Add a similar line to the Window
hostsfile:127.0.0.1 minikube.me grafana.minikube.me kiali.minikube.me prometheus.minikube.me tracing.minikube.me kibana.minikube.me elasticsearch.minikube.me mail.minikube.me health.minikube.me - When you try to save it, you will get an error regarding
Insufficient permissions. Click on the Retry as Admin... button to update thehostsfile as an administrator. - Verify the update:
cat C:WindowsSystem32driversetchosts
By default, the
/etc/hostsfile is overwritten by the content in the Windowshostsfile when WSL is restarted. Restarting WSL takes a long time as it also restarts Docker. Restarting Docker, in turn, results in the Minikube instance being stopped so it needs to be restarted manually. So, to avoid this slow and tedious restart process, we simply updated both files. - In Windows, open a
- Remove the line in
/etc/hostswhereminikube.mepoints to the IP address of the Minikube instance (minikube ip). Verify that/etc/hostsonly contains one line that translatesminikube.meand that it points to the IP address of the Istio ingress gateway; the value of$INGRESS_IP:
Figure 18.9: /etc/hosts file updated
- Verify that Kiali, Jaeger, Grafana, and Prometheus can be reached through the tunnel with the following commands:
curl -o /dev/null -sk -L -w "%{http_code}
" https://kiali.minikube.me/kiali/
curl -o /dev/null -sk -L -w "%{http_code}
" https://tracing.minikube.me
curl -o /dev/null -sk -L -w "%{http_code}
" https://grafana.minikube.me
curl -o /dev/null -sk -L -w "%{http_code}
" https://prometheus.minikube.me/graph#/
Each command should return
200(OK). If the request sent to Kiali doesn't return 200, it often means that its internal initialization is not complete. Wait a minute and try again in that case.
The minikube tunnel command will stop running if, for example, your computer or the Minikube instance are paused or restarted. It needs to be restarted manually in these cases. So, if you fail to call APIs on any of the minikube.me hostnames, always check whether the Minikube tunnel is running and restart it if required.
With the Minikube tunnel in place, we are now ready to create the service mesh.
Creating the service mesh
With Istio deployed, we are ready to create the service mesh. The steps required to create the service mesh are basically the same as those we used in Chapter 17, Implementing Kubernetes Features to Simplify the System Landscape (refer to the Testing with Kubernetes ConfigMaps, Secrets, Ingress, and cert-manager section). Let's first see what additions have been made to the Helm templates to set up the service mesh before we run the commands to create the service mesh.
Source code changes
To be able to run the microservices in a service mesh managed by Istio, the dev-env Helm chart brings in two new named templates from the common chart, _istio_base.yaml and _istio_dr_mutual_tls.yaml. Let's go through them one by one.
Content in the _istio_base.yaml template
_istio_base.yaml defines a number of Kubernetes manifests that will be used by both environment charts, dev-env and prod-env. First, it defines three Istio-specific security-related manifests:
- An
AuthorizationPolicymanifest namedproduct-composite-require-jwt - A
PeerAuthenticationmanifest nameddefault - A
RequestAuthenticationmanifest namedproduct-composite-request-authentication
These three manifests will be explained in the Securing a service mesh section below.
The remaining four manifests will be discussed here. They are two pairs of Gateway and VirtualService manifests that are used to configure access to, and routing from, the hostnames minikube.me and health.minikube.me. Gateway objects will be used to define how to receive external traffic and VirtualService objects are used to describe how to route the incoming traffic inside the service mesh.
The Gateway manifest for controlling access to minikube.me looks like this:
apiVersion: networking.istio.io/v1beta1
kind: Gateway
metadata:
  name: hands-on-gw
spec:
  selector:
    istio: ingressgateway
  servers:
  - hosts:
    - minikube.me
    port:
      name: https
      number: 443
      protocol: HTTPS
    tls:
      credentialName: hands-on-certificate
      mode: SIMPLE
Here are some explanations for the source code:
- The gateway is named
hands-on-gw; this name is used by the virtual services underneath. - The
selectorfield specifies that the gateway object will be handled by the default Istio ingress gateway, namedingressgateway. - The
hostsandportfields specify that the gateway will handle incoming requests for theminikube.mehostname using HTTPS over port443. - The
tlsfield specifies that the Istio ingress gateway can find the certificate and private key used for HTTPS communication in a TLS Secret namedhands-on-certificate. Refer to the Protecting external endpoints with HTTPS and certificates section below for details on how these certificate files are created. TheSIMPLEmode denotes that normal TLS semantics will be applied.
The VirtualService manifest for routing requests sent to minikube.me appears as follows:
apiVersion: networking.istio.io/v1beta1
kind: VirtualService
metadata:
  name: hands-on-vs
spec:
  gateways:
  - hands-on-gw
  hosts:
  - minikube.me
  http:
  - match:
    - uri:
        prefix: /oauth2
    route:
    - destination:
        host: auth-server
  – match:
    ...
Explanations for the preceding manifest are as follows:
- The
gatewaysandhostsfields specify that the virtual service will route requests that are sent to theminikube.mehostname through thehands-on-gwgateway. - Under the
httpelement follows an array ofmatchandrouteblocks that specify how URL paths will be forwarded to the associated Kubernetes service. In the manifest above, only the first pair ofmatchandrouteelements is shown. They map requests sent tominikube.meusing the path/oauth2to theauth-serverservice. This mapping should be familiar from how we specified routing rules in both the Spring Cloud Gateway and Ingress objects in the previous chapters. The remaining pairs ofmatchandrouteelements configure the same routing rules as we have seen for the Spring Cloud Gateway and Ingress objects:/login→auth-server/error→auth-server/product-composite→product-composite/openapi→product-composite/webjars→product-composite
For details, see
kubernetes/helm/common/templates/_istio_base.yaml.In the preceding source code, the destination host is specified using its short name, in other words,
product-composite. This works, since the example is based on Kubernetes definitions from the same Namespace,hands-on. If that is not the case, it is recommended in the Istio documentation to use the host's fully qualified domain name (FQDN) instead. In this case, it isproduct-composite.hands-on.svc.cluster.local.
Content in the _istio_dr_mutual_tls.yaml template
_istio_dr_mutual_tls.yaml defines a template for specifying a number of DestinationRule objects. It is used to specify that mutual TLS should be used when routing a request to its corresponding service. It can also be used optionally to specify subsets, something that we will use in the prod-env chart in the Performing zero-downtime updates section below. The template looks like this:
{{- define "common.istio_dr_mutual_tls" -}}
{{- range $idx, $dr := .Values.destinationRules }}
apiVersion: networking.istio.io/v1beta1
kind: DestinationRule
metadata:
  name: {{ $dr.name }}
spec:
  host: {{ $dr.name }}
{{- if $dr.subsets }}
{{- with $dr.subsets }}
  subsets:
{{ toYaml . | indent 2 }}
{{- end }}
{{- end }}
  trafficPolicy:
    tls:
      mode: ISTIO_MUTUAL
---
{{- end -}}
{{- end -}}
Here are some comments about the preceding template:
- The
rangedirective loops over the elements defined in thedestinationRulesvariable - The
hostfield in thespecpart of the manifest is used to specify the name of the Kubernetes Service that thisDestinationRuleapplies to - A
subsetssection is only defined if a corresponding element is found in the current element,$dr, in thedestinationRuleslist - A
trafficPolicyis always used to require mutual TLS
The template is used in the dev-end Helm chart by specifying the destinationRules variable in the values.yaml file as follows:
destinationRules:
  - name: product-composite
  - name: auth-server
  - name: product
  - name: recommendation
  - name: review
The files can be found at kubernetes/helm/common/templates/_istio_dr_mutual_tls.yaml and kubernetes/helm/environments/dev-env/values.yaml.
With these changes in the source code in place, we are now ready to create the service mesh.
Running commands to create the service mesh
Create the service mesh by running the following commands:
- Build Docker images from source with the following commands:
cd $BOOK_HOME/Chapter18 eval $(minikube docker-env) ./gradlew build && docker-compose build - Recreate the
hands-onNamespace, and set it as the default Namespace:kubectl delete namespace hands-on kubectl apply -f kubernetes/hands-on-namespace.yml kubectl config set-context $(kubectl config current-context) --namespace=hands-onNote that the
hands-on-namespace.ymlfile creates thehands-onNamespace labeled withistio-injection: enabled. This means that Pods created in this Namespace will getistio-proxycontainers injected as sidecars automatically. - Resolve the Helm chart dependencies with the following commands:
- First, we update the dependencies in the
componentsfolder:for f in kubernetes/helm/components/*; do helm dep up $f; done - Next, we update the dependencies in the
environmentsfolder:for f in kubernetes/helm/environments/*; do helm dep up $f; done
- First, we update the dependencies in the
- Deploy the system landscape using Helm and wait for all Deployments to complete:
helm install hands-on-dev-env kubernetes/helm/environments/dev-env -n hands-on --wait - Once the Deployment is complete, verify that we have two containers in each of the microservice Pods:
kubectl get podsExpect a response along the lines of the following:

Figure 18.10: Pods up and running
Note that the Pods that run our microservices report two containers per Pod; that is, they have the Istio proxy injected as a sidecar!
- Run the usual tests with the following command:
./test-em-all.bashThe default values for the
test-em-all.bashscript have been updated from previous chapters to accommodate Kubernetes running in Minikube.Expect the output to be similar to what we have seen in previous chapters:
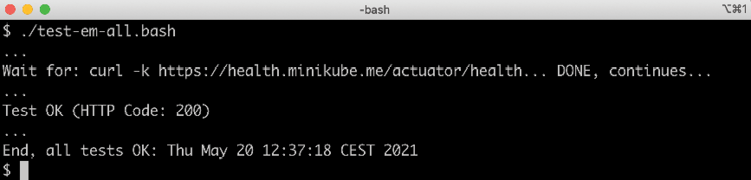
Figure 18.11: Tests running successfully
- You can try out the APIs manually by running the following commands:
ACCESS_TOKEN=$(curl -k https://writer:[email protected]/oauth2/token -d grant_type=client_credentials -s | jq .access_token -r)
echo ACCESS_TOKEN=$ACCESS_TOKEN
curl -ks https://minikube.me/product-composite/1 -H "Authorization: Bearer $ACCESS_TOKEN" | jq .productId
Expect the requested product ID,
1, in the response.
With the service mesh up and running, let's see how we can observe what's going on in it using Kiali!
Observing the service mesh
In this section, we will use Kiali together with Jaeger to observe what's going on in the service mesh.
Before we do that, we need to understand how to get rid of some noise created by the health checks performed by Kubernetes' liveness and readiness probes. In the previous chapters, they have been using the same port as the API requests. This means that Istio will collect metrics for the usage of both health checks and requests sent to the API. This will cause the graphs shown by Kiali to become unnecessarily cluttered. Kiali can filter out traffic that we are not interested in, but a simpler solution is to use a different port for the health checks.
Microservices can be configured to use a separate port for requests sent to the actuator endpoints, for example, health checks sent to the /actuator/health endpoint. The following line has been added to the common configuration file for all microservices, config-repo/application.yml:
management.server.port: 4004
This will make all microservices use port 4004 to expose the health endpoints. The values.yaml file in the common Helm chart has been updated to use port 4004 in the default liveness and readiness probes. See kubernetes/helm/common/values.yaml.
The product-composite microservice exposes its management port, not only to the Kubernetes probes, but also externally for health checks, for example, performed by test-em-all.bash. This is done through Istio's ingress gateway, and therefore port 4004 is added to the product-composite microservice Deployment and Service manifests. See the ports and service.ports definitions in kubernetes/helm/components/product-composite/values.yaml.
The Spring Cloud Gateway (which is retained so we can run tests in Docker Compose) will continue to use the same port for requests to the API and the health endpoint. In the config-repo/gateway.yml configuration file, the management port is reverted to the port used for the API:
management.server.port: 8443
To simplify external access to the health check exposed by the product-composite microservice, a route is configured for the health.minikube.me hostname to the management port on the product-composite microservice. Refer to the explanation of the _istio_base.yaml template above.
With the requests sent to the health endpoint out of the way, we can start to send some requests through the service mesh.
We will start a low-volume load test using siege, which we learned about in Chapter 16, Deploying Our Microservices to Kubernetes. After that, we will go through some of the most important parts of Kiali to see how it can be used to observe a service mesh in a web browser. We will also see how Jaeger is used for distributed tracing.
Since the certificate we use is self-signed, web browsers will not rely on it automatically. Most web browsers let you visit the web page if you assure them that you understand the security risks. If the web browser refuses, opening a private window helps in some cases.
Specifically, regarding Chrome, if it does not let you visit the web page, you can use a hidden feature by clicking anywhere on the error page and then typing one of the following words:
- "
thisisunsafe" for version 65 or newer - "
badidea" for versions 62-64 - "
danger" for earlier versions
At the time of writing, the source code handling this in Chrome can be found at https://chromium.googlesource.com/chromium/src/+/refs/heads/main/components/security_interstitials/core/browser/resources/interstitial_large.js. The value of the BYPASS_SEQUENCE field is set to the Base64-encoded value 'dGhpc2lzdW5zYWZl'. Running the following command:
echo dGhpc2lzdW5zYWZl | base64 -d
reveals the bypass code for the current version of Chrome: thisisunsafe.
Start the test client with the following commands:
ACCESS_TOKEN=$(curl -k https://writer:[email protected]/oauth2/token -d grant_type=client_credentials -s | jq .access_token -r)

echo ACCESS_TOKEN=$ACCESS_TOKEN

siege https://minikube.me/product-composite/1 -H "Authorization: Bearer $ACCESS_TOKEN" -c1 -d1 -v
The first command will get an OAuth 2.0/OIDC access token that will be used in the next command, where siege is used to submit one HTTP request per second to the product-composite API.
Expect output from the siege command as follows:
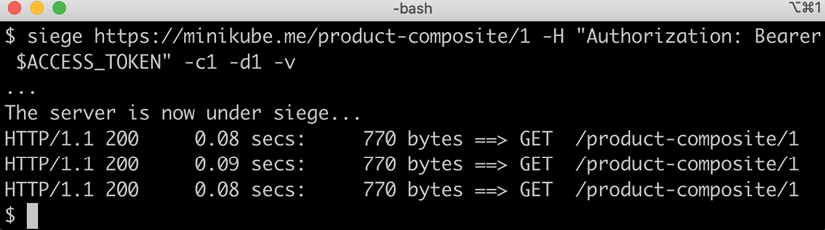
Figure 18.12: System landscape under siege
Use a web browser of your choice that accepts self-signed certificates and proceed with the following steps:
- Open Kiali's web UI using the https://kiali.minikube.me URL and, if asked to log in, use the following username and password:
adminandadmin. Expect a web page similar to the following: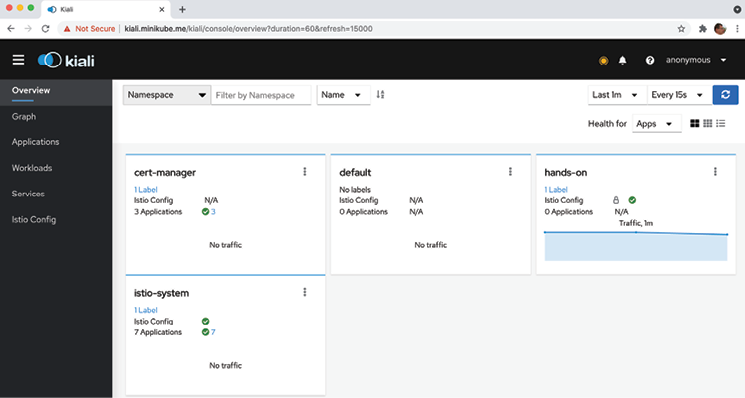
Figure 18.13: Kiali web UI
- Click on the Overview tab, if not already active.
- Click on the menu in the box named hands-on (three vertical dots in the top-right corner) and select Graph. Expect a graph to be shown, representing the current traffic flowing through the service mesh, as follows:
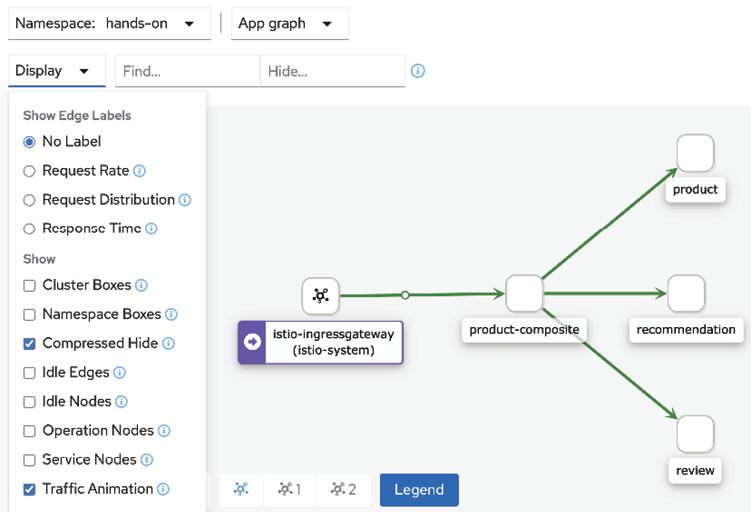
Figure 18.14: Kiali graph showing the hands-on Namespace
- Click on the Display button, unselect Service Nodes, and select Traffic Animation.
Kiali displays a graph representing requests that are currently sent through the service mesh, where active requests are represented by small moving circles along the arrows.
This gives a pretty good initial overview of what's going on in the service mesh!
- Let's now look at some distributed tracing using Jaeger. Open the web UI using the https://tracing.minikube.me URL. Click on the Service dropdown in the menu to the left and select the product-composite service. Click on the Find Trace button and you should see a result like this:
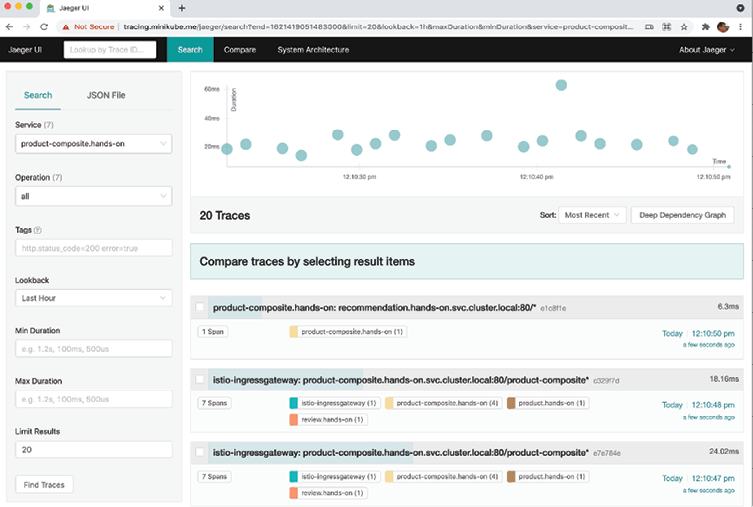
Figure 18.15: Distributed traces visualized by Jaeger
- Click on one of the traces that is reported to contain 8 Spans to examine it. Expect a web page such as the following:
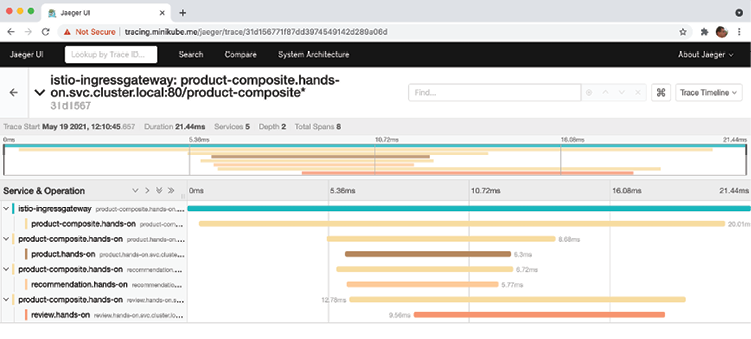
Figure 18.16: View a full trace call tree in Jaeger
This is basically the same tracing information as Zipkin made available in Chapter 14, Understanding Distributed Tracing.
There is much more to explore, but this is enough by way of an introduction. Feel free to explore the web UI in Kiali and Jaeger on your own.
Be aware that the access token acquired for the test client, siege, is only valid for an hour. If the traffic drops unexpectedly, check the output from siege; if it reports 4XX instead of 200, it's time to renew the access token!
Let's move on and learn how Istio can be used to improve security in the service mesh!
Securing a service mesh
In this section, we will learn how to use Istio to improve the security of a service mesh. We will cover the following topics:
- How to protect external endpoints with HTTPS and certificates
- How to require that external requests are authenticated using OAuth 2.0/OIDC access tokens
- How to protect internal communication using mutual authentication (mTLS)
Let's now understand each of these in the following sections.
Protecting external endpoints with HTTPS and certificates
From the Setting up access to Istio services and Content in the _istio_base.yaml template sections, we learned that the Gateway objects use a TLS certificate stored in a Secret named hands-on-certificate for its HTTPS endpoints.
The Secret is created by the cert-manager based on the configuration in the istio-system Helm chart. The chart's template, selfsigned-issuer.yaml, is used to define an internal self-signed CA and has the following content:
apiVersion: cert-manager.io/v1
kind: Issuer
metadata:
  name: selfsigned-issuer
spec:
  selfSigned: {}
---
apiVersion: cert-manager.io/v1
kind: Certificate
metadata:
  name: ca-cert
spec:
  isCA: true
  commonName: hands-on-ca
  secretName: ca-secret
  issuerRef:
    name: selfsigned-issuer
---
apiVersion: cert-manager.io/v1
kind: Issuer
metadata:
  name: ca-issuer
spec:
  ca:
    secretName: ca-secret
From the preceding manifests, we can see the following:
- A self-signed issuer named
selfsigned-issuer. - This issuer is used to create a self-signed certificate, named
ca-cert. - The certificate is given the common name
hands-on-ca. - Finally, a self-signed CA,
ca-issuer, is defined using the certificate,ca-cert, as its root certificate. This CA will be used to issue the certificate used by the gateway objects.
The chart's template, hands-on-certificate.yaml, defines this certificate as:
apiVersion: cert-manager.io/v1
kind: Certificate
metadata:
  name: hands-on-certificate
spec:
  commonName: minikube.me
  subject:
    ...
  dnsNames:
  - minikube.me
  - health.minikube.m
  - dashboard.minikube.me
  - kiali.minikube.me
  - tracing.minikube.me
  - prometheus.minikube.me
  - grafana.minikube.me
  - kibana.minikube.me
  - elasticsearch.minikube.me
  - mail.minikube.me
  issuerRef:
    name: ca-issuer
  secretName: hands-on-certificate
From this manifest, we can learn that:
- The certificate is named
hands-on-certificate - Its common name is set to
minikube.me - It specifies a few optional extra details about its
subject(left out for clarity) - All other hostnames are declared as Subject Alternative Names in the certificate
- It will use the issuer named
ca-issuerdeclared above - The cert-manager will store the TLS certificate in a Secret named
hands-on-certificate
When the istio-system Helm chart was installed, these templates were used to create the corresponding API objects in Kubernetes. This triggered the cert-manager to create the certificates and Secrets.
The template files can be found in the kubernetes/helm/environments/istio-system/templates folder.
To verify that it is these certificates that are used by the Istio ingress gateway, we can run the following command:
keytool -printcert -sslserver minikube.me | grep -E "Owner:|Issuer:"
Expect the following output:

Figure 18.17: Inspecting the certificate for minikube.me
The output shows that the certificate is issued for the common name minikube.se and that it is issued by our own CA, using its root certificate with the common name hands-on-ca.
As mentioned in Chapter 17, Implementing Kubernetes Features to Simplify the System Landscape (refer to the Automating certificate provisioning section), this self-signed CA needs to be replaced for production use cases with, for example, Let's Encrypt or another CA that the cert-manager can use to provision trusted certificates.
With the certificate configuration verified, let's move on to see how the Istio ingress gateway can protect microservices from unauthenticated requests.
Authenticating external requests using OAuth 2.0/OIDC access tokens
Istio Ingress Gateway can require and validate JWT-based OAuth 2.0/OIDC access tokens, in other words, protecting the microservices in the service mesh from external unauthenticated requests. For a recap on JWT, OAuth 2.0, and OIDC, refer to Chapter 11, Securing Access to APIs (see the Protecting APIs using OAuth 2.0 and OpenID Connect section). Istio can also be configured to perform authorization but, as mentioned in the Introducing Istio API objects section, we will not use it.
This is configured in the common Helm chart's template, _istio_base.yaml. The two manifests look like this:
apiVersion: security.istio.io/v1beta1
kind: RequestAuthentication
metadata:
  name: product-composite-request-authentication
spec:
  jwtRules:
  - forwardOriginalToken: true
    issuer: http://auth-server
    jwksUri: http://auth-server.hands-on.svc.cluster.local/oauth2/jwks
  selector:
    matchLabels:
      app.kubernetes.io/name: product-composite

---

apiVersion: security.istio.io/v1beta1
kind: AuthorizationPolicy
metadata:
  name: product-composite-require-jwt
spec:
  action: ALLOW
  rules:
  - {}
  selector:
    matchLabels:
      app.kubernetes.io/name: product-composite
From the manifests, we can see the following:
- The
RequestAuthenticationnamedproduct-composite-request-authenticationrequires a valid JWT-encoded access token for requests sent to theproduct-compositeservice:- It selects services that it performs request authentication for based on a label selector,
app.kubernetes.io/name: product-composite. - It allows tokens from the issuer,
http://auth-server. - It will use the
http://auth-server.hands-on.svc.cluster.local/oauth2/jwksURL to fetch a JSON Web Key Set. The key set is used to validate the digital signature of the access tokens. - It will forward the access token to the underlying services, in our case the
product-compositemicroservice.
- It selects services that it performs request authentication for based on a label selector,
- The
AuthorizationPolicynamedproduct-composite-require-jwtis configured to allow all requests to theproduct-compositeservice; it will not apply any authorization rules.
It can be a bit hard to understand whether Istio's RequestAuthentication is validating the access tokens or whether it is only the product-composite service that is performing the validation. One way to ensure that Istio is doing its job is to change the configuration of RequestAuthentication so that it always rejects access tokens.
To verify that RequestAuthentication is in action, apply the following commands:
- Make a normal request:
ACCESS_TOKEN=$(curl -k https://writer:[email protected]/oauth2/token -d grant_type=client_credentials -s | jq .access_token -r)

echo ACCESS_TOKEN=$ACCESS_TOKEN

curl -k https://minikube.me/product-composite/1 -H "Authorization: Bearer $ACCESS_TOKEN" -i
Verify that it returns an HTTP response status code
200(OK). - Edit the
RequestAuthenticationobject and temporarily change the issuer, for example, tohttp://auth-server-x:kubectl edit RequestAuthentication product-composite-request-authentication - Verify the change:
kubectl get RequestAuthentication product-composite-request-authentication -o yamlVerify that the issuer has been updated, in my case to
http://auth-server-x. - Make the request again. It should fail with the HTTP response status code
401(Unauthorized) and the error messageJwt issuer is not configured:curl -k https://minikube.me/product-composite/1 -H "Authorization: Bearer $ACCESS_TOKEN" -iSince it takes a few seconds for Istio to propagate the change, the new name of the issuer, you might need to repeat the command a couple of times before it fails.
This proves that Istio is validating the access tokens!
- Revert the changed name of the issuer back to
http://auth-server:kubectl edit RequestAuthentication product-composite-request-authentication - Verify that the request works again. First, wait a few seconds for the change to be propagated. Then, run the command:
curl -k https://minikube.me/product-composite/1 -H "Authorization: Bearer $ACCESS_TOKEN"Suggested additional exercise: Try out the Auth0 OIDC provider, as described in Chapter 11, Securing Access to APIs (refer to the Testing with an external OpenID Connect provider section). Add your Auth0 provider to
jwt-authentication-policy.yml. In my case, it appears as follows:- jwtRules: issuer: "https://dev-magnus.eu.auth0.com/" jwksUri: "https://dev-magnus.eu.auth0.com/.well-known/jwks.json"
Now, let's move on to the last security mechanism that we will cover in Istio: the automatic protection of internal communication in the service mesh using mutual authentication, mTLS.
Protecting internal communication using mutual authentication (mTLS)
In this section, we will learn how Istio can be configured to automatically protect internal communication within the service mesh using mutual authentication (mTLS). When using mutual authentication, not only does the service prove its identity by exposing a certificate, but the clients also prove their identity to the service by exposing a client-side certificate. This provides a higher level of security compared to normal TLS/HTTPS usage, where only the identity of the service is proven. Setting up and maintaining mutual authentication, that is, the provisioning of new, and rotating of outdated, certificates to the clients, is known to be complex and is therefore seldom used. Istio fully automates the provisioning and rotation of certificates for mutual authentication used for internal communication inside the service mesh. This makes it much easier to use mutual authentication compared to setting it up manually.
So, why should we use mutual authentication? Isn't it sufficient to protect external APIs with HTTPS and OAuth 2.0/OIDC access tokens?
As long as the attacks come through the external API, it might be sufficient. But what if a Pod inside the Kubernetes cluster becomes compromised? For example, if an attacker gains control over a Pod, they can start listening to traffic between other Pods in the Kubernetes cluster. If the internal communication is sent as plain text, it will be very easy for the attacker to gain access to sensitive information sent between Pods in the cluster. To minimize the damage caused by such an intrusion, mutual authentication can be used to prevent an attacker from eavesdropping on internal network traffic.
To enable the use of mutual authentication managed by Istio, Istio needs to be configured both on the server side, using a policy called PeerAuthentication, and on the client side, using a DestinationRule.
The policy is configured in the common Helm chart's template, _istio_base.yaml. The manifest looks like this:
apiVersion: security.istio.io/v1beta1
kind: PeerAuthentication
metadata:
  name: default
spec:
  mtls:
    mode: PERMISSIVE
As mentioned in the Introducing Istio API objects section, the PeerAuthentication policy is configured to allow both mTLS and plain HTTP requests using the PERMISSIVE mode. This enables Kubernetes to call liveness and readiness probes using plain HTTP.
We have also already met the DestinationRule manifests in the Content in the _istio_dr_mutual_tls.yaml template section. The central part of the DestinationRule manifests for requiring mTLS looks like this:
  trafficPolicy:
    tls:
      mode: ISTIO_MUTUAL
To verify that the internal communication is protected by mTLS, perform the following steps:
- Ensure that the load tests started in the preceding Observing the service mesh section are still running and report
200(OK). - Go to the Kiali graph in a web browser (https://kiali.minikube.me).
- Click on the Display button and enable the Security label. The graph will show a padlock on all communication links that are protected by Istio's automated mutual authentication, as follows:
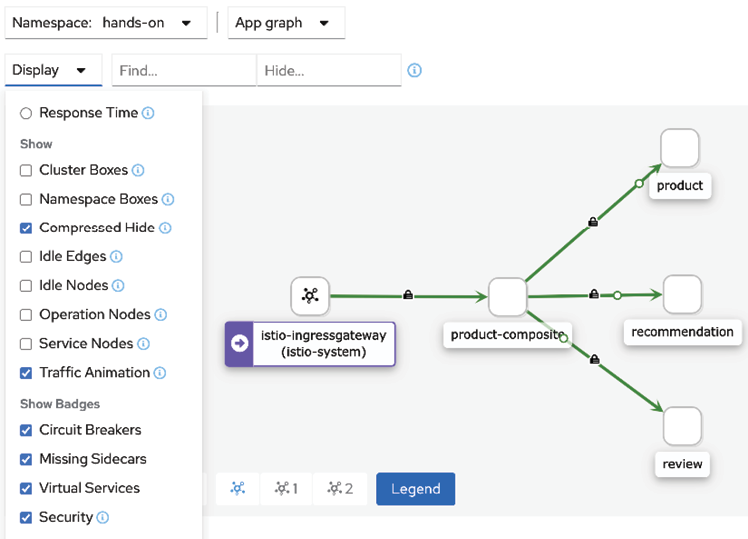
Figure 18.18: Inspecting mTLS settings in Kiali
Expect a padlock on all links.
Calls to RabbitMQ, MySQL, and MongoDB are not handled by Istio proxies, and therefore require manual configuration to be protected using TLS, if required.
With this, we have seen all three security mechanisms in Istio in action, and it is now time to see how Istio can help us to verify that a service mesh is resilient.
Ensuring that a service mesh is resilient
In this section, we will learn how to use Istio to ensure that a service mesh is resilient, that is, that it can handle temporary faults in a service mesh. Istio comes with mechanisms similar to what the Spring Framework offers in terms of timeouts, retries, and a type of circuit breaker called outlier detection to handle temporary faults. When it comes to deciding whether language-native mechanisms should be used to handle temporary faults, or whether this should be delegated to a service mesh such as Istio, I tend to favor using language-native mechanisms, as in the examples in Chapter 13, Improving Resilience Using Resilience4j. In many cases, it is important to keep the logic for handling errors, for example, handling fallback alternatives for a circuit breaker, together with other business logic for a microservice.
There are cases when the corresponding mechanisms in Istio could be of great help. For example, if a microservice is deployed and it is determined that it can't handle temporary faults that occur in production from time to time, then it can be very convenient to add a timeout or a retry mechanism using Istio instead of waiting for a new release of the microservice with corresponding error handling features put in place.
Another capability in the area of resilience that comes with Istio is the capability to inject faults and delays into an existing service mesh. Why might we want to do that?
Injecting faults and delays in a controlled way is very useful for verifying that the resilient capabilities in the microservices work as expected! We will try them out in this section, verifying that the retry, timeout, and circuit breaker in the product-composite microservice work as expected.
In Chapter 13, Improving Resilience Using Resilience4j (refer to the Adding programmable delays and random errors section), we added support for injecting faults and delays in the microservices source code. That source code should preferably be replaced by using Istio's capabilities for injecting faults and delays at runtime, as demonstrated in the following subsections.
We will begin by injecting faults to see whether the retry mechanisms in the product-composite microservice work as expected. After that, we will delay the responses from the product service and verify that the circuit breaker handles the delay as expected.
Testing resilience by injecting faults
Let's make the product service throw random errors and verify that the microservice landscape handles this correctly. We expect the retry mechanism in the product-composite microservice to kick in and retry the request until it succeeds or its limit of the maximum numbers of retries is reached. This will ensure that a short-lived fault does not affect the end user more than the delay introduced by the retry attempts. Refer to the Adding a retry mechanism section in Chapter 13, Improving Resilience Using Resilience4j, for a recap on the retry mechanism in the product-composite microservice.
Faults can be injected using a virtual service like kubernetes/resilience-tests/product-virtual-service-with-faults.yml. This appears as follows:
apiVersion: networking.istio.io/v1beta1
kind: VirtualService
metadata:
  name: product
spec:
  hosts:
    - product
  http:
  - route:
    - destination:
        host: product
    fault:
      abort:
        httpStatus: 500
        percentage:
          value: 20
The definition says that 20% of the requests sent to the product service will be aborted with the HTTP status code 500 (Internal Server Error).
Perform the following steps to test this:
- Ensure that the load tests using
siege, as started in the Observing the service mesh section, are running. - Apply the fault injection with the following command:
kubectl apply -f kubernetes/resilience-tests/product-virtual-service-with-faults.yml - Monitor the output from the
siegeload tests tool. Expect output similar to the following: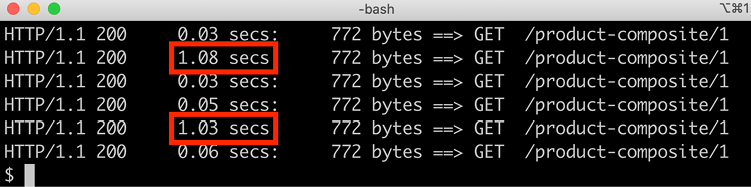
Figure 18.19: Observing the retry mechanism in action
From the sample output, we can see that all requests are still successful, in other words, status
200(OK) is returned; however, some of them (20%) take an extra second to complete. This indicates that the retry mechanism in theproduct-compositemicroservice has kicked in and has retried a failed request to theproductservice. - Conclude the tests by removing the fault injection with the following command:
kubectl delete -f kubernetes/resilience-tests/product-virtual-service-with-faults.yml
Let's now move on to the next section, where we will inject delays to trigger the circuit breaker.
Testing resilience by injecting delays
From Chapter 13, Improving Resilience Using Resilience4j, we know that a circuit breaker can be used to prevent problems due to the slow or complete lack of response of services after accepting requests.
Let's verify that the circuit breaker in the product-composite service works as expected by injecting a delay into the product service using Istio. A delay can be injected using a virtual service.
Refer to kubernetes/resilience-tests/product-virtual-service-with-delay.yml. Its code appears as follows:
apiVersion: networking.istio.io/v1beta1
kind: VirtualService
metadata:
  name: product
spec:
  hosts:
    - product
  http:
  - route:
    - destination:
        host: product
    fault:
      delay:
        fixedDelay: 3s
        percent: 100
This definition says that all requests sent to the product service will be delayed by 3 seconds.
Requests sent to the product service from the product-composite service are configured to time out after 2 seconds. The circuit breaker is configured to open its circuit if 3 consecutive requests fail. When the circuit is open, it will fast-fail; in other words, it will immediately throw an exception, not attempting to call the underlying service. The business logic in the product-composite microservice will catch this exception and apply fallback logic. For a recap, see Chapter 13, Improving Resilience Using Resilience4j (refer to the Adding a circuit breaker and a time limiter section).
Perform the following steps to test the circuit breaker by injecting a delay:
- Stop the load test by pressing Ctrl + C in the terminal window where
siegeis running. - Create a temporary delay in the
productservice with the following command:kubectl apply -f kubernetes/resilience-tests/product-virtual-service-with-delay.yml - Acquire an access token as follows:
ACCESS_TOKEN=$(curl -k https://writer:[email protected]/oauth2/token -d grant_type=client_credentials -s | jq .access_token -r) echo ACCESS_TOKEN=$ACCESS_TOKEN - Send six requests in a row:
for i in {1..6}; do time curl -k https://minikube.me/product-composite/1 -H "Authorization: Bearer $ACCESS_TOKEN"; done- The circuit opens up after the first three failed calls
- The circuit breaker applies fast-fail logic for the last three calls
- A fallback response is returned for the last three calls
The responses from the first 3 calls are expected to be a timeout-related error message, with a response time of 2 seconds (in other words, the timeout time). Expect responses for the first 3 calls along the lines of the following:

Figure 18.20: Observing timeouts
The responses from the last 3 calls are expected to come from the fallback logic with a short response time. Expect responses for the last 3 calls as follows:
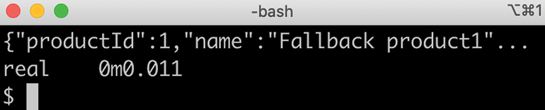
Figure 18.21: Fallback method in action
- Simulate the delay problem being fixed by removing the temporary delay with the following command:
kubectl delete -f kubernetes/resilience-tests/product-virtual-service-with-delay.yml - Verify that correct answers are returned again, and without any delay, by sending a new request using the
forloop command in step 4.If you want to check the state of the circuit breaker, you can do it with the following command:
curl -ks https://health.minikube.me/actuator/health | jq -r .components.circuitBreakers.details.product.details.stateIt should report
CLOSED,OPEN, orHALF_OPEN, depending on its state.
This proves that the circuit breaker reacts as expected when we inject a delay using Istio. This concludes testing the features in Istio that can be used to verify that the microservice landscape is resilient. The final feature we will explore in Istio is its support for traffic management; we will see how it can be used to enable deployments with zero downtime.
Performing zero-downtime updates
As mentioned in Chapter 16, Deploying Our Microservices to Kubernetes, being able to deploy an update without downtime becomes crucial with a growing number of autonomous microservices that are updated independently of one another.
In this section, we will learn about Istio's traffic management and routing capabilities and how they can be used to perform deployments of new versions of microservices without requiring any downtime. In Chapter 15, Introduction to Kubernetes, we learned that Kubernetes can be used to perform a rolling upgrade without requiring any downtime. Using the Kubernetes rolling upgrade mechanism automates the entire process, but unfortunately provides no option to test the new version before all users are routed to it.
Using Istio, we can deploy the new version, but initially route all users to the existing version (called the old version in this chapter). After that, we can use Istio's fine-grained routing mechanism to control how users are routed to the new and the old versions. We will see how two popular upgrade strategies can be implemented using Istio:
- Canary deploys: When using canary deploys, all users are routed to the old version, except for a group of selected test users who are routed to the new version. When the test users have approved the new version, regular users can be routed to the new version using a blue/green deploy.
- Blue/green deploys: Traditionally, a blue/green deploy means that all users are switched to either the blue or the green version, one being the new version and the other being the old version. If something goes wrong when switching over to the new version, it is very simple to switch back to the old version. Using Istio, this strategy can be refined by gradually shifting users over to the new version, for example, starting with 20% of the users and then slowly increasing the percentage. At all times, it is very easy to route all users back to the old version if a fatal error is revealed in the new version.
As already stated in Chapter 16, it is important to remember that a prerequisite for these types of upgrade strategies is that the upgrade is backward-compatible. Such an upgrade is compatible both in terms of APIs and message formats, which are used to communicate with other services and database structures. If the new version of the microservice requires changes to external APIs, message formats, or database structures that the old version can't handle, these upgrade strategies can't be applied.
We will go through the following deploy scenario:
- We will start by deploying the
v1andv2versions of the microservices, with routing configured to send all requests to thev1version of the microservices. - Next, we will allow a test group to run canary tests; that is, we'll verify the new
v2versions of the microservices. To simplify the tests somewhat, we will only deploy new versions of the core microservices, that is, theproduct,recommendation, andreviewmicroservices. - Finally, we will start to move regular users over to the new versions using a blue/green deploy; initially, a small percentage of users and then, over time, more and more users until, eventually, they are all routed to the new version. We will also see how we can quickly switch back to the
v1version if a fatal error is detected in the newv2version.
Let's first see what changes need to be applied to the source code to be able to deploy and route traffic to two concurrent versions, v1 and v2, of the core microservices.
Source code changes
To be able to run multiple versions of a microservice concurrently, the Deployment objects and their corresponding Pods must have different names, for example, product-v1 and product-v2. There must, however, be only one Kubernetes Service object per microservice. All traffic to a specific microservice always goes through the same Service object, irrespective of what version of the Pod the request will be routed to in the end. To configure the actual routing rules for canary tests and blue/green deployment, Istio's VirtualService and DestinationRule objects are used. Finally, the values.yaml file in the prod-env Helm chart is used to specify the versions of each microservice that will be used in the production environment.
Let's go through the details for each definition in the following subsections:
- Virtual services and destination rules
- Deployments and services
- Tying things together in the
prod-envHelm chart
Virtual services and destination rules
To split the traffic between two versions of a microservice, we need to specify the weight distribution between the two versions in a VirtualService, on the sender side. The virtual service will spread the traffic between two Subsets, called old and new. The exact meaning of the new and old subset is defined in a corresponding DestinationRule, on the receiver side. It uses labels to determine which Pods run the old and new versions of the microservice.
To support canary tests, a routing rule is required in the virtual services that always routes the canary testers to the new subset. To identify canary testers, we will assume that requests from a canary tester contain an HTTP header named X-group with the value test.
A template has been added to the common Helm chart for creating a set of virtual services that can split the traffic between two versions of a microservice. The template is named _istio_vs_green_blue_deploy.yaml and looks like this:
{{- define "common.istio_vs_green_blue_deploy" -}}
{{- range $name := .Values.virtualServices }}
apiVersion: networking.istio.io/v1beta1
kind: VirtualService
metadata:
  name: {{ $name }}
spec:
  hosts:
  - {{ $name }}
  http:
  - match:
    - headers:
        X-group:
          exact: test
    route:
    - destination:
        host: {{ $name }}
        subset: new
  - route:
    - destination:
        host: {{ $name }}
        subset: old
      weight: 100
    - destination:
        host: {{ $name }}
        subset: new
      weight: 0
---
{{- end -}}
{{- end -}}
From the template, we can see the following:
- The
rangedirective loops over the elements defined in thevirtualServicesvariable. - The
hostsfield in thespecpart of the manifest is used to specify the names of the Kubernetes service that thisVirtualServicewill apply to. - In the
httpsection, three routing destinations are declared:- One route matching the canary testers' HTTP header,
X-group, set totest. This route always sends the requests to thenewsubset - One route destination for the
oldsubset and one for thenewsubset - The
weightis specified as a percentage and the sum of the weights will always be 100 - All traffic is initially routed to the
oldsubset
- One route matching the canary testers' HTTP header,
To be able to route canary testers to the new versions based on header-based routing, the product-composite microservice has been updated to forward the HTTP header, X-group. Refer to the getCompositeProduct() method in the se.magnus.microservices.composite.product.services.ProductCompositeServiceImpl class for details.
For the destination rules, we will reuse the template introduced in the Content in the _istio_dr_mutual_tls.yaml template section above. This template will be used by the prod-env Helm chart to specify the versions of the microservices to be used. This is described in the Tying things together in the prod-env Helm chart section below.
Deployments and services
To make it possible for a destination rule to identify the version of a Pod based on its labels, a version label has been added in the template for deployments in the common Helm chart, _deployment.yaml. Its value is set to the tag of the Pod's Docker image. We will use the Docker image tags v1 and v2, so that will also be the value of the version label. The added line looks like this:
version: {{ .Values.image.tag }}
To give the Pods and their Deployment objects names that contain their version, their default names have been overridden in the prod-env chart. In their values.yaml files, the fullnameOverride field is used to specify a name that includes version info. This is done for the three core microservices and looks like this:
product:
  fullnameOverride: product-v1

recommendation:
  fullnameOverride: recommendation-v1

review:
  fullnameOverride: review-v1
An undesired side effect of this is that the corresponding Service objects will also get a name that includes the version info. As explained above, we need to have one service that can route requests to the different versions of the Pods. To avoid this naming problem, the Service template, _service.yaml, in the common Helm chart, is updated to use the common.name template instead of the common.fullname template used previously in Chapter 17.
Finally, to be able to deploy multiple versions of the three core microservices, their Helm charts have been duplicated in the kubernetes/helm/components folder. The name of the new charts is suffixed with -green. The only difference compared to the existing charts is that they don't include the Service template from the common chart, avoiding the creation of two Service objects per core microservice. The new charts are named product-green, recommendation-green, and review-green.
Tying things together in the prod-env Helm chart
The prod-env Helm chart includes the _istio_vs_green_blue_deploy.yaml template from the common Helm chart, as well as the templates included by the dev-env chart; see the Creating the service mesh section.
The three new *-green Helm charts for the core microservices are added as dependencies to the Chart.yaml file.
In its values.yaml file, everything is tied together. From the previous section, we have seen how the v1 versions of the core microservices are defined with names that include version info.
For the v2 versions, the three new *-green Helm charts are used. The values are the same as for the v1 versions except for the name and Docker image tag. For example, the configuration of the v2 version of the product microservice looks like this:
product-green:
  fullnameOverride: product-v2
  image:
    tag: v2
To declare virtual services for the three core microservices, the following declaration is used:
virtualServices:
  - product
  - recommendation
  - review
Finally, the destination rules are declared in a similar way as in the dev-env Helm chart. The main difference is that we now use the subsets to declare the actual versions that should be used when traffic is routed by the virtual services to either the old or the new subset. For example, the destination rule for the product microservice is declared like this:
destinationRules:
  - ...
  - name: product
    subsets:
    - labels:
        version: v1
      name: old
    - labels:
        version: v2
      name: new
...
From the declaration above, we can see that traffic sent to the old subset is directed to v1 Pods of the product microservice and to v2 Pods for the new subset.
For details, see the file in the prod-env chart available in the kubernetes/helm/environments/prod-env folder.
Note that this is where we declare for the production environment what the existing (old) and the coming (new) versions are, v1 and v2 in this scenario. In a future scenario, where it is time to upgrade v2 to v3, the old subset should be updated to use v2 and the new subset should use v3.
Now, we have seen all the changes to the source code and we are ready to deploy v1 and v2 versions of the microservices.
Deploying v1 and v2 versions of the microservices with routing to the v1 version
To be able to test the v1 and v2 versions of the microservices, we need to remove the development environment we have been using earlier in this chapter and create a production environment where we can deploy the v1 and v2 versions of the microservices.
To achieve this, run the following commands:
- Uninstall the development environment:
helm uninstall hands-on-dev-env - To monitor the termination of Pods in the development environment, run the following command until it reports
No resources found in hands-on namespace.:kubectl get pods - Start MySQL, MongoDB, and RabbitMQ outside of Kubernetes:
eval $(minikube docker-env) docker-compose up -d mongodb mysql rabbitmq - Tag Docker images with
v1andv2versions:docker tag hands-on/auth-server hands-on/auth-server:v1 docker tag hands-on/product-composite-service hands-on/product-composite-service:v1 docker tag hands-on/product-service hands-on/product-service:v1 docker tag hands-on/recommendation-service hands-on/recommendation-service:v1 docker tag hands-on/review-service hands-on/review-service:v1 docker tag hands-on/product-service hands-on/product-service:v2 docker tag hands-on/recommendation-service hands-on/recommendation-service:v2 docker tag hands-on/review-service hands-on/review-service:v2The
v1andv2versions of the microservices will be the same versions of the microservices in this test. But it doesn't matter to Istio, so we can use this simplified approach to test Istio's routing capabilities. - Deploy the system landscape using Helm and wait for all deployments to complete:
helm install hands-on-prod-env kubernetes/helm/environments/prod-env -n hands-on --wait - Once the deployment is complete, verify that we have
v1andv2Pods up and running for the three core microservices with the following command:kubectl get pods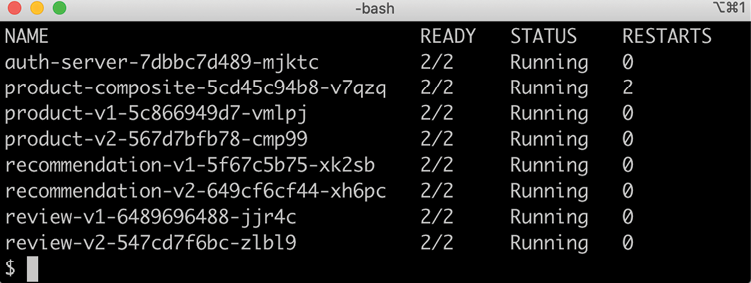
Figure 18.22: v1 and v2 Pods deployed at the same time
- Run the usual tests to verify that everything works:
./test-em-all.bashUnfortunately, the tests will fail initially on an error message like:
- Response Body: Jwks doesn't have key to match kid or alg from JwtThis error is caused by the Istio daemon,
istiod, caching the JWKS from the auth server in the development environment. The auth server in the production environment will have a new JWKS, but the same identity toistiod, so it tries to reuse the old JWKS, causing this failure. Istio caches a JWKS for 20 minutes, so you can simply take a long coffee break and the issue will be gone when you are back. Or you can empty the cache by restartingistioda few times (2 or 3 times should be sufficient). Run the following command to restart theistiodPod:kubectl -n istio-system delete pod -l app=istiodIf the tests still fail once the issue with cached JWKS has disappeared, with errors such as this:
Test FAILED, EXPECTED VALUE: 3, ACTUAL VALUE: 0, WILL ABORTThen simply rerun the command and it should run fine! These errors are secondary failures caused by the original error caused by the JWKS cache.
Expect output that is similar to what we have seen from the previous chapters:
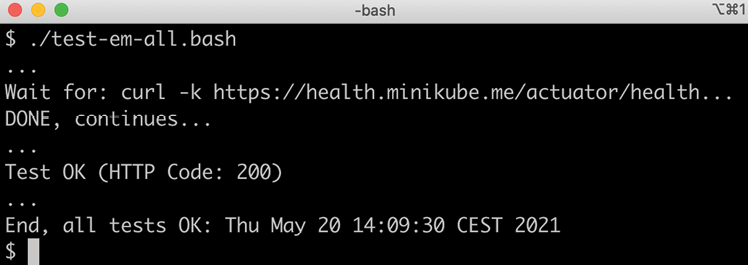
Figure 18.23: Tests run successfully
We are now ready to run some zero-downtime deploy tests. Let's begin by verifying that all traffic goes to the v1 version of the microservices!
Verifying that all traffic initially goes to the v1 version of the microservices
To verify that all requests are routed to the v1 version of the microservices, we will start up the load test tool, siege, and then observe the traffic that flows through the service mesh using Kiali.
Perform the following steps:
- Get a new access token and start the
siegeload test tool, with the following commands:ACCESS_TOKEN=$(curl -k https://writer:[email protected]/oauth2/token -d grant_type=client_credentials -s | jq .access_token -r) echo ACCESS_TOKEN=$ACCESS_TOKEN siege https://minikube.me/product-composite/1 -H "Authorization: Bearer $ACCESS_TOKEN" -c1 -d1 -v - Go to the Graph view in Kiali's web UI (https://kiali.minikube.me):
- Click on the Display menu button and deselect Service Nodes
- Click on the App graph menu button and select Versioned app graph
- Expect only traffic to the v1 version of the microservices, as follows:

Figure 18.24: All requests go to the v1 Pods
This means that, even though the v2 versions of the microservices are deployed, they do not get any traffic routed to them. Let's now try out canary tests where selected test users are allowed to try out the v2 versions of the microservices!
Running canary tests
To run a canary test so that some users are routed to the new versions while all other users are still routed to the old versions of the deployed microservices, we need to add the X-group HTTP header set to the value test in our requests sent to the external API.
To see which version of a microservice served a request, the serviceAddresses field in the response can be inspected. The serviceAddresses field contains the hostname of each service that took part in creating the response. The hostname is equal to the name of the Pod, so we can find the version in the hostname; for example, product-v1-... for a product service of version v1, and product-v2-... for a product service of version v2.
Let's begin by sending a normal request and verifying that it is the v1 versions of the microservices that respond to our request. Next, we'll send a request with the X-group HTTP header set to the value test, and verify that the new v2 versions are responding.
To do this, perform the following steps:
- Perform a normal request to verify that the request is routed to the
v1version of the microservices by usingjqto filter out theserviceAddressesfield in the response:ACCESS_TOKEN=$(curl -k https://writer:[email protected]/oauth2/token -d grant_type=client_credentials -s | jq .access_token -r) echo ACCESS_TOKEN=$ACCESS_TOKEN curl -ks https://minikube.me/product-composite/1 -H "Authorization: Bearer $ACCESS_TOKEN" | jq .serviceAddressesExpect a response along the lines of the following:

Figure 18.25: All requests go to the v1 Pods
As expected, all three core services are
v1versions of the microservices. - If we add the
X-group=testheader, we expect the request to be served byv2versions of the core microservices. Run the following command:curl -ks https://minikube.me/product-composite/1 -H "Authorization: Bearer $ACCESS_TOKEN" -H "X-group: test" | jq .serviceAddressesExpect a response similar to the following:
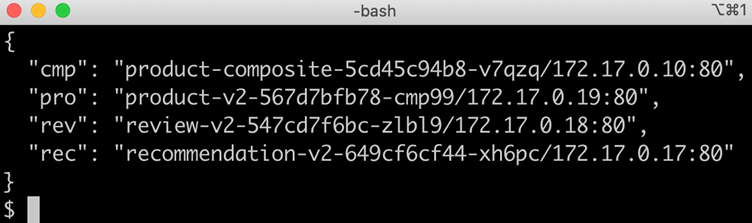
Figure 18.26: Setting HTTP header X-group=test makes the requests go to the v2 Pods
As expected, all three core microservices that respond are now
v2versions; as a canary tester, we are routed to the newv2versions!
Given that the canary tests returned the expected results, we are ready to allow normal users to be routed to the new v2 versions using blue/green deployment.
Running blue/green deployment
To route a portion of the normal users to the new v2 versions of the microservices, we need to modify the weight distribution in the virtual services. They are currently 100/0; in other words, all traffic is routed to the old v1 versions. We can achieve this, as we did before, by editing the manifest files of the virtual services and executing a kubectl apply command to make the changes take effect. As an alternative, we can use the kubectl patch command to change the weight distribution directly on the virtual service objects in the Kubernetes API server.
I find the patch command useful when making a number of changes to the same objects to try something out, for example, to change the weight distribution in the routing rules. In this section, we will use the kubectl patch command to quickly change the weight distribution in the routing rules between the v1 and v2 versions of the microservices. To get the state of a virtual service after a few kubectl patch commands have been executed, a command such as kubectl get vs NNN -o yaml can be issued. For example, to get the state of the virtual service of the product microservice, issue the following command: kubectl get vs product -o yaml.
Since we haven't used the kubectl patch command before and it can be a bit involved to start with, let's undertake a short introduction to see how it works before we perform the green/blue deploy.
A short introduction to the kubectl patch command
The kubectl patch command can be used to update specific fields in an existing object in the Kubernetes API server. We will try the patch command on the virtual service for the review microservice, named review. The relevant parts of the definition for the virtual service, review, appear as follows:
spec:
  http:
  - match:
    ...
  - route:
    - destination:
        host: review
        subset: old
      weight: 100
    - destination:
        host: review
        subset: new
      weight: 0
A sample patch command that changes the weight distribution of the routing to the v1 and v2 Pods in the review microservice appears as follows:
kubectl patch virtualservice review --type=json -p='[
  {"op": "add", "path": "/spec/http/1/route/0/weight", "value": 80},
  {"op": "add", "path": "/spec/http/1/route/1/weight", "value": 20}
]'
The command will configure the routing rules of the review microservice to route 80% of the requests to the old version, and 20% of the requests to the new version.
To specify that the weight value should be changed in the review virtual service, the /spec/http/1/route/0/weight path is given for the old version, and /spec/http/1/route/1/weight for the new version.
The 0 and 1 in the path are used to specify the index of array elements in the definition of the virtual service. For example, http/1 means the second element in the array under the http element. See the definition of the preceding review virtual service.
From the definition, we can see that the first element with index 0 is the match element, which we will not change. The second element is the route element, which we want to change.
Now that we know a bit more about the kubectl patch command, we are ready to test a blue/green deployment.
Performing the blue/green deployment
It is time to gradually move more and more users to the new versions using blue/green deployment. To perform the deployment, run the following steps:
- Ensure that the load test tool,
Siege, is still running.It was started in the preceding Verifying that all traffic initially goes to the v1 version of the microservices section.
- To allow 20% of users to be routed to the new
v2version of the review microservice, we can patch the virtual service and change weights with the following command:kubectl patch virtualservice review --type=json -p='[ {"op": "add", "path": "/spec/http/1/route/0/weight", "value": 80}, {"op": "add", "path": "/spec/http/1/route/1/weight", "value": 20} ]' - To observe the change in the routing rule, go to the Kiali web UI (https://kiali.minikube.me) and select the Graph view.
- Click on the Display menu and change the edge labels to Requests Distribution.
- Wait for a minute before the metrics are updated in Kiali so that we can observe the change. Expect the graph in Kiali to show something like the following:
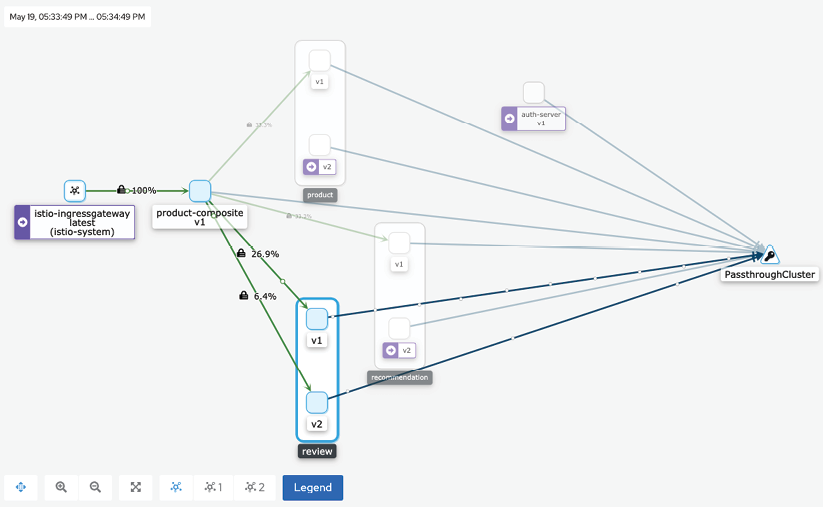
Figure 18.27: 80% goes to v1 services and 20% goes to v2 services
Depending on how long you have waited, the graph might look a bit different! In the screenshot, we can see that Istio now routes traffic to both the v1 and v2 versions of the review microservice.
Of the 33% of the traffic that is sent to the review microservice from the product-composite microservice, 6.4% is routed to the new v2 Pod, and 26.9% to the old v1 Pod. This means that 6.4/33 = 19% of the requests are routed to the v2 Pod, and 26.9/33 = 81% to the v1 Pod. This is in line with the 20/80 distribution we have requested.
Please feel free to try out the preceding kubectl patch command to affect the routing rules for the other core microservices, product and recommendation.
To simplifying changing the weight distribution for all three core microservices, the./kubernetes/routing-tests/split-traffic-between-old-and-new-services.bash script can be used. For example, to route all traffic to the v2 version of all microservices, run the following script, feeding it with the weight distribution 0 100:
./kubernetes/routing-tests/split-traffic-between-old-and-new-services.bash 0 100
You have to give Kiali a minute or two to collect metrics before it can visualize the changes in routing, but remember that the change in the actual routing is immediate!
Expect that requests are routed only to the v2 versions of the microservices in the graph after a while:

Figure 18.28: All traffic goes to v2 services
Depending on how long you have waited, the graph might look a bit different!
If something goes terribly wrong following the upgrade to v2, the following command can be executed to revert all traffic back to the v1 version of all microservices:
./kubernetes/routing-tests/split-traffic-between-old-and-new-services.bash 100 0
After a short while, the graph in Kiali should look like the screenshot in the previous Verifying that all traffic initially goes to the v1 version of the microservices section, showing all requests going to the v1 version of all microservices again.
This concludes the introduction to the service mesh concept and Istio as an implementation of it.
Before we wrap up the chapter, let's recap how we can run tests in Docker Compose to ensure that the source code of our microservices does not rely on either the deployment in Kubernetes or the presence of Istio.
Running tests with Docker Compose
As mentioned a few times now, it is important to ensure that the source code of the microservices doesn't become dependent on a platform such as Kubernetes or Istio from a functional perspective.
To verify that the microservices work as expected without the presence of Kubernetes and Istio, run the tests as described in Chapter 17 (refer to the Testing with Docker Compose section). Since the default values of the test script, test-em-all.bash, have been changed, as described previously in the Running commands to create the service mesh section, the following parameters must be set when using Docker Compose: USE_K8S=false HOST=localhost PORT=8443 HEALTH_URL=https://localhost:8443. For example, to run the tests using the default Docker Compose file, docker-compose.yml, run the following command:
USE_K8S=false HOST=localhost PORT=8443 HEALTH_URL=https://localhost:8443 ./test-em-all.bash start stop
The test script should, as before, begin by starting all containers; it should then run the tests, and, finally, stop all containers. For details of the expected output, see Chapter 17 (refer to the Verifying that the microservices work without Kubernetes section).
After successfully executing the tests using Docker Compose, we have verified that the microservices are dependent on neither Kubernetes nor Istio from a functional perspective. These tests conclude the chapter on using Istio as a service mesh.
Summary
In this chapter, we learned about the service mesh concept and Istio, an open source implementation of the concept. A service mesh provides capabilities for handling challenges in a system landscape of microservices in areas such as security, policy enforcement, resilience, and traffic management. A service mesh can also be used to make a system landscape of microservices observable by visualizing the traffic that flows through the microservices.
For observability, Istio can be integrated with Kiali, Jaeger, and Grafana (more on Grafana and Prometheus in Chapter 20, Monitoring Microservices). When it comes to security, Istio can be configured to use a certificate to protect external APIs with HTTPS and require that external requests contain valid JWT-based OAuth 2.0/OIDC access tokens. Finally, Istio can be configured to automatically protect internal communication using mutual authentication (mTLS).
For resilience and robustness, Istio comes with mechanisms for handling retries, timeouts, and an outlier detection mechanism similar to a circuit breaker. In many cases, it is preferable to implement these resilience capabilities in the source code of the microservices, if possible. The ability in Istio to inject faults and delays is very useful for verifying that the microservices in the service mesh work together as a resilient and robust system landscape. Istio can also be used to handle zero-downtime deployments. Using its fine-grained routing rules, both canary and blue/green deployments can be performed.
One important area that we haven't covered yet is how to collect and analyze log files created by all microservice instances. In the next chapter, we will see how this can be done using a popular stack of tools, known as the EFK stack, based on Elasticsearch, Fluentd, and Kibana.
Questions
- What is the purpose of a proxy component in a service mesh?
- What's the difference between a control plane and a data plane in a service mesh?
- What is the
istioctl kube-injectcommand used for? - What is the
minikube tunnelcommand used for? - What tools are Istio integrated with for observability?
- What configuration is required to make Istio protect communication within the service mesh using mutual authentication?
- What can the
abortanddelayelements in a virtual service be used for? - What configuration is required to set up a blue/green deploy scenario?