
20
Monitoring Microservices
In this chapter, we will learn how to use Prometheus and Grafana to collect, monitor, and alert about performance metrics. As we mentioned in Chapter 1, Introduction to Microservices, in a production environment it is crucial to be able to collect metrics for application performance and hardware resource usage. Monitoring these metrics is required to avoid long response times or outages for API requests and other processes.
To be able to monitor a system landscape of microservices in a cost-efficient and proactive way, we must also be able to define alarms that are triggered automatically if the metrics exceed the configured limits.
In this chapter, we will cover the following topics:
- Introduction to performance monitoring using Prometheus and Grafana
- Changes in source code for collecting application metrics
- Building and deploying the microservices
- Monitoring microservices using Grafana dashboards
- Setting up alarms in Grafana
Technical requirements
For instructions on how to install the tools used in this book and how to access the source code for this book, see:
- Chapter 21 for macOS
- Chapter 22 for Windows
The code examples in this chapter all come from the source code in $BOOK_HOME/Chapter19.
If you want to view the changes applied to the source code in this chapter so that you can use Prometheus and Grafana to monitor and alert on performance metrics, you can compare it with the source code for Chapter 19, Centralized Logging with the EFK Stack. You can use your favorite diff tool and compare the two folders, $BOOK_HOME/Chapter19 and $BOOK_HOME/Chapter20.
Introduction to performance monitoring using Prometheus and Grafana
In this chapter, we will reuse the deployment of Prometheus and Grafana that we created in Chapter 18, Using a Service Mesh to Improve Observability and Management, in the Deploying Istio in a Kubernetes cluster section. Also in that chapter, we were briefly introduced to Prometheus, a popular open source database for collecting and storing time series data such as performance metrics. We learned about Grafana, an open source tool for visualizing performance metrics. With the Grafana deployment comes a set of Istio-specific dashboards. Kiali can also render some performance-related graphs without the use of Grafana. In this chapter, we will get some hands-on experience with these tools.
The Istio configuration we deployed in Chapter 18 includes a configuration of Prometheus, which automatically collects metrics from Pods in Kubernetes. All we need to do is set up an endpoint in our microservice that produces metrics in a format Prometheus can consume. We also need to add annotations to the Kubernetes Pods so that Prometheus can find the address of these endpoints. See the Changes in source code for collecting application metrics section of this chapter for details on how to set this up. To demonstrate Grafana's capabilities to raise alerts, we will also deploy a local mail server.
The following diagram illustrates the relationship between the runtime components we just discussed:
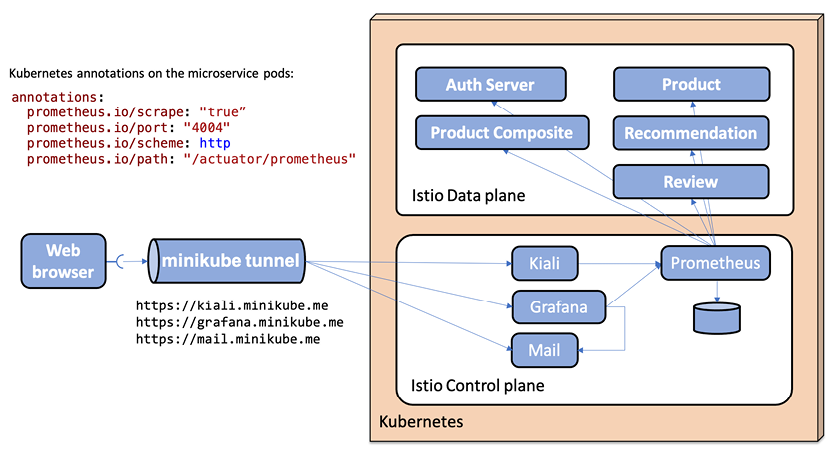
Figure 20.1: Adding Prometheus and Grafana to the system landscape
Here, we can see how Prometheus uses the annotations in the definitions of the Kubernetes Pods to be able to collect metrics from our microservices. It then stores these metrics in its database. A user can access the web UIs of Kiali and Grafana to monitor these metrics in a Web browser. The Web browser uses the minikube tunnel that was introduced in Chapter 18, in the Setting up access to Istio services section, to access Kiali, Grafana, and also a web page from the mail server to see alerts sent out by Grafana.
Please remember that the configuration that was used for deploying Istio from Chapter 18 is only intended for development and test, not production. For example, performance metrics stored in the Prometheus database will not survive the Prometheus Pod being restarted!
In the next section, we will look at what changes have been applied to the source code to make the microservices produce performance metrics that Prometheus can collect.
Changes in source code for collecting application metrics
Spring Boot 2 supports producing performance metrics in a Prometheus format using the Micrometer library (https://micrometer.io). There's only one change we need to make to the source code of the microservices: we need to add a dependency on the Micrometer library, micrometer-registry-prometheus, in the Gradle build files, build.gradle. The dependency looks like this:
implementation 'io.micrometer:micrometer-registry-prometheus'
This will make the microservices produce Prometheus metrics on port 4004 using the /actuator/Prometheus URI.
In Chapter 18, we separated the management port, used by the actuator, from the port serving requests to APIs exposed by a microservice. See the Observing the service mesh section for a recap, if required.
To let Prometheus know about these endpoints, each microservice's Pod is annotated with the following code:
annotations:
  prometheus.io/scrape: "true"
  prometheus.io/port: "4004"
  prometheus.io/scheme: http
  prometheus.io/path: "/actuator/prometheus"
This is added to the values.yaml file of each component's Helm chart. See kubernetes/helm/components.
To make it easier to identify the source of the metrics once they have been collected by Prometheus, they are tagged with the name of the microservice that produced the metric. This is achieved by adding the following configuration to the common configuration file, config-repo/application.yml:
management.metrics.tags.application: ${spring.application.name}
This will result in each metric that's produced having an extra label named application. It will contain the value of the standard Spring property for the name of a microservice, spring.application.name.
These are all the changes that are required to prepare the microservices to produce performance metrics and to make Prometheus aware of what endpoints to use to start collecting them. In the next section, we will build and deploy the microservices.
Building and deploying the microservices
Building, deploying, and verifying the deployment using the test-em-all.bash test script is done in the same way it was done in Chapter 19, Centralized Logging with the EFK Stack, in the Building and deploying the microservices section. Run the following commands:
- Build the Docker images from the source with the following commands:
cd $BOOK_HOME/Chapter20 eval $(minikube docker-env) ./gradlew build && docker-compose build - Recreate the Namespace,
hands-on, and set it as the default Namespace:kubectl delete namespace hands-on kubectl apply -f kubernetes/hands-on-namespace.yml kubectl config set-context $(kubectl config current-context) --namespace=hands-on - Resolve the Helm chart dependencies with the following commands.
First, we update the dependencies in the
componentsfolder:for f in kubernetes/helm/components/*; do helm dep up $f; doneNext, we update the dependencies in the
environmentsfolder:for f in kubernetes/helm/environments/*; do helm dep up $f; done - Deploy the system landscape using Helm and wait for all deployments to complete:
helm install hands-on-dev-env kubernetes/helm/environments/dev-env -n hands-on --wait - Start the Minikube tunnel, if it's not already running, as follows (see Chapter 18, the Setting up access to Istio services section, for a recap if you need one):
minikube tunnelRemember that this command requires that your user has sudo privileges and that you enter your password during startup and shutdown. It takes a couple of seconds before the command asks for the password, so it is easy to miss!
- Run the normal tests to verify the deployment with the following command:
./test-em-all.bashExpect the output to be similar to what we've seen in the previous chapters:
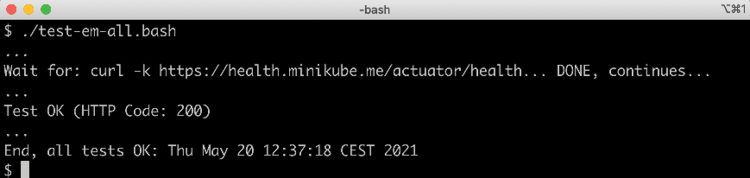
Figure 20.2: All tests OK
With the microservices deployed, we can move on and start monitoring our microservices using Grafana!
Monitoring microservices using Grafana dashboards
As we already mentioned in the introduction, Kiali provides some very useful dashboards out of the box. In general, they are focused on application-level performance metrics such as requests per second, response times, and fault percentages for processing requests. As we will see shortly, they are very useful on an application level. But if we want to understand the usage of the underlying hardware resources, we need more detailed metrics, for example, Java VM-related metrics.
Grafana has an active community that, among other things, shares reusable dashboards. We will try out a dashboard from the community that's tailored for getting a lot of valuable Java VM-related metrics from a Spring Boot 2 application such as our microservices. Finally, we will see how we can build our own dashboards in Grafana. But let's start by exploring the dashboards that come out of the box in Kiali and Grafana.
Before we do that, we need to make two preparations:
- Install a local mail server for tests and configure Grafana to be able to send alert emails to it. We will use the mail server in the section Setting up alarms in Grafana.
- To be able to monitor some metrics, we will start the load test tool we used in previous chapters.
Installing a local mail server for tests
In this section, we will set up a local test mail server and configure Grafana to send alert emails to the mail server.
Grafana can send emails to any SMTP mail server but, to keep the tests local, we will deploy a test mail server named maildev. Go through the following steps:
- Install the test mail server in Istio's Namespace with the following commands:
kubectl -n istio-system create deployment mail-server --image maildev/maildev:1.1.0 kubectl -n istio-system expose deployment mail-server --port=80,25 --type=ClusterIP kubectl -n istio-system wait --timeout=60s --for=condition=ready pod -l app=mail-server - To make the mail server's web UI available from the outside of Minikube, a set of
Gateway,VirtualService, andDestinationRulemanifest files has been added for the mail server in Istio's Helm chart. See the templatekubernetes/helm/environments/istio-system/templates/expose-mail.yml. Run ahelm upgradecommand to apply the new manifest files:helm upgrade istio-hands-on-addons kubernetes/helm/environments/istio-system -n istio-system - Verify that the test mail server is up and running by visiting its web page at https://mail.minikube.me. Expect a web page such as the following to be rendered:
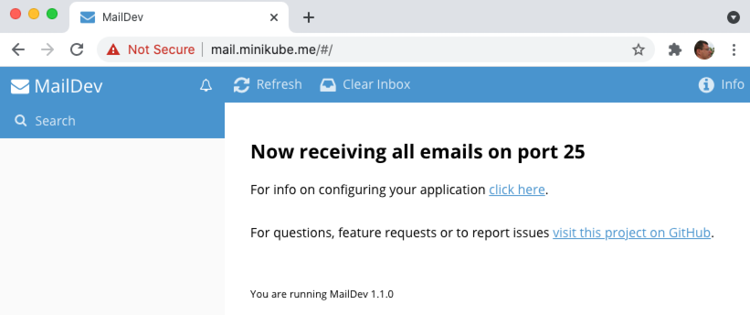
Figure 20.3: Mail server web page
- Configure Grafana to send emails to the test mail server by setting up a few environment variables. Run the following commands:
kubectl -n istio-system set env deployment/grafana
    GF_SMTP_ENABLED=true
    GF_SMTP_SKIP_VERIFY=true
    GF_SMTP_HOST=mail-server:25
    [email protected]
kubectl -n istio-system wait --timeout=60s --for=condition=ready pod -l app=Grafana
The
ENABLEvariable is used to allow Grafana to send emails. TheSKIP_VERIFYvariable is used to tell Grafana to skip SSL checks with the test mail server. TheHOSTvariable points to our mail server and theFROM_ADDRESSvariable specifies what "from" address to use in the mail.
For more information on the mail server, see https://hub.docker.com/r/maildev/maildev.
Now, we have a test mail server up and running and Grafana has been configured to send emails to it. In the next section, we will start the load test tool.
Starting up the load test
To have something to monitor, let's start up the load test using Siege, which we used in previous chapters. Run the following commands to get an access token and then start up the load test, using the access token for authorization:
ACCESS_TOKEN=$(curl -k https://writer:[email protected]/oauth2/token -d grant_type=client_credentials -s | jq .access_token -r)

echo ACCESS_TOKEN=$ACCESS_TOKEN

siege https://minikube.me/product-composite/1 -H "Authorization: Bearer $ACCESS_TOKEN" -c1 -d1 -v
Remember that an access token is only valid for 1 hour – after that, you need to get a new one.
Now, we are ready to learn about the dashboards in Kiali and Grafana and explore the Grafana dashboards that come with Istio.
Using Kiali's built-in dashboards
In Chapter 18, we learned about Kiali, but we skipped the part where Kiali shows performance metrics. Now, it's time to get back to that subject!
Execute the following steps to learn about Kiali's built-in dashboards:
- Open the Kiali web UI in a web browser using the https://kiali.minikube.me URL. Log in with
admin/adminif required. - To see our deployments, go to the workloads page by clicking on the Workloads tab from the menu on the left-hand side.
- Select the product-composite deployment by clicking on it.
- On the product-composite page, select the Outbound Metrics tab. You will see a page like the following screenshot:
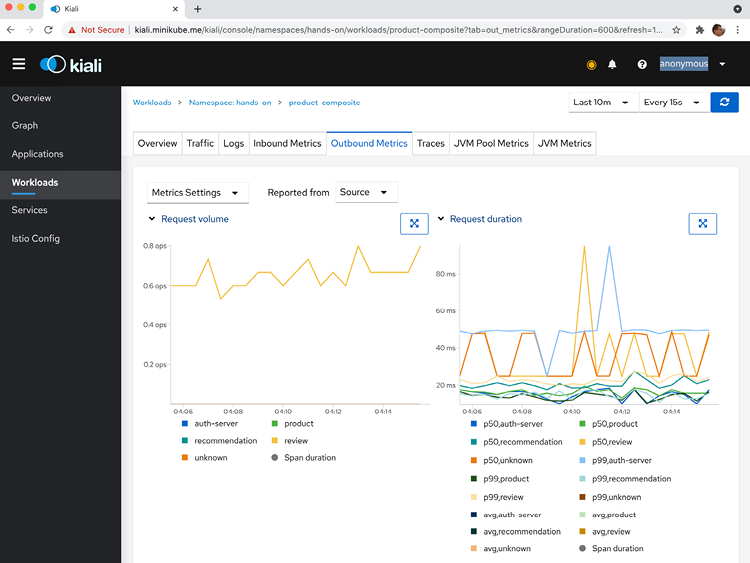
Figure 20.4: Kiali outbound metrics
Kiali will visualize some overall performance graphs that are of great value, and there are more graphs to explore. Feel free to try them out on your own!
- However, far more detailed performance metrics are available in Grafana. Open the Grafana web UI in a web browser using the https://grafana.minikube.me URL.
- You will be presented with a welcome page with the text Welcome to Grafana. Over the welcome text is a Home link; click on it and you will be presented with an overview of available dashboards. You will see a folder named Istio that contains the dashboards that were installed when Grafana was deployed together with Istio in Chapter 18. Click on the folder to expand it and select the dashboard named Istio Mesh Dashboard. Expect a web page like the following:
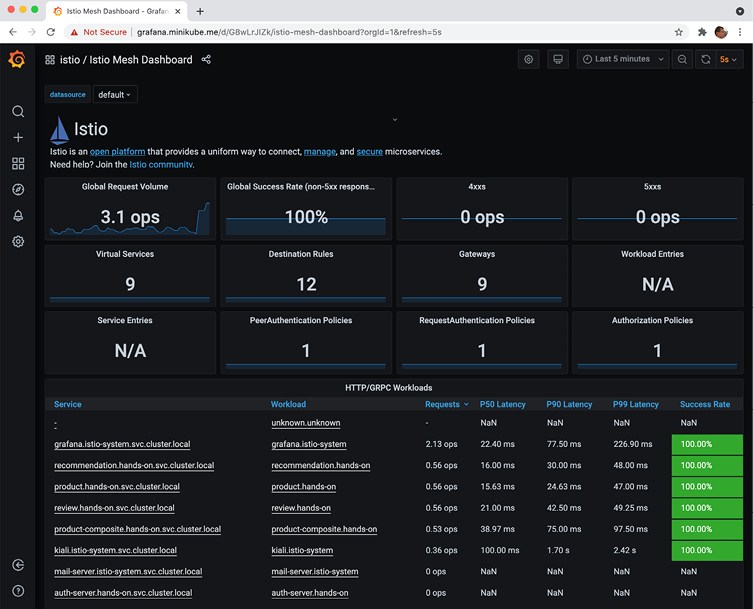
Figure 20.5: Grafana showing Istio Mesh Dashboard
This dashboard gives a very good overview of metrics for the microservices involved in the service mesh, like request rates, response times, and the success rates.
- There are a lot of detailed performance metrics available; click on the product-composite service to see some of them. A dashboard named Istio Service Dashboard should be displayed with the product composite service preselected. It contains three rows containing panels with metrics. Expand the first row named General to get an overview of the service.
The web page should look like the following screenshot:
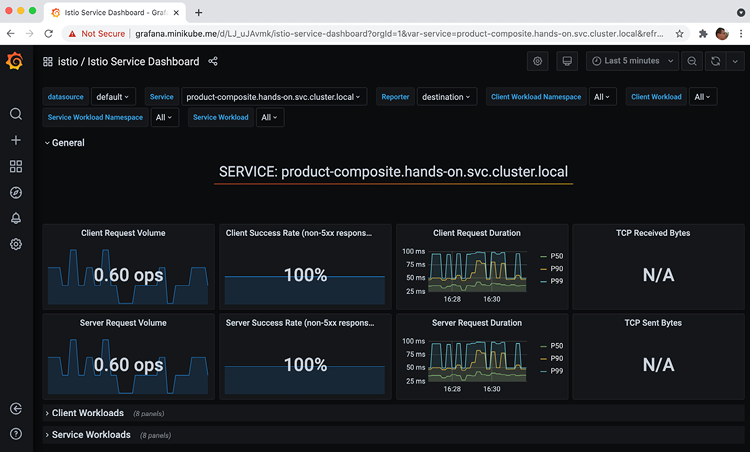
Figure 20.6: Grafana with a lot of metrics for a microservice
Expand the two remaining rows to see more detailed metrics regarding the selected service. Feel free to look around!
- Go back to the list of dashboards provided by Istio and explore the metrics they provide. To get back to the list of available dashboards, click on the Dashboard icon (four squares) in the menu on the left side.
As we've already mentioned, the Istio dashboards give a very good overview at an application level. But there is also a need for monitoring the metrics for hardware usage per microservice. In the next section, we will learn about how existing dashboards can be imported – specifically, a dashboard showing Java VM metrics for a Spring Boot 2-based application.
Importing existing Grafana dashboards
As we've already mentioned, Grafana has an active community that shares reusable dashboards. They can be explored at https://grafana.com/grafana/dashboards. We will try out a dashboard called JVM (Micrometer) - Kubernetes - Prometheus by Istio that's tailored for getting a lot of valuable JVM-related metrics from Spring Boot 2 applications in a Kubernetes environment. The link to the dashboard is https://grafana.com/grafana/dashboards/11955. Perform the following steps to import this dashboard:
- Import the dashboard named JVM (Micrometer) by following these steps:
- On the Grafana web page, click on the Create icon (a + sign) in the left-hand side menu and then select Import.
- On the Import page, paste the dashboard ID
11955into the Import via grafana.com field and click on the Load button next to it. - On the Import page that will be displayed, click on the Prometheus drop-down menu and select the Prometheus data source.
- Now, by clicking on the Import button, the JVM (Micrometer) dashboard will be imported and rendered.
- Inspect the JVM (Micrometer) dashboard by following these steps:
- To get a good view of the metrics, use the time picker (in the top-right corner) to select Last 5 minutes and select a refresh rate of 5s in the dropdown to the right.
- In the Application drop-down menu, which can be found at the top-left of the page, select the product-composite microservice.
- Since we are running a load test using Siege in the background, we will see a lot of metrics. The following is a sample screenshot:
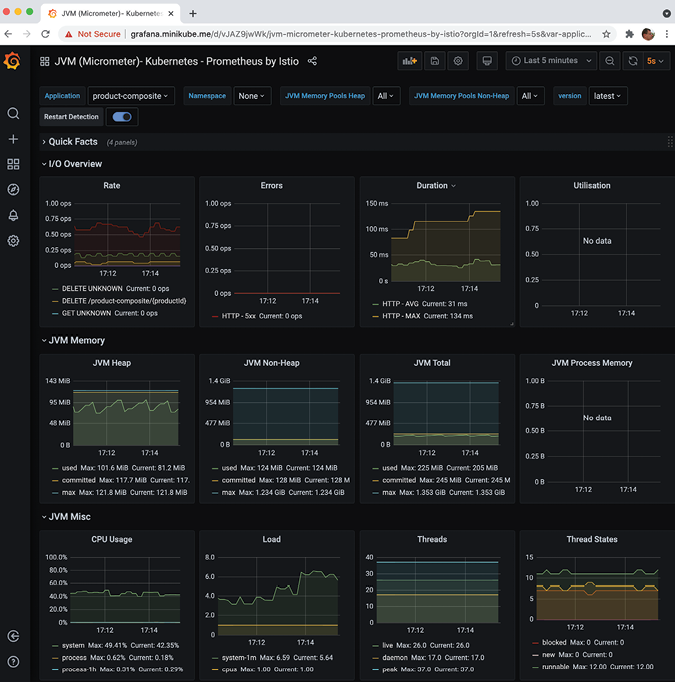
Figure 20.7: Grafana showing Java VM metrics
In this dashboard, we can find all types of Java VM relevant metrics for, among other things, CPU, memory, heap, and I/O usage, as well as HTTP-related metrics such as requests/second, average duration, and error rates. Feel free to explore these metrics on your own!
Being able to import existing dashboards is of great value when we want to get started quickly. However, what's even more important is to know how to create our own dashboard. We will learn about this in the next section.
Developing your own Grafana dashboards
Getting started with developing Grafana dashboards is straightforward. The important thing for us to understand is what metrics Prometheus makes available for us.
In this section, we will learn how to examine the available metrics. Based on these, we will create a dashboard that can be used to monitor some of the more interesting metrics.
Examining Prometheus metrics
In the Changes in source code for collecting application metrics section earlier, we configured Prometheus to collect metrics from our microservices. We can make a call to the same endpoint and see what metrics Prometheus collects. Run the following command:
curl https://health.minikube.me/actuator/prometheus -ks
Expect a lot of output from the command, as in the following example:
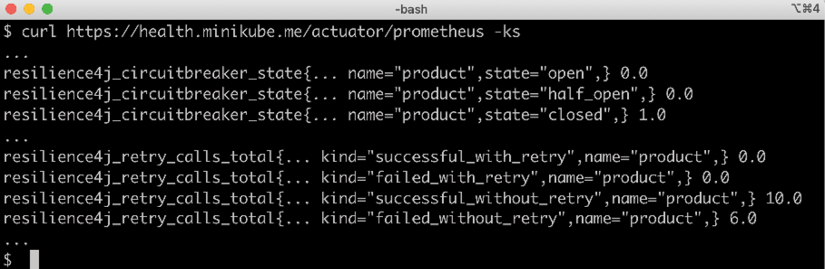
Figure 20.8: Prometheus metrics
Among all of the metrics that are reported, there are two very interesting ones:
resilience4j_circuitbreaker_state: Resilience4j reports on the state of the circuit breaker.resilience4j_retry_calls: Resilience4j reports on how the retry mechanism operates. It reports four different values for successful and failed requests, combined with and without retries.
Note that the metrics have a label named application, which contains the name of the microservice. This field comes from the configuration of the management.metrics.tags.application property, which we did in the Changes in source code for collecting application metrics section.
These metrics seem interesting to monitor. None of the dashboards we have used so far use metrics from Resilience4j. In the next section, we will create a dashboard for these metrics.
Creating the dashboard
In this section, we will learn how to create a dashboard that visualizes the Resilience4j metrics we described in the previous section.
We will set up the dashboard in the following stages:
- Creating an empty dashboard
- Creating a new panel for the circuit breaker metric
- Creating a new panel for the retry metric
- Arranging the panels
Creating an empty dashboard
Perform the following steps to create an empty dashboard:
- On the Grafana web page, click on the + sign in the left-hand menu and then select Dashboard.
- A web page named New dashboard will be displayed:
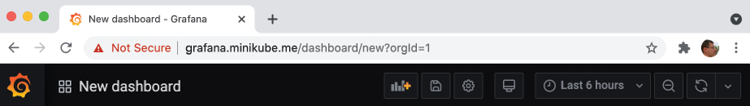
Figure 20.9: Creating a new dashboard in Grafana
- Click on the Dashboard settings button (it has a gear as its icon), in the menu shown in the preceding screenshot. Then, follow these steps:
- Specify the name of the dashboard in the Name field and set the value to
Hands-on Dashboard. - Click on the top-left back button on the web page (not to be mixed up with the web browser's back button).
- Specify the name of the dashboard in the Name field and set the value to
- Click on the time picker and select Last 5 minutes as the range.
- Click on the refresh rate icon to the right and specify 5s as the refresh rate.
Creating a new panel for the circuit breaker metric
Perform the following steps to create a new panel for the circuit breaker metric:
- Click on the + Add new panel button.
A page will be displayed where the new panel can be configured.
- To the right, in the tab named Panel, set the Panel title to
Circuit Breaker. - In the bottom-left Query panel, under the letter A, specify the query as the name of the circuit breaker metric for the closed state, that is,
resilience4j_circuitbreaker_state{state="closed"}. - In the Legend field, specify the value
{{state}}. This will create a legend in the panel where the involved microservices will be labeled with their name and Namespace.The filled-in values should look as follows:
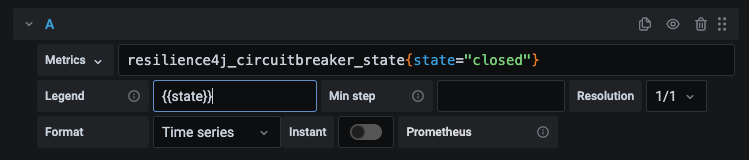
Figure 20.10: Specifying circuit breaker metrics in Grafana
- Click on the + Query button below to enter a new query under B for the open state. Set the query field to
resilience4j_circuitbreaker_state{state="open"}and the Legend field to{{state}}. - Click on the + Query button a final time to enter a new query under C for the half_open state. Set the query field to
resilience4j_circuitbreaker_state{state="half_open"}and the Legend field to{{state}}. - Click on the back button at the top left of the page to get back to the dashboard.
Creating a new panel for the retry metric
Here, we will repeat the same procedure that we went through for adding a panel for the preceding circuit breaker metric, but instead, we will specify the values for the retry metrics:
- Create a new panel by clicking on the Add panel icon (a chart with a plus sign) in the top-level menu and click on Add new panel in the new panel.
- Specify
Retryas the Panel title. - In the query field, under A, specify
rate(resilience4j_retry_calls_total[30s]).Since the retry metric is a counter, its value will only go up. An ever-increasing metric is rather uninteresting to monitor. The rate function is used to convert the retry metric into a rate per second metric. The time window specified, that is,
30 s, is used by the rate function to calculate the average values of the rate. - For the Legend, specify
{{kind}}.Just like the output for the preceding Prometheus endpoint, we will get four metrics for the retry mechanism. To separate them in the legend, the
kindattribute needs to be added. - Note that Grafana immediately starts to render a graph in the panel editor based on the specified values.
- Click on the back button to get back to the dashboard.
Arranging the panels
Perform the following steps to arrange the panels on the dashboard:
- You can resize a panel by dragging its lower right-hand corner to the preferred size.
- You can also move a panel by dragging its header to the desired position.
The following is an example layout of the two panels:
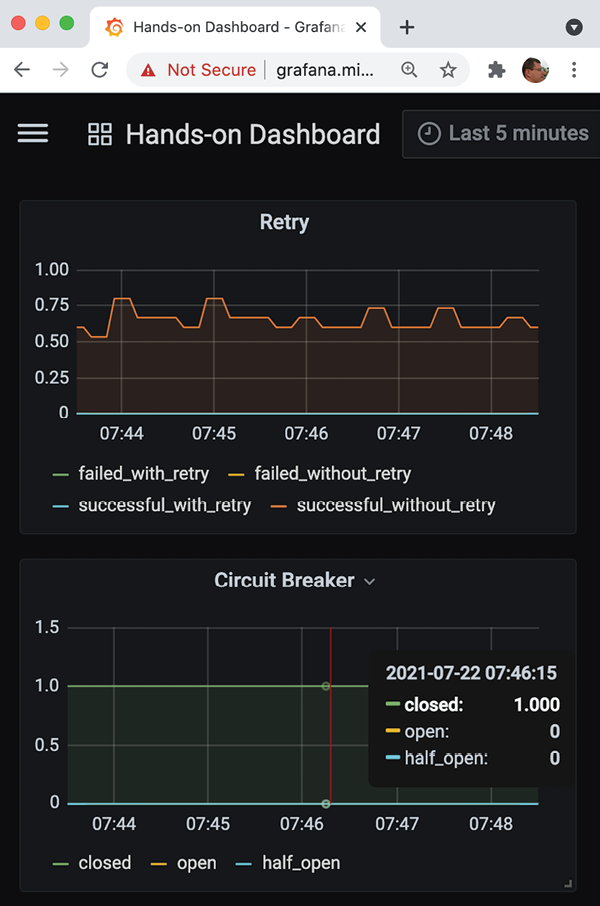
Figure 20.11: Moving and resizing a panel in Grafana
Since this screenshot was taken with Siege running in the background, the Retry panel reports successful_without_retry metrics while the Circuit Breaker reports that closed=1, while open and half_open=0, meaning that it is closed and operating normally (something that is about to change in the next section).
- Finally, click on the Save button at the top of the page. A Save dashboard as... dialog will show up; ensure that the name is Hands-on Dashboard and hit the Save button.
With the dashboard created, we are ready to try it out. In the next section, we will try out both metrics.
Trying out the new dashboard
Before we start testing the new dashboard, we must stop the load test tool, Siege. For this, go to the command window where Siege is running and press Ctrl + C to stop it.
Let's start by testing how to monitor the circuit breaker. Afterward, we will try out the retry metrics.
Testing the circuit breaker metrics
If we force the circuit breaker to open up, its state will change from closed to open, and then eventually to the half-open state. This should be reported in the circuit breaker panel.
Open the circuit, just like we did in Chapter 13, Improving Resilience Using Resilience4j, in the Trying out the circuit breaker and retry mechanism section; that is, make some requests to the API in a row, all of which will fail. Run the following commands:
ACCESS_TOKEN=$(curl -k https://writer:[email protected]/oauth2/token -d grant_type=client_credentials -s | jq .access_token -r)

echo ACCESS_TOKEN=$ACCESS_TOKEN

for ((n=0; n<4; n++)); do curl -o /dev/null -skL -w "%{http_code}
" https://minikube.me/product-composite/1?delay=3 -H "Authorization: Bearer $ACCESS_TOKEN" -s; done
We can expect three 500 responses and a final 200, indicating three errors in a row, which is what it takes to open the circuit breaker. The last 200 indicates a fail-fast response from the product-composite microservice when it detects that the circuit is open.
On some rare occasions, I have noticed that the circuit breaker metrics are not reported in Grafana directly after the dashboard is created. If they don't show up after a minute, simply rerun the preceding command to reopen the circuit breaker again.
Expect the value for the closed state to drop to 0 and the open state to take the value 1, meaning that the circuit is now open. After 10s, the circuit will turn to the half-open state, indicated by the half-open metrics having the value 1 and open being set to 0. This means that the circuit breaker is ready to test some requests to see if the problem that opened the circuit is gone.
Close the circuit breaker again by issuing three successful requests to the API with the following command:
for ((n=0; n<4; n++)); do curl -o /dev/null -skL -w "%{http_code}
" https://minikube.me/product-composite/1?delay=0 -H "Authorization: Bearer $ACCESS_TOKEN" -s; done
We will get only 200 responses. Note that the circuit breaker metric goes back to normal again, meaning that the closed metric goes back to 1.
After this test, the Grafana dashboard should look as follows:
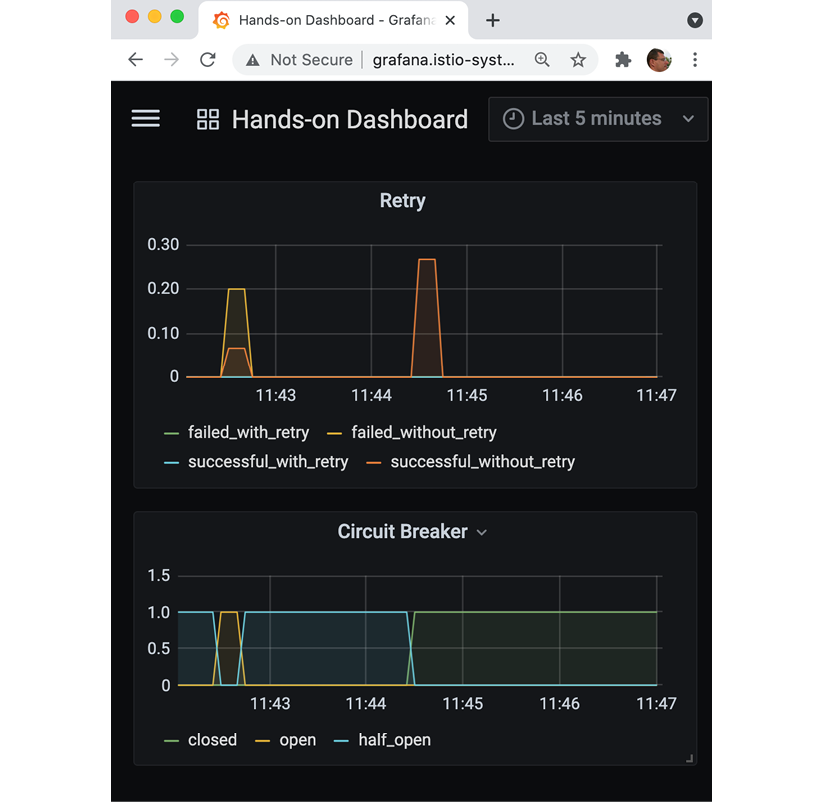
Figure 20.12: Retries and Circuit Breaker in action as viewed in Grafana
From the preceding screenshot, we can see that the retry mechanism also reports metrics that succeeded and failed. When the circuit was opened, all requests failed without retries. When the circuit was closed, all requests were successful without any retries. This is as expected.
Now that we have seen the circuit breaker metrics in action, let's see the retry metrics in action!
If you want to check the state of the circuit breaker, you can do it with the following command:
curl -ks https://health.minikube.me/actuator/health | jq -r .components.circuitBreakers.details.product.details.state
It should report CLOSED, OPEN, or HALF_OPEN, depending on its state.
Testing the retry metrics
To trigger the retry mechanism, we will use the faultPercentage parameter we used in previous chapters. To avoid triggering the circuit breaker, we need to use relatively low values for the parameter. Run the following command:
while true; do curl -o /dev/null -s -L -w "%{http_code}
" -H "Authorization: Bearer $ACCESS_TOKEN" -k https://minikube.me/product-composite/1?faultPercent=10; sleep 3; done
This command will call the API once every third second. It specifies that 10% of the requests should fail so that the retry mechanism will kick in and retry the failed requests.
After a few minutes, the dashboard should report metrics such as the following:
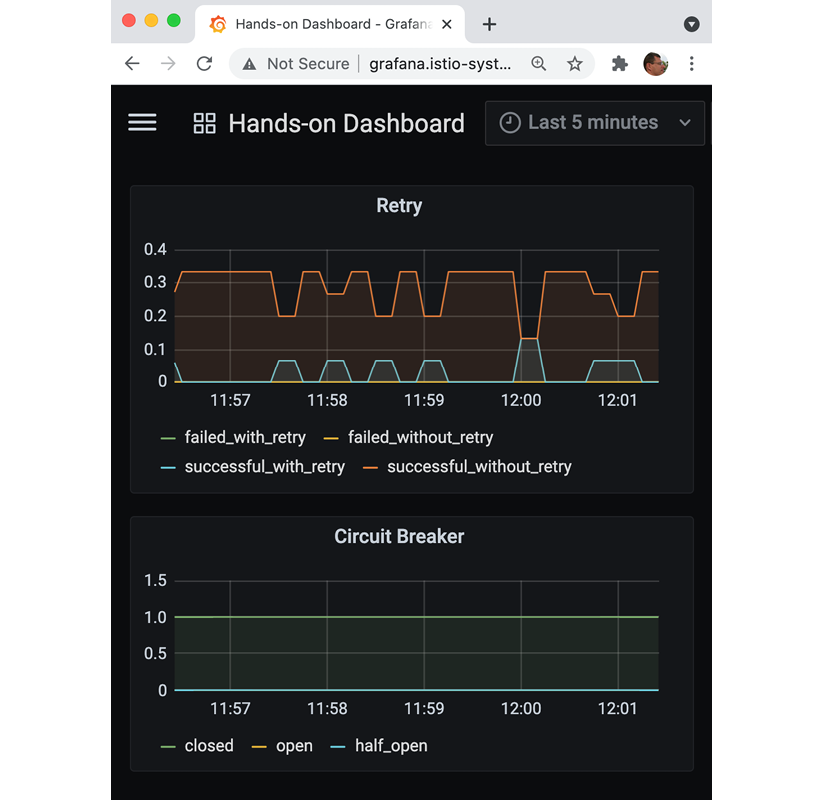
Figure 20.13: Result of retry tests viewed in Grafana
In the preceding screenshot, we can see that most of the requests have been executed successfully, without any retries. Approximately 10% of the requests have been retried by the retry mechanism and successfully executed after the retry.
Before we leave the section on creating dashboards, we will learn how we can export and import dashboards.
Exporting and importing Grafana dashboards
Once a dashboard has been created, we typically want to take two actions:
- Save the definition of the dashboard as source code in a Git repo
- Move the dashboard to other Grafana instances, for example, those used in QA and production environments
To perform these actions, we can use Grafana's API for exporting and importing dashboards. Since we only have one Grafana instance, we will perform the following steps:
- Export the dashboard to a JSON file
- Delete the dashboard
- Import the dashboard from the JSON file
Before we perform these steps, we need to understand the two different types of IDs that a dashboard has:
id, an auto-incremented identifier that is unique only within a Grafana instance.uid, a unique identifier that can be used in multiple Grafana instances. It is part of the URL when accessing dashboards, meaning that links to a dashboard will stay the same as long as theuidof a dashboard remains the same. When a dashboard is created, a randomuidis created by Grafana.
When we import a dashboard, Grafana will try to update a dashboard if the id field is set. To be able to test importing a dashboard in a Grafana instance that doesn't have the dashboard already installed, we need to set the id field to null.
Perform the following actions to export and then import your dashboard:
- Identify the
uidof your dashboard.The
uidvalue can be found in the URL in the web browser where the dashboard is shown. It will look like this:https://grafana.minikube.me/d/YMcDoBg7k/hands-on-dashboard - The
uidin the URL above isYMcDoBg7k. In a terminal window, create a variable with its value. In my case, it will be:ID=YMcDoBg7k - Export the dashboard to a JSON file with the following command:
curl -sk https://grafana.minikube.me/api/dashboards/uid/$ID | jq '.dashboard.id=null' > "Hands-on-Dashboard.json"The
curlcommand exports the dashboard to JSON format. Thejqstatement sets theidfield tonulland the output from thejqcommand is written to a file namedHands-on-Dashboard.json. - Delete the dashboard.
In the web browser, select Dashboards and Manage in the menu to the left. Identify the Hands-on Dashboard in the list of dashboards and select it by clicking in the checkbox in front of it. A red Delete button will be shown; click on it, and click on the new Delete button that is shown in the confirm dialog box that pops up.
- Recreate the dashboard by importing it from the JSON file with the following command:
curl -i -XPOST -H 'Accept: application/json' -H 'Content-Type: application/json' -k
    'https://grafana.minikube.me/api/dashboards/db'
    -d @Hands-on-Dashboard.json
Note that the URL used to access the dashboard is still valid, in my case https://grafana.minikube.me/d/YMcDoBg7k/hands-on-dashboard.
- Verify that the imported dashboard reports metrics in the same way as before it was deleted and reimported. Since the request loop started in the Testing the retry metrics section is still running, the same metrics as in that section should be reported.
For more information regarding Grafana's APIs, see https://grafana.com/docs/grafana/v7.2/http_api/dashboard/#get-dashboard-by-uid.
Before proceeding to the next section, remember to stop the request loop that we started for the retry test by pressing Ctrl + C in the terminal window where the request loop executes!
In the next section, we will learn how to set up alarms in Grafana, based on these metrics.
Setting up alarms in Grafana
Being able to monitor the circuit breaker and retry metrics is of great value, but even more important is the capability to define automated alarms on these metrics. Automated alarms relieve us from monitoring the metrics manually.
Grafana comes with built-in support for defining alarms and sending notifications to a number of channels. In this section, we will define alerts on the circuit breaker and configure Grafana to send emails to the test mail server when alerts are raised. The local test mail server was installed in the earlier section Installing a local mail server for tests.
For other types of channels supported by the version of Grafana used in this chapter, see https://grafana.com/docs/grafana/v7.2/alerting/notifications/#list-of-supported-notifiers.
In the next section, we will define a mail-based notification channel that will be used by the alert in the section after this.
Setting up a mail-based notification channel
To configure a mail-based notification channel in Grafana, perform the following steps:
- On the Grafana web page, on the menu to the left, click on the Alerting menu choice (with an alarm bell as its icon) and select Notification channels.
- Click on the Add channel button.
- Set the name to
mail. - Select the type as Email.
- Enter an email address of your choice. Emails will only be sent to the local test mail server, independent of the email address that's specified.
- Expand Notification settings and select Default (Use this notification for all alerts).
The configuration of the notification channel should look as follows:
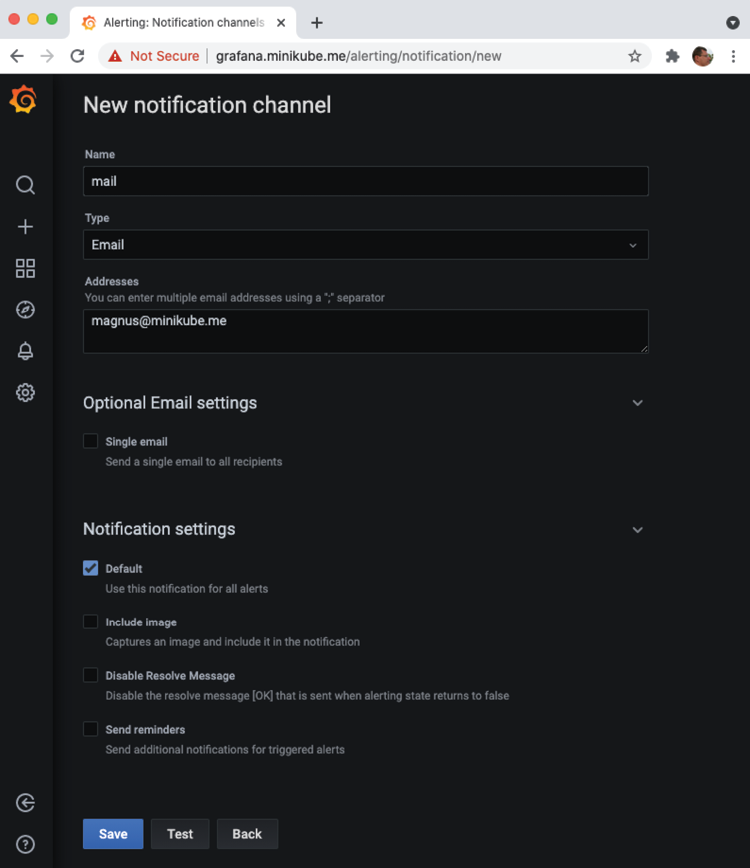
Figure 20.14: Setting up an email-based notification channel
- Click on the Test button to send a test mail.
- Click on the Save button.
- Click on the Dashboard button in the left-hand side menu and then on the Manage menu entry.
- Select Hands-on Dashboard from the list to get back to the dashboard.
- Check the test mail server's web page to ensure that we have received a test email. You should receive the following:
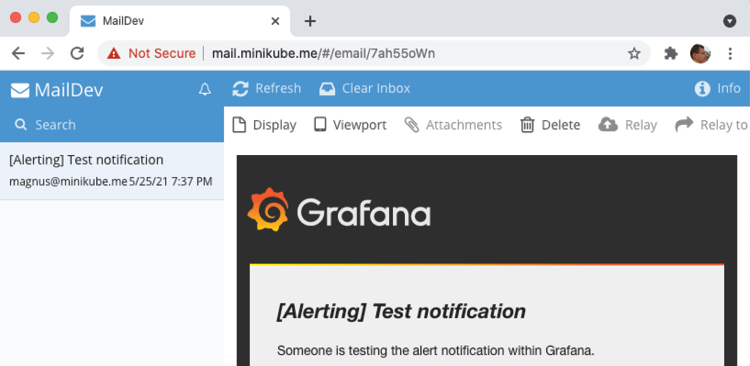
Figure 20.15: Verifying the test mail on the mail server's web page
With a notification channel in place, we are ready to define an alert on the circuit breaker.
Setting up an alarm on the circuit breaker
To create an alarm on the circuit breaker, we need to create the alert and then add an alert list to the dashboard, where we can see what alert events have occurred over time.
Perform the following steps to create an alert for the circuit breaker:
- In the Hands-on Dashboard, click on the header of the Circuit Breaker panel. A drop-down menu will appear.
- Select the Edit menu option.
- Select the Alert tab in the tab list (shown as an alarm bell icon).
- Click on the Create Alert button.
- In the Evaluate every field, set the value to
10s. - In the For field, set the value to
0m. - In the Conditions section, specify the following values:
- For the WHEN field, select
max() - Set the OF field to
query(A, 10s, now) - Change IS ABOVE to IS BELOW and set its value to
0.5
These settings will result in an alert being raised if the Closed state (related to the A variable) goes below 0.5 during the last 10 seconds. When the circuit breaker is closed, this variable has the value 1, and 0 otherwise. So this means that an alert is raised when the circuit breaker is no longer closed.
- For the WHEN field, select
- Scroll down to the Notifications section to confirm that the notification will be sent to the default notification channel, that is, the mail channel we defined previously. The alarm definition should look as follows:
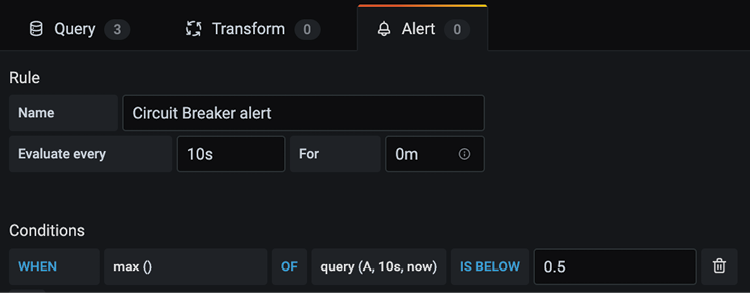
Figure 20.16: Setting up an alarm in Grafana
- Click on the Save button (top right), enter a note like "
Added an alarm" and then click on the Save button. - Click on the back button (left arrow) to get back to the dashboard.
Then, we need to perform the following steps to create an alarm list:
- Click on the Add panel button in the top-level menu.
- Click on the Add new panel button in the new panel.
- In the Panel tab to the right, expand the Settings row and enter
Circuit Breaker Alertsas the Panel title. - Expand the Visualization row below the Settings row and select Alert list.
- In the Options row below, set the Show field to Recent state changes, set Max items to
10, and enable the option Alerts from this dashboard.The settings should look as follows (some irrelevant information has been removed):
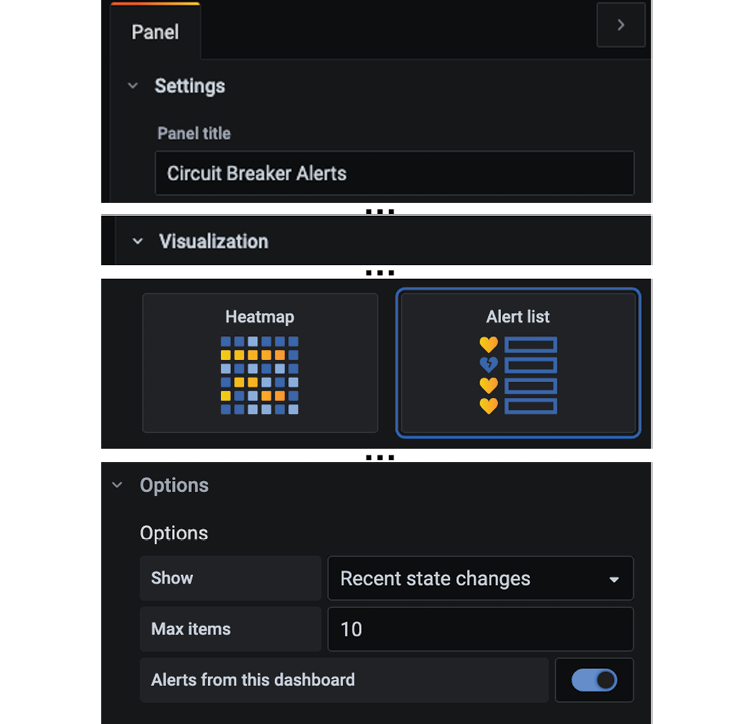
Figure 20.17: Setting up an alarm in Grafana, part 2
- Click on the back button to get back to the dashboard.
- Rearrange the panel to suit your needs.
- Save the changes to the dashboard with a note like "
Added an alert list".
Here is a sample layout with the alarm list added:
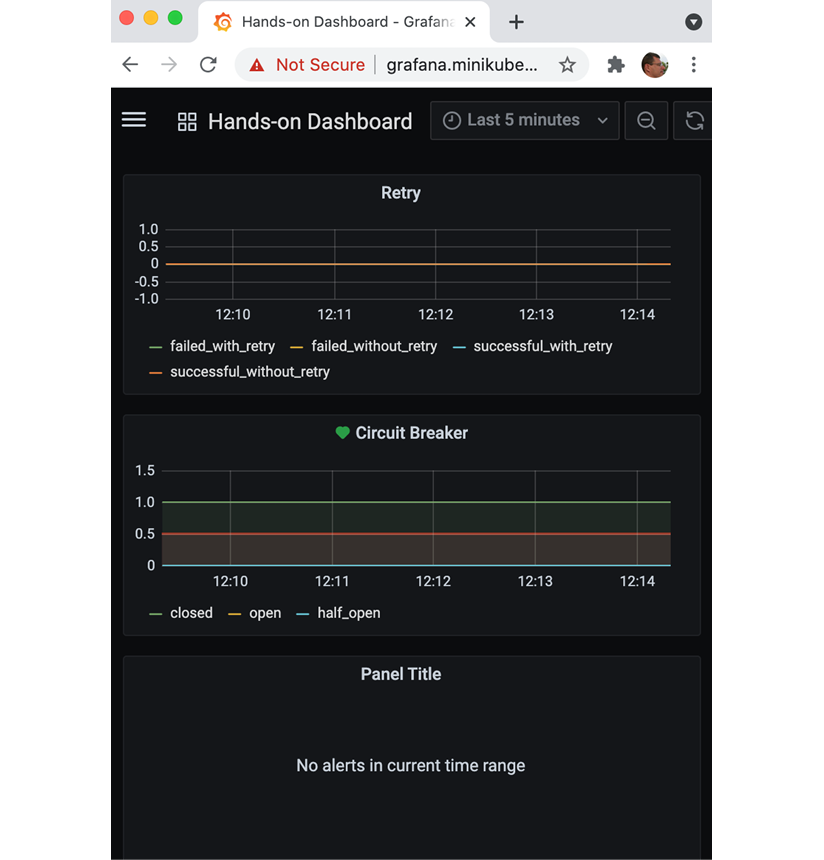
Figure 20.18: Setting up a layout in Grafana with Retry, Circuit Breaker, and alert panels
We can see that the circuit breaker reports the metrics as healthy (with a green heart) and the alert list is currently empty.
Now, it's time to try out the alarm!
Trying out the circuit breaker alarm
Here, we will repeat the tests from the Testing the circuit breaker metrics section, but this time, we expect alarms to be raised and emails to be sent as well! Let's get started:
- Acquire a new access token, if required (valid for 1 hour):
ACCESS_TOKEN=$(curl -k https://writer:[email protected]/oauth2/token -d grant_type=client_credentials -s | jq .access_token -r) echo ACCESS_TOKEN=$ACCESS_TOKEN - Open the circuit breaker as we have done before:
for ((n=0; n<4; n++)); do curl -o /dev/null -skL -w "%{http_code}
" https://minikube.me/product-composite/1?delay=3 -H "Authorization: Bearer $ACCESS_TOKEN" -s; done
The dashboard should report the circuit as open as it did previously. After a few seconds, an alarm should be raised, and an email is also sent. Expect the dashboard to look like the following screenshot:
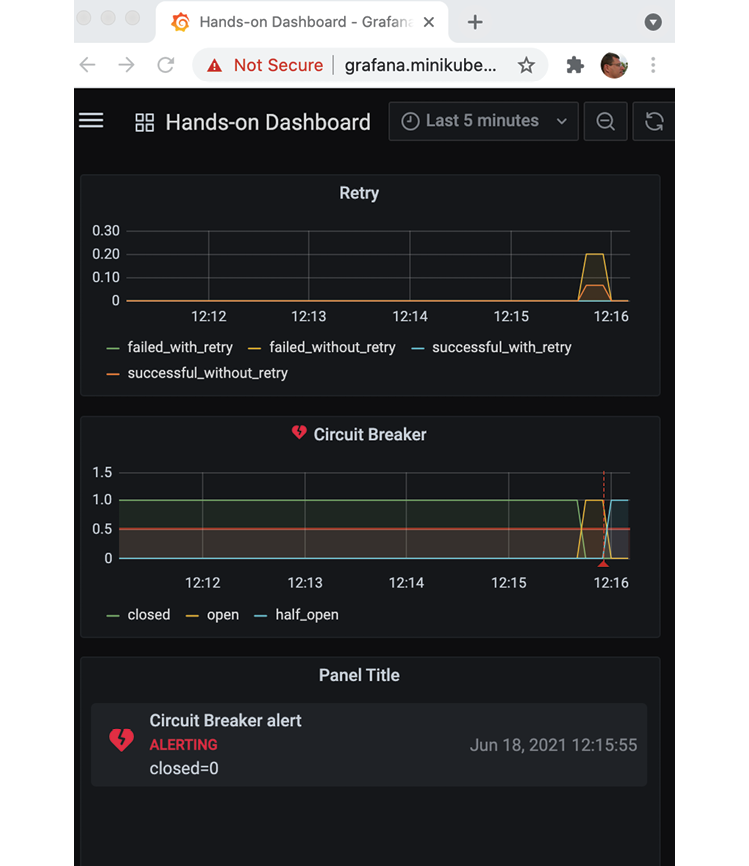
Figure 20.19: Alarm raised in Grafana
Take note of the alarm icon in the header of the circuit breaker panel (a red broken heart). The red line marks the time of the alert event and that an alert has been added to the alert list.
- In the test mail server, you should see an email, as shown in the following screenshot:
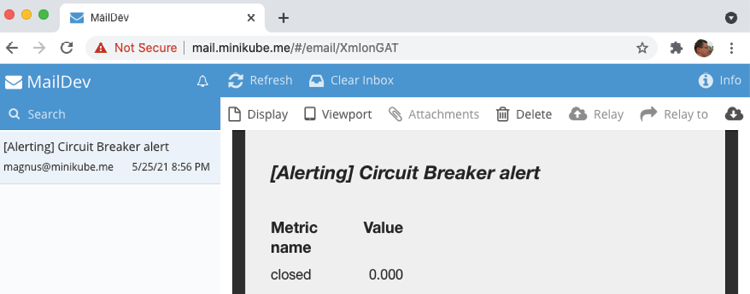
Figure 20.20: Alarm email
- Great; we got alarms, just like we expected! Now, close the circuit with the following command, simulating that the problem is gone:
for ((n=0; n<4; n++)); do curl -o /dev/null -skL -w "%{http_code}
" https://minikube.me/product-composite/1?delay=0 -H "Authorization: Bearer $ACCESS_TOKEN" -s; done
The closed metric should go back to normal, that is 1, and the alert should turn green again.
Expect the dashboard to look like the following screenshot:
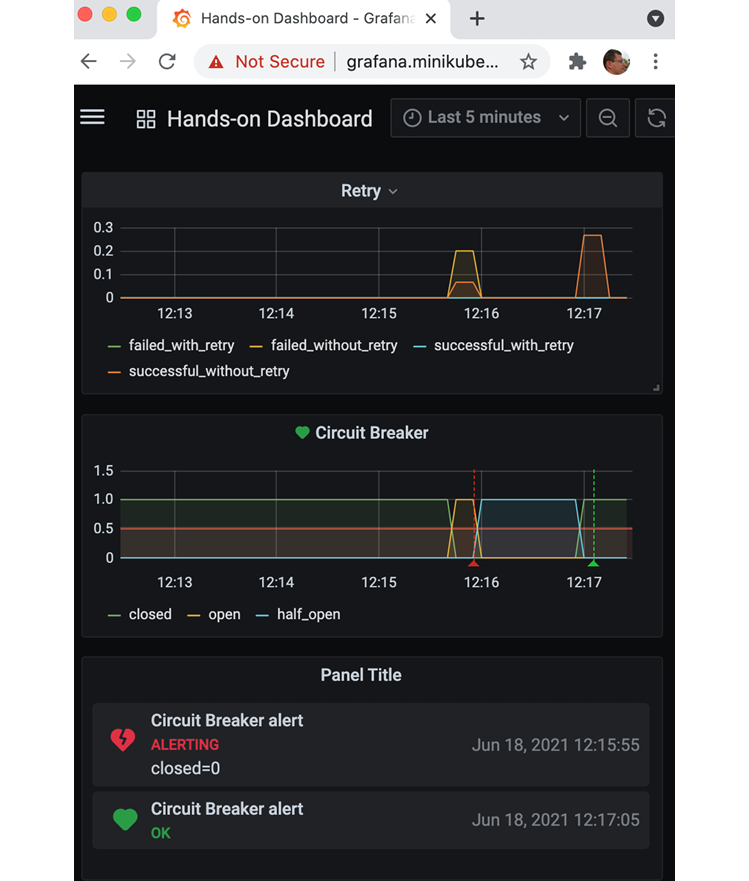
Figure 20.21: Error resolved as reported in Grafana
Note that the alarm icon in the header of the circuit breaker panel is green again; the green line marks the time of the OK event and that an OK event has been added to the alert list.
- In the test mail server, you should see an email, as shown in the following screenshot:
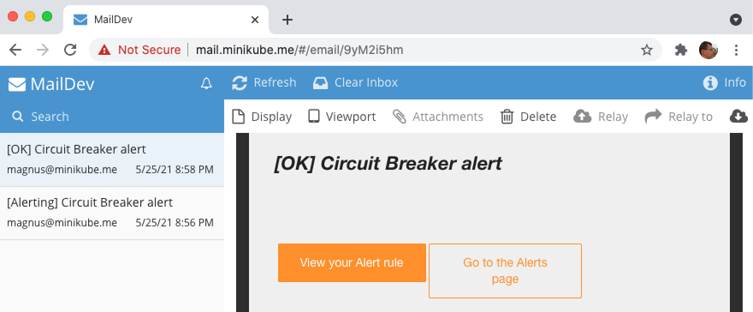
Figure 20.22: Error resolved as reported in an email
That completes how to monitor microservices using Prometheus and Grafana.
Summary
In this chapter, we have learned how to use Prometheus and Grafana to collect and monitor alerts on performance metrics.
We saw that, for collecting performance metrics, we can use Prometheus in a Kubernetes environment. We then learned how Prometheus can automatically collect metrics from a Pod when a few Prometheus annotations are added to the Pod's definition. To produce metrics in our microservices, we used Micrometer.
Then, we saw how we can monitor the collected metrics using dashboards in both Kiali and Grafana, which comes with the installation of Istio. We also experienced how to consume dashboards shared by the Grafana community, and learned how to develop our own dashboards where we used metrics from Resilience4j to monitor the usage of its circuit breaker and retry mechanisms. Using the Grafana API, we can export created dashboards and import them into other Grafana instances.
Finally, we learned how to define alerts on metrics in Grafana and how to use Grafana to send out alert notifications. We used a local test mail server to receive alert notifications from Grafana as emails.
The next two chapters should already be familiar to you, covering the installation of tools on a Mac or Windows PC. Instead, head over to the last chapter in this book, which will introduce how we can compile our Java-based microservices into binary executable files using the brand new, still in beta when writing this book, Spring Native project. This will enable the microservices to start up in a fraction of a second, but involves increased complexity and time when it comes to building them.
Questions
- What changes did we need to make to the source code in the microservices to make them produce metrics that are consumed by Prometheus?
- What is the
management.metrics.tags.applicationconfig parameter used for? - If you want to analyze a support case regarding high CPU consumption, which of the dashboards in this chapter would you start with?
- If you want to analyze a support case regarding slow API responses, which of the dashboards in this chapter would you start with?
- What is the problem with counter-based metrics such as Resilience4j's retry metrics and what can be done so that we can monitor them in a useful way?
- What is going on here?
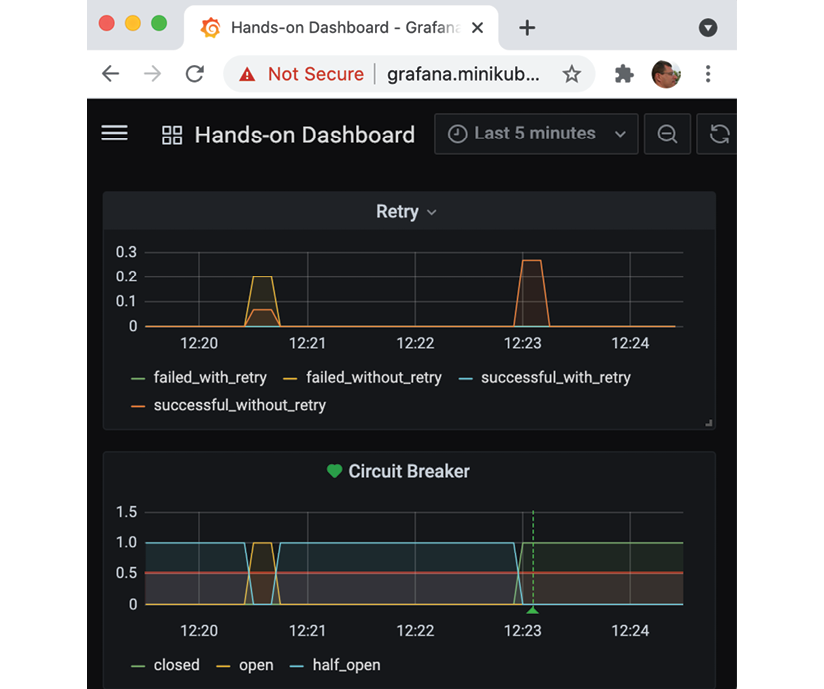
Figure 20.23: What is going on here?
If you are reading this with screenshots rendered in grayscale, it might be hard to figure out what the metrics say. So, here's some help:
- The state transitions reported by the circuit breaker are, in order:
- half_open → open
- open → half_open
- half_open → closed
- The retry mechanism reports:
- An initial burst of requests, where most of them are reported as failed_without_retry and a few are reported as successful_without_retry.
- A second burst of requests, all reported as successful_without_retry.
- The state transitions reported by the circuit breaker are, in order: