16
Deploying Our Microservices to Kubernetes
In this chapter, we will deploy the microservices in this book to Kubernetes. To bundle and configure the microservices for deployments in different runtime environments, Helm, a package manager for Kubernetes, will be used. Before doing that, we need to review how service discovery is used. Since Kubernetes comes with built-in support for service discovery, it seems unnecessary to deploy Netflix Eureka for that purpose. Finally, we will also try out some Spring Boot features that facilitate the deployment of microservices in Kubernetes.
The following topics will be covered in this chapter:
- Replacing Netflix Eureka with Kubernetes Service objects and
kube-proxyfor service discovery - Introducing how Kubernetes will be used
- Using Spring Boot's support for graceful shutdown and probes for liveness and readiness
- Using Helm to package, configure, and deploy the microservices in different environments
- Verifying the deployments with the test script,
test-em-all.bash
Technical requirements
For instructions on how to install tools used in this book and how to access the source code for this book, see:
- Chapter 21 for macOS
- Chapter 22 for Windows
The code examples in this chapter all come from the source code in $BOOK_HOME/Chapter16.
If you want to view the changes applied to the source code in this chapter, that is, see what it took to deploy the microservices on Kubernetes, you can compare it with the source code for Chapter 15, Introduction to Kubernetes. You can use your favorite diff tool and compare the two folders, $BOOK_HOME/Chapter15 and $BOOK_HOME/Chapter16.
Replacing Netflix Eureka with Kubernetes Services
As shown in the previous chapter, Chapter 15, Introduction to Kubernetes, Kubernetes comes with a built-in discovery service based on Kubernetes Service objects and the kube-proxy runtime component. This makes it unnecessary to deploy a separate discovery service such as Netflix Eureka, which we used in the previous chapters.
An advantage of using the Kubernetes discovery service is that it doesn't require a client library such as Spring Cloud LoadBalancer, which we have been using together with Netflix Eureka. This makes the Kubernetes discovery service easy to use, independent of which language or framework a microservice is based on.
A drawback of using the Kubernetes discovery service is that it only works in a Kubernetes environment. However, since the discovery service is based on kube-proxy, which accepts requests to the DNS name or IP address of a Service object, it should be fairly simple to replace it with a similar discovery service, for example, one that comes bundled with another container orchestrator.
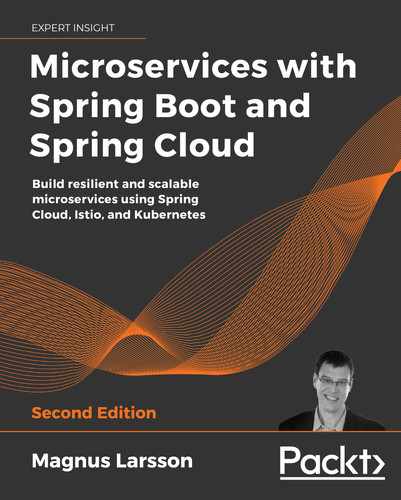
To summarize this, we will remove the discovery server based on Netflix Eureka from our microservice landscape, as illustrated in the following diagram:

Figure 16.1: Replacing Netflix Eureka with the Kubernetes built-in discovery service
To replace the discovery server based on Netflix Eureka with the built-in discovery service in Kubernetes, we need to make some changes in our build and configuration files. We do not need to make any changes in the Java source code, except for some of the test classes, where a property is no longer required and therefore will be removed. The following changes have been applied to the source code:
- Netflix Eureka and the Spring Cloud LoadBalancer-specific configuration (client and server) have been removed from the configuration repository,
config-repo. - Routing rules in the gateway service to the Eureka server have been removed from the
config-repo/gateway.ymlfile. - The Eureka server project, in the
spring-cloud/eureka-serverfolder, has been removed. - The Eureka server has been removed from the Docker Compose files and the
settings.gradleGradle file. - The dependency on
spring-cloud-starter-netflix-eureka-clienthas been removed in all of Eureka's client build files,build.gradle. - The property setting
eureka.client.enabled=falsehas been removed from all integration tests of former Eureka clients. - The gateway service no longer uses routing based on the client-side load balancer in Spring Cloud LoadBalancer using the
lbprotocol. For example, thelb://product-compositerouting destination has been replaced withhttp://product-compositein theconfig-repo/gateway.ymlfile. - The HTTP port used by the microservices and the authorization server has been changed from port
8080(9999in the case of the authorization server) to the default HTTP port80. This has been configured inconfig-repofor each affected service like so:spring.config.activate.on-profile: docker server.port: 80
None of the HTTP addresses that we are using are affected by the replacement of Netflix Eureka with Kubernetes Services. For example, addresses used by the composite service are unaffected:
private final String productServiceUrl = "http://product";
private final String recommendationServiceUrl = "http://recommendation";
private final String reviewServiceUrl = "http://review";
This is because we changed the HTTP port used by the microservices and the authorization server to the default HTTP port, 80, as described previously.
Using Docker Compose still works, even though Netflix Eureka has been removed. This can be used for running functional tests of the microservices without deploying them to Kubernetes, for example, running test-em-all.bash together with Docker Desktop in the same way as in the previous chapters. Removing Netflix Eureka, however, means that we no longer have a discovery service in place when using plain Docker and Docker Compose. Therefore, scaling microservices will only work when deploying to Kubernetes.
In Chapter 17, Implementing Kubernetes Features to Simplify the System Landscape, in the section Verifying that microservices work without Kubernetes, we will discuss the importance of avoiding the source code of the microservices being dependent on the Kubernetes platform, thus avoiding vendor lock-in. We will also use the test script test-em-all.bash together with Docker Compose to verify that the microservices don't require Kubernetes from a functional perspective.
Now that we've familiarized ourselves with how Netflix Eureka will be replaced with Kubernetes Services, let's introduce the other Kubernetes objects we will use.
Introducing how Kubernetes will be used
Later on in the chapter, we will see in detail how the various Kubernetes objects are used to deploy the microservices and the resource managers they depend on, like databases and queue managers. Before delving into all the details, let's get an overview of the Kubernetes objects that will be used:
- For each microservice, database, and queue manager that will be deployed in Kubernetes, one Deployment object and one Service object will be created. For all components, except for the edge server named
gateway, the Service object will be of typeClusterIP. For the gateway, the Service object will be of typeNodePortaccepting external HTTPS requests on port30433. - The config server will use a ConfigMap, containing the configuration files in the
config-repo. - To hold credentials for the config server and its clients, two Secrets will be created: one for the config server and one for its clients.
Now that we've seen what Kubernetes objects will be created, let's learn about the Spring Boot features that facilitate deployment to Kubernetes.
Using Spring Boot's support for graceful shutdown and probes for liveness and readiness
In Spring Boot v2.3, a couple of useful features were added to support deployments to Kubernetes:
- Graceful shutdown
Whenever a microservice instance needs to be stopped, for example in a rolling upgrade scenario, there is a risk that active requests are affected when the instance is stopped. To minimize this risk, Spring Boot has added support for graceful shutdown. When applying graceful shutdown, a microservice stops accepting new requests and waits for a configurable time for active requests to complete before it shuts down the application. Requests that take a longer time to complete than the shutdown wait period will be aborted. These requests will be seen as exceptional cases that a shutdown procedure can't wait for before it stops the application.
Graceful shutdown has been enabled with a wait period of 10 seconds for all microservices by adding the following to the common file
application.ymlin theconfig-repofolder:server.shutdown: graceful spring.lifecycle.timeout-per-shutdown-phase: 10sFor more information, see https://docs.spring.io/spring-boot/docs/2.5.2/reference/htmlsingle/#features.graceful-shutdown.
- Liveness and readiness probes
As described in Chapter 15, Introduction to Kubernetes, proper implementations of liveness and readiness probes are essential for Kubernetes to be able to manage our Pods. To briefly recap, a liveness probe tells Kubernetes if a Pod needs to be replaced and a readiness probe tells Kubernetes if its Pod is ready to accept requests. To simplify this work, Spring Boot has added support for implementing liveness and readiness probes. The probes are exposed on the URLs
/actuator/health/livenessand/actuator/health/readiness. They can either be declared by configuration or implementation in source code, if increased control is required compared to what configuration gives. When declaring the probes by configuration, a health group can be declared for each probe specifying what existing health indicators it should include. For example, a readiness probe should reportDOWNif a microservice can't access its MongoDB database. In this case, the health group for the readiness probe should include themongohealth indicator. For available health indicators, see https://docs.spring.io/spring-boot/docs/2.5.2/reference/htmlsingle/#actuator.endpoints.health.auto-configured-health-indicators.In this chapter, we will declare the probes using the following configuration in the common file
application.ymlin theconfig-repofolder:management.endpoint.health.probes.enabled: true management.endpoint.health.group.readiness.include: rabbit, db, mongoThe first line of the configuration enables the liveness and readiness probes. The second line declares that readiness probes will include health indicators for RabbitMQ, MongoDB, and SQL databases, if available. For the liveness probe, we don't need to add any extra health indicators. For the scope of this chapter, it is sufficient that the liveness probe reports
UPgiven that the Spring Boot application is up and running.For more information, see https://docs.spring.io/spring-boot/docs/2.5.2/reference/htmlsingle/#actuator.endpoints.kubernetes-probes.
We will try out these features once we have deployed our microservices in Kubernetes. Before we do that, we need to learn about Helm and see how it helps us bundle, configure, and deploy microservices to Kubernetes.
Introducing Helm
As described above, deploying a microservice to Kubernetes requires writing manifest files that declare the desired state of a Deployment object and a Service object. If we also need to add some configuration for the microservices, manifests for ConfigMaps and Secrets must be added. The approach of declaring a desired state and handing over the responsibility to Kubernetes to ensure that the actual state is always as close as possible to the desired state is very useful.
But writing and maintaining these manifest files can become a significant maintenance overhead. The files will contain a lot of boilerplate code, meaning duplicated manifests that will look the same for all microservices. It is also cumbersome to handle environment-specific settings without duplicating the whole set of manifest files, even though only a fraction of the content needs to be updated.
In the case of a few microservices that will only be deployed to a few environments, like a test, QA, and production environment, this might not be a major issue to handle. When the number of microservices grows to tens and hundreds and it must be possible to deploy different groups of microservices to different test, QA, and production environments, this quickly becomes an unmanageable maintenance problem.
To address these shortcomings, we will use Helm (https://helm.sh), an open source-based package manager for Kubernetes. With Helm comes a templating language that can be used to extract settings specific to a microservice or an environment from generic definitions of the various Kubernetes objects used.
For smaller system landscapes with only a few Deployment objects, simpler templating tools can be sufficient. For example, if you are already familiar with Ansible and its Jinja2 templates, they can be used instead. Also, kubectl itself comes with built-in support for Kustomize, offering a template-free alternative for customizing Kubernetes manifest files.
A package is known as a chart in Helm. A chart contains templates, default values for the templates, and optional dependencies on definitions in other charts. Each component that needs to be deployed, meaning the microservices and the resource managers they depend on like databases and queue managers, will have its own chart describing how to deploy it.
To extract boilerplate definitions from the components' charts, a special type of chart, a library chart, will be used. A library chart doesn't contain any deployable definitions but only templates expected to be used by other charts for Kubernetes manifests, in our case for Deployment, Service, ConfigMap, and Secret objects.
Finally, to be able to describe how to deploy all components into different types of environments, for example, for development and test or staging and production, the concept of parent charts and subcharts will be used. We will define two types of environments, dev-env and prod-env. Each environment will be implemented as a parent chart that depends on different sets of subcharts, for example the microservice charts. The environment charts will also provide environment-specific default values, such as for the requested number of Pods, Docker image versions, credentials, and resource requests and limits.
In summary, we will have one reusable library chart, named common, a set of microservice- and resource manager-specific charts, placed in the components folder, and two environment-specific parent charts, placed in the environments folder. This file structure looks like:
|-- common
|   |-- Chart.yaml
|   |-- templates
|   |-- templates_org
|   `-- values.yaml
|-- components
|   |-- auth-server
|   |-- config-server
|   |-- gateway
|   |-- mongodb
|   |-- mysql
|   |-- product
|   |-- product-composite
|   |-- rabbitmq
|   |-- recommendation
|   |-- review
|   `-- zipkin-server
`-- environments
    |-- dev-env
    `-- prod-env
The files can be found in the folder $BOOK_HOME/Chapter16/kubernetes/helm.
To share Helm charts with others, they can be published to a Helm chart repository. In this book we will not publish any charts, but in Chapter 17, Implementing Kubernetes Features to Simplify the System Landscape, we will install a component named cert-manager using a Helm chart from a chart repository.
Before we learn about how charts are constructed, let's learn about the most frequently used Helm commands and how to run them.
Running Helm commands
To make Helm do something for us, we will use its CLI tool, helm.
Some of the most frequently used Helm commands are:
create: used to create new charts.dependency update(dep upfor short): resolves dependencies on other charts. Charts are placed in thechartsfolder and the fileChart.lockis updated.dependency build: rebuilds the dependencies based on the content in the fileChart.lock.template: renders the definitions files created by the templates.install: installs a chart. This command can override the values supplied by a chart, either using the--setflag to override a single value or using the--valuesflag to supply its ownyamlfile with values.install --dry-run: simulates a deployment without performing it; useful for verifying a deployment before executing it.list: lists installations in the current Namespace.upgrade: updates an existing installation.uninstall: removes an installation.
For full documentation of the commands that Helm provides, see https://helm.sh/docs/helm/.
Let's put these Helm commands in context and see what files a chart consists of.
Looking into a Helm chart
A Helm chart has a predefined structure of files. We will use the following files:
Chart.yaml, which contains general information about the chart and a list of other charts it might depend on.templates, a folder that contains the templates that will be used to deploy the chart.values.yaml, which contains default values for the variables used by the templates.Chart.lock, a file created by Helm when resolving the dependencies described in theChart.yamlfile. This information describes in more detail what dependencies are actually used. It is used by Helm to track the entire dependency tree, making it possible to recreate the dependency tree exactly as it looked the last time the chart worked.charts, a folder that will contain the charts this chart depends on after Helm has resolved the dependencies..helmignore, an ignore file similar to.gitignore. It can be used to list files that should be excluded when building the chart.
Now we understand the structure inside a Helm chart, let's learn about one of the core features of Helm: its template mechanism, and how to pass values to it.
Helm templates and values
Helm templates are used to parameterize Kubernetes manifest files. Using templates, we no longer need to maintain long-winded Deployment manifests for each microservice. Instead, we can define a common template that contains placeholders for where microservice-specific values will be placed in the template, when a manifest is rendered for a specific microservice. Let's see an example, extracted from kubernetes/helm/common/templates/_deployment.yaml:
apiVersion: apps/v1
kind: Deployment
metadata:
  name: {{ include "common.fullname" . }}
spec:
  replicas: {{ .Values.replicaCount }}
  template:
    spec:
      containers:
        - name: {{ .Chart.Name }}
It looks very similar to the Deployment manifest we saw in Chapter 15, Introduction to Kubernetes, with the exception of the use of the {{ ... }} constructs, used to insert microservice-specific values in the template. The construct {{ include "common.fullname" . }} is used to invoke other templates, as explained below. The other two constructs are used to insert values using one of the built-in objects in Helm. The most frequently used parts of the built-in objects are:
Values: used to refer to values in the chart'svalues.yamlfile or values supplied when running a Helm command likeinstall.Release: used to provide metadata regarding the current release that is installed. It contains fields like:Name: name of the releaseNamespace: name of the Namespace where the installation is performedService: name of the installation service, always returningHelm
Chart: used to access information from theChart.yamlfile. Examples of fields that can be useful for providing metadata for a deployment are:Name: name of the chartVersion: the chart's version number
Files: containing functions for accessing chart-specific files. In this chapter we will use the following two functions in theFilesobject:Capabilities: can be used to find information regarding the capabilities of the Kubernetes cluster that the installation is performed on. For example, a template can use information in this object to adopt a manifest based on what API versions the actual Kubernetes cluster supports. We will not use this object in this chapter, but I think it is of interest to know about for more advanced use cases.
For further details on built-in objects, see https://helm.sh/docs/chart_template_guide/builtin_objects.
All objects are accessible in a tree where the root context, in most cases, can be addressed using the current scope, represented by a period, ".", also known as the dot. From the examples above we can see the use of the dot, for example in .Values.replicaCount and .Chart.Name, where we can see that the built-in objects Values and Chart are accessible directly under the current scope. In the include directive above, we can also see the dot being used as a parameter sent to the template named common.fullname, meaning the whole tree is sent to the template. Instead of sending the whole tree to a template, a sub-tree can be passed.
When using some of the Helm functions, the current scope will be changed and no longer point to the root context. We will, for example, meet the range function later on, which can be used to iterate through collections of values. If we need to access the root context inside the scope of a range function, we can use the predefined variable $.
Helm templates also support the declaration of variables to reference other objects. For example:
$name := .Release.Name
In this example, a variable, name, has been declared to hold the value of the Helm release that is currently being processed. We will see later on how variables are used in more advanced constructs.
If you recognize the format of using the {{ ... }} constructs from using kubectl, you are right. They are in both cases based on Go templates. For more information, see https://golang.org/pkg/text/template/.
With the templating mechanism introduced, let's learn about how the three types of charts are constructed. We start with the most important chart, the common chart, explaining the components and environments charts after that.
The common library chart
This chart contains reusable templates, also known as named templates, for the four types of Kubernetes manifests we will use in this chapter: Deployment, Service, ConfigMap, and Secret. The structure and content of the common chart are based on the output from a helm create command. Specifically, the template file _helpers.tpl has been retained to reuse best practices for naming conventions. It declares the following templates that encapsulate naming conventions:
common.name: based on the chart name.common.fullname: based on a combination of the name of the release and the chart. In this book, we will override this naming convention and simply use the name of the chart.common.chart: based on the chart name and version.
For details, see the implementation in the _helpers.tpl file.
Named templates, which will only be used by other templates and not used to create manifests themselves, must have a name that starts with an underscore, "_". This is used to prevent Helm from trying to create manifests using them alone.
Since the named templates for the Kubernetes manifests mentioned previously contain the main part of the logic and therefore most of the complexity in the Helm charts, we will go through them one by one.
The ConfigMap template
This template is designed to create ConfigMaps from files in the folder config-repo. Each ConfigMap will contain all non-sensitive configuration required by a specific Deployment. The Deployment manifest will map the content of the ConfigMap as a volume in its Pod template. This will result in Pods created by the Deployment being able to access the configuration as files in their local filesystem. See the section The Deployment template below for details. The config-repo folder needs to be placed in the charts that use the common chart.
In this chapter, this template will be used only by the config server chart in the components folder. In the next chapter, all other microservices will also use this template to define their own ConfigMaps, since the config server will be removed.
The templates file is named _configmap_from_file.yaml and it looks like:
{{- define "common.configmap_from_file" -}}
apiVersion: v1
kind: ConfigMap
metadata:
  name: {{ include "common.fullname" . }}
  labels:
    app.kubernetes.io/name: {{ include "common.name" . }}
    helm.sh/chart: {{ include "common.chart" . }}
    app.kubernetes.io/managed-by: {{ .Release.Service }}
data:
{{ (.Files.Glob "config-repo/*").AsConfig | indent 2 }}
{{- end -}}
An explanation of the template is as follows:
- The first line,
{{- define "common.configmap_from_file " -}}, is used to declare the name of the reusable template. The scope of the template ends with a matching{{- end -}}, the last line in this example. - To set the name of the ConfigMap, the template
common.fullnamefrom the file_helpers.tplis used. - Next, a number of labels are defined to make it easier to identify the ConfigMap later on. Again, templates from the
_helpers.tplfile are used to set thenameand specify thechartused. To mark that this Service has been created using Helm, the labelapp.kubernetes.io/managed-byis set to the value for the field.Release.Service. From the earlier description of theReleaseobject, we know that it always returns the valueHelm. - Next comes the core part of the ConfigMap, its
datasection. To specify the actual configuration in the ConfigMap, theGlobfunction in theFilesobject is used to get all files in the folderconfig-repo. Next, the functionAsConfigis applied to the content in the files to form a proper YAML map. The result is piped to theindentfunction that ensures a proper indentation is rendered, in this case using two characters.
The hyphens in {{- and -}} are used to remove preceding and trailing whitespace remaining after the processing of the directive inside the curly braces.
Example of using the ConfigMap template
In this chapter, only the config server will use a ConfigMap. See the section on The components charts for a description of how this template is used.
To see the ConfigMap that will be created by Helm using this template, run the following commands:
cd $BOOK_HOME/Chapter16/kubernetes/helm/components/config-server
helm dependency update .
helm template . -s templates/configmap_from_file.yaml
Expect output from the helm template command like the following:
---
# Source: config-server/templates/configmap_from_file.yaml
apiVersion: v1
kind: ConfigMap
metadata:
  name: config-server
  labels:
    app.kubernetes.io/name: config-server
    helm.sh/chart: config-server-1.0.0
    app.kubernetes.io/managed-by: Helm
data:
  application.yml: |-
    app:
      auth-server: localhost
  ...
  auth-server.yml: |-
    server.port: 9999
  ...
The data field contains the content of all files in the config-repo folder.
The Secrets template
This template is designed to create Secrets defined by values like credentials provided by the environments dev-env and prod-env. The Secrets will be mapped as environment variables in the Pods. See the section The Deployment template below for details. Since an environment must be able to define multiple Secrets, this template is designed to create multiple Secret manifests using the range function in Helm. The template file is named _secrets.yaml and it looks like:
{{- define "common.secrets" -}}
{{- range $secretName, $secretMap := .Values.secrets }}
apiVersion: v1
kind: Secret
metadata:
  name: {{ $secretName }}
  labels:
    app.kubernetes.io/name: {{ $secretName }}
    helm.sh/chart: {{ include "common.chart" $ }}
    app.kubernetes.io/managed-by: {{ $.Release.Service }}
type: Opaque
data:
{{- range $key, $val := $secretMap }}
  {{ $key }}: {{ $val | b64enc }}
{{- end }}
---
{{- end -}}
{{- end -}}
An explanation of the template is as follows:
- After the declaration of the template in line 1 comes the use of the
rangefunction in line 2. The function assumes that the field.Values.secretscontains a map of Secret names and a map of the Secret's keys/value pairs. A declaration of the Secrets field in one of the environment'svalues.yamlfiles will look like:secrets: a-secret: key-1: secret-value-1 key-2: secret-value-2 another-secret: key-3: secret-value-3This definition will render two Secrets, named
a-secretandanother-secret. Therangefunction assigns the current Secret name and its map to the variables$secretNameand$secretMap. - Since the
rangefunction changes the current scope, we can no longer use the dot notation to pass the root context to thecommon.charttemplate. Instead, the variable$has to be used. - In the
datasection of the manifest, a secondrangefunction is applied a second time to traverse the current Secret's key/value pairs. Each key/value pair is assigned by therangefunction to the variables$keyand$val. - Finally, the Secret's key/value pairs are defined as a map entry in the
datasection. The value in the$valvariable is piped to theb64encfunction to get it properly Base64 encoded as required by a Secret manifest.
The --- is used to separate the rendered Secret manifests from each other, so that they are processed as separate YAML documents.
Example of using the Secrets template
Secrets are only defined by the environment charts dev-env and prod-env. They are used to create environment-specific credentials. See the section on The environment charts for a description of how this template is used.
To see the Secrets that will be created for the dev-env by Helm using this template, run the following commands:
cd $BOOK_HOME/Chapter16/kubernetes/helm
for f in components/*; do helm dependency update $f; done
helm dependency update environments/dev-env
helm template environments/dev-env -s templates/secrets.yaml
Expect output from the helm template command like this:
---
# Source: dev-env/templates/secrets.yaml
apiVersion: v1
kind: Secret
metadata:
  name: config-client-credentials
  labels:
    app.kubernetes.io/name: config-client-credentials
    helm.sh/chart: dev-env-1.0.0
    app.kubernetes.io/managed-by: Helm
type: Opaque
data:
  CONFIG_SERVER_PWD: ZGV2LXB3ZA==
  CONFIG_SERVER_USR: ZGV2LXVzcg==
---
# Source: dev-env/templates/secrets.yaml
apiVersion: v1
kind: Secret
metadata:
  name: config-server-secrets
  labels:
    app.kubernetes.io/name: config-server-secrets
    helm.sh/chart: dev-env-1.0.0
    app.kubernetes.io/managed-by: Helm
type: Opaque
data:
  ENCRYPT_KEY: bXktdmVyeS1zZWN1cmUtZW5jcnlwdC1rZXk=
  SPRING_SECURITY_USER_NAME: ZGV2LXVzcg==
  SPRING_SECURITY_USER_PASSWORD: ZGV2LXB3ZA==
The Service template
The Service template introduces support for overriding default values from the common chart with values specific to the charts that use the common chart. The common chart will, for example, provide default values for the Service type and what ports the Service will expose. This will be useful for most of the microservices, but some of them need to be able to override these default values in their own values.yaml file.
The template file is named _service.yaml and starts like the other named templates with the declaration of its name, followed by the implementation of the override mechanism. It looks like:
{{- define "common.service" -}}
{{- $common := dict "Values" .Values.common -}}
{{- $noCommon := omit .Values "common" -}}
{{- $overrides := dict "Values" $noCommon -}}
{{- $noValues := omit . "Values" -}}
{{- with merge $noValues $overrides $common -}}
This construct can be explained in the following way:
- When the
_service.yamltemplate is used by a microservice to render its Service manifest, the values from the microservicevalues.yamlfile will be available in the.Valuesobject and the common chart's values will be available under the field.Values.common. - So, the variable
$commonwill refer to a dictionary, created by thedictfunction, with one key,Values, and its value will be the default values from the common chart. These values are taken from the keycommonkey in the.Valuesobject. - The
$noCommonvariable will hold all values from the microservice except values under thecommonkey, specified using theomitfunction. - The
$overridesvariable will refer to a dictionary, also with one key,Values, but its value will be the values from the microservice's values, except thecommonvalues. It gets the values from the$noCommonvariable declared on the previous line. - The
$noValuesvariable will hold all other built-in objects, except for theValuesobject. - Now, and here is where the override will happen, the
mergefunction will create one dictionary based on the dictionaries referred to by the variables$noValues,$overrides, and$common. In this case, values found in the$overridesdictionary will take precedence over values in the$commondictionary, thereby overriding its values. - Finally, the
withfunction will change the scope for the template code that follows until its{{- end -}}definition is reached. So, the current scope, ".", will now refer to the merged dictionary.
Let's take an example to see how this will work out. The common chart's values.yaml file contains the following default settings for the Service type and exposed ports:
 service:
  type: ClusterIP
  ports:
  - port: 80
    targetPort: http
    protocol: TCP
    name: http
This setting will render Service objects that are of type ClusterIP. The Service objects will expose port 80 and forward requests to the Pods on their port named http.
The gateway service needs to expose a NodePort and use other port settings. To override the above default values, it declares the following in its chart's values.yaml file:
service:
  type: NodePort
  ports:
  - port: 443
    targetPort: 8443
    nodePort: 30443
The gateway's values.yaml file can be found in the folder $BOOK_HOME/Chapter16/kubernetes/helm/components/gateway/values.yaml.
The rest of the Service template file looks like:
apiVersion: v1
kind: Service
metadata:
  name: {{ include "common.fullname" . }}
  labels:
    app.kubernetes.io/name: {{ include "common.name" . }}
    helm.sh/chart: {{ include "common.chart" . }}
    app.kubernetes.io/managed-by: {{ .Release.Service }}
spec:
  type: {{ .Values.service.type }}
  ports:
{{ toYaml .Values.service.ports | indent 4 }}
  selector:
    app.kubernetes.io/name: {{ include "common.name" . }}
{{- end -}}
{{- end -}}
An explanation of the template is as follows:
- The metadata fields for
nameandlabelsare defined in the same way as already seen for the previous templates. - The
typeof the Service is set by the field.Values.service.type. - The
portsexposed by the Service are specified using the field.Values.service.ports. The built-in functiontoYamlis used to format its value asyamland the result is piped to theindentfunction, which ensures a proper indentation is rendered, in this case4characters. - Finally, the Pod
selectoris defined. It is based on the labelapp.kubernetes.io/nameand is given the name using the templatecommon.name.
Example of using the Service template
The Service template is used by each component to create its Service manifest. As described above, the core microservices reuse the configuration in the common chart's values.yaml file, while the other components override these values in their own values.yaml file.
To see the Service manifest generated for a core component, for the product microservice, run the following commands:
cd $BOOK_HOME/Chapter16/kubernetes/helm
helm dependency update components/product
helm template components/product -s templates/service.yaml
Expect output from the helm template command like this:
# Source: product/templates/service.yaml
apiVersion: v1
kind: Service
metadata:
  name: product
  labels:
    app.kubernetes.io/name: product
    helm.sh/chart: product-1.0.0
    app.kubernetes.io/managed-by: Helm
spec:
  type: ClusterIP
  ports:
    - name: http
      port: 80
      protocol: TCP
      targetPort: http
  selector:
    app.kubernetes.io/name: product
To see the Service manifest generated for a component that overrides the settings in the common chart, for the gateway component, run the following commands:
cd $BOOK_HOME/Chapter16/kubernetes/helm
helm dependency update components/gateway
helm template components/gateway -s templates/service.yaml
Expect output from the helm template command like:
---
# Source: gateway/templates/service.yaml
apiVersion: v1
kind: Service
metadata:
  name: gateway
  labels:
    app.kubernetes.io/name: gateway
    helm.sh/chart: gateway-1.0.0
    app.kubernetes.io/managed-by: Helm
spec:
  type: NodePort
  ports:
    - nodePort: 30443
      port: 443
      targetPort: 8443
  selector:
    app.kubernetes.io/name: gateway
The Deployment template
Finally, the template for rendering Deployment manifests. This is the most complex template since it must handle many parts of the Deployment manifest as optional. Different components will use different parts of a Deployment manifest. The common charts values.yaml file contains default values for these settings that are applicable to most of the components, minimizing the need to override these settings in each component's own chart's values.yaml file. The following parts of the Deployment manifest are optional to use by the components:
- Arguments given to the container when it starts up
- Environment variables
- Environment variables from Secrets
- Liveness probe
- Readiness probe
- A ConfigMap and a corresponding volume
The template file is named _deployment.yaml and its first lines look very similar to the Service template, utilizing the same type of override mechanism:
{{- define "common.deployment" -}}
{{- $common := dict "Values" .Values.common -}}
{{- $noCommon := omit .Values "common" -}}
{{- $overrides := dict "Values" $noCommon -}}
{{- $noValues := omit . "Values" -}}
{{- with merge $noValues $overrides $common -}}
apiVersion: apps/v1
kind: Deployment
metadata:
  name: {{ include "common.fullname" . }}
  labels:
    app.kubernetes.io/name: {{ include "common.name" . }}
    helm.sh/chart: {{ include "common.chart" . }}
    app.kubernetes.io/managed-by: {{ .Release.Service }}
For an explanation of this part of the template, see the description of the Service template above.
When it comes to the spec part of the manifest, it starts with:
spec:
  replicas: {{ .Values.replicaCount }}
  selector:
    matchLabels:
      app.kubernetes.io/name: {{ include "common.name" . }}
  template:
    metadata:
      labels:
        app.kubernetes.io/name: {{ include "common.name" . }}
    spec:
      containers:
        - name: {{ .Chart.Name }}
          image: "{{ .Values.image.repository }}/{{ .Values.image.name }}:{{ .Values.image.tag }}"
          imagePullPolicy: {{ .Values.image.pullPolicy }}
Here we can see how the core parts of the spec are defined: the requested number of replicas, the selector for the Pods, and the template used to create new Pods. The template defines labels that match the selector and defines the name, Docker image, and the imagePullPolicy to use when starting a container.
Next comes the various optional parts of the manifest, as described above:
          args:
            {{- toYaml . | nindent 12 }}
          {{- end }}
          {{- if .Values.env }}
          env:
          {{- range $key, $val := .Values.env }}
          - name: {{ $key }}
            value: {{ $val }}
          {{- end }}
          {{- end }}
          {{- if .Values.envFromSecretRefs }}
          envFrom:
          {{- range .Values.envFromSecretRefs }}
          - secretRef:
              name: {{ . }}
          {{- end }}
          {{- end }}
          {{- if .Values.livenessProbe_enabled }}
          livenessProbe:
{{ toYaml .Values.livenessProbe | indent 12 }}
          {{- end }}
          {{- if .Values.readinessProbe_enabled }}
          readinessProbe:
{{ toYaml .Values.readinessProbe | indent 12 }}
          {{- end }}
For the environment variables and Secrets that are mapped to environment variables, the range function has been used in the same way as the secrets template uses it. The environment variables can either be specified on a component or environment level, depending on their use case. Secrets are always specified by an environment chart. See the following sections regarding the component and environment charts.
The manifest is concluded by the declaration of the ports the container exposes, resource requests and limits, and finally, the optional declaration of a ConfigMap and a corresponding volume to map the files in the ConfigMap into:
          ports:
{{ toYaml .Values.ports | indent 12 }}
          resources:
{{ toYaml .Values.resources | indent 12 }}
      {{- if .Values.configmap.enabled }}
          volumeMounts:
          - name: {{ include "common.fullname" . }}
            mountPath: {{ .Values.configmap.volumeMounts.mountPath }}
      volumes:
        - name: {{ include "common.fullname" . }}
          configMap:
            name: {{ include "common.fullname" . }}
      {{- end }}
{{- end -}}
{{- end -}}
From the common chart's values.yaml file we can find some default values of interest, for example how default values for the liveness and readiness probes are defined:
livenessProbe_enabled: false
livenessProbe:
  httpGet:
    scheme: HTTP
    path: /actuator/health/liveness
    port: 80
  initialDelaySeconds: 10
  periodSeconds: 10
  timeoutSeconds: 2
  failureThreshold: 20
  successThreshold: 1

readinessProbe_enabled: false
readinessProbe:
  httpGet:
    scheme: HTTP
    path: /actuator/health/readiness
    port: 80
  initialDelaySeconds: 10
  periodSeconds: 10
  timeoutSeconds: 2
  failureThreshold: 3
  successThreshold: 1
From these declarations, we can see that:
- The probes are by default disabled, since not all deployments are using probes.
- The probes are based on HTTP GET requests sent to the endpoints exposed by Spring Boot, as described in the section Using Spring Boot's support for graceful shutdown and probes for liveness and readiness above.
- As long as the endpoint responds with a
2xxor a3xxresponse code, the probe is considered to be successful
- As long as the endpoint responds with a
- The probes can be configured using the following parameters:
initialDelaySecondsspecifies how long Kubernetes waits to probe a container after it's started up.periodSecondsspecifies the time between probe requests sent by Kubernetes.timeoutSecondsspecifies how long Kubernetes waits on a response before it treats the probe as failed.failureThresholdspecifies how many failed attempts Kubernetes makes before giving up. In the case of a liveness probe, this means restarting the Pod. In the case of a readiness probe, it means that Kubernetes will not send any more requests to the container until the readiness probes are successful again.successThresholdspecifies the number of successful attempts that are required for a probe to be considered successful again after a failure. This only applies to readiness probes, since it must be set to1if specified for liveness probes.
Finding optimal settings for the probes can be challenging, that is, finding a proper balance between getting a swift reaction from Kubernetes when the availability of a Pod changes and not overloading the Pods with probe requests.
Specifically, configuring a liveness probe with values that are too low can result in Kubernetes restarting Pods that don't need to be restarted; they just need some extra time to start up. Starting a large number of Pods at the same time, also resulting in extra-long startup times, can in the same way result in a lot of unnecessary restarts.
Setting the configuration values too high on the probes (except for the successThreshold value) makes Kubernetes react more slowly, which can be annoying in a development environment. Proper values also depend on the available hardware, which affects the startup times for the Pods. For the scope of this book, failureThreshold for the liveness probes is set to a high value, 20, to avoid unnecessary restarts on computers with limited hardware resources.
Example of using the Deployment template
The Deployment template is used by each component to create its Deployment manifest. The core microservices reuse most of the configuration in the common chart's values.yaml file, minimizing the need for component-specific configuration, while the other components override more of these values in their own values.yaml file.
To see the Deployment manifest generated for a core component, for the product microservice, run the following commands:
cd $BOOK_HOME/Chapter16/kubernetes/helm
helm dependency update components/product
helm template components/product -s templates/deployment.yaml
To see the Deployment manifest generated for a component that overrides the settings in the common chart, for the MongoDB component, run the following commands:
cd $BOOK_HOME/Chapter16/kubernetes/helm
helm dependency update components/mongodb
helm template components/mongodb -s templates/deployment.yaml
Expect output from the helm template command like:
---
# Source: mongodb/templates/deployment.yaml
apiVersion: apps/v1
kind: Deployment
metadata:
  name: mongodb
  labels:
    app.kubernetes.io/name: mongodb
    helm.sh/chart: mongodb-1.0.0
    app.kubernetes.io/managed-by: Helm
spec:
  replicas: 1
  selector:
    matchLabels:
      app.kubernetes.io/name: mongodb
  template:
    metadata:
      labels:
        app.kubernetes.io/name: mongodb
    spec:
      containers:
        - name: mongodb
          image: "registry.hub.docker.com/library/mongo:4.4.2"
          imagePullPolicy: IfNotPresent
          ports:
            - containerPort: 27017
          resources:
            limits:
              memory: 350Mi
This concludes the walkthrough of the reusable named templates in the common chart. The files can be found in the folder $BOOK_HOME/Chapter16/kubernetes/helm/common.
Next, let's see how the component-specific charts are defined.
The components charts
The charts for the microservices and the resource managers are stored in the components folder and they all share the same file structure:
Chart.yamlexpresses a dependency on thecommonlibrary chart.- The
templatefolder contains two templates,deployment.yamlandservice.yaml. Both templates apply the corresponding named template from the common chart. For example, theservice.yamltemplate looks like:{{- template "common.service" . -}} - The
values.yamlfile contains settings specific to the microservice. For example, the values file for theauth-serverchart looks like:fullnameOverride: auth-server image: name: auth-server env: SPRING_PROFILES_ACTIVE: "docker" livenessProbe_enabled: true readinessProbe_enabled: trueThe
auth-serveronly needs to declare its name, Docker image, Spring profile, and that it wants to use the default configuration of the liveness and readiness probes.
The config server differs from the other charts in that it uses a ConfigMap to store the config-repo containing the configuration files for all the other microservices. In its template folder, it defines a template for a ConfigMap that is based on the named template in the common chart for ConfigMaps that we have already been introduced to:
{{- template "common.configmap_from_file" . -}}
The template expects to find the property files in the charts folder config-repo. To avoid duplicating the config-repo from $BOOK_HOME/Chapter16/config-repo, a soft link, also known as a symbolic link, has been created with the command:
cd $BOOK_HOME/Chapter16/kubernetes/helm/components/config-server
ln -s ../../../../config-repo config-repo
Since Git preserves soft links, you don't need to recreate the soft link – the git clone command makes it for you!
As already mentioned in the walkthrough of the common chart, the gateway service differs from the other microservices since it needs to expose a Service of type NodePort.
Besides the charts for the microservices, the components folder also contains charts for the databases, message broker, and Zipkin server we use. They are structured in the same way as for the microservices. Since the common templates have been designed to streamline the charts for the microservices, the other charts need to override more default values in values.yaml files compared to the microservices. For details, look into the values.yaml file in the following folders: mongodb, mysql, rabbitmq, and zipkin-server.
The environment charts
Finally, the dev-env and prod-env charts in the environments folder tie everything together to complete installation packages for a typical dev/test or staging/prod environment. Their Charts.yaml file contains dependencies on both the common chart and the charts in the components folder, and the template folder contains a secrets.yaml template for creating environment-specific credentials as Secrets. It is based on the named template for Secrets from the common chart as:
{{- template "common.secrets" . -}}
Looking into the dev-env charts values.yaml file, we can find the following Secret values being defined for the Secret config-server-secrets:
secrets:

  config-server-secrets:
    ENCRYPT_KEY: my-very-secure-encrypt-key
    SPRING_SECURITY_USER_NAME: dev-usr
    SPRING_SECURITY_USER_PASSWORD: dev-pwd
This will result in the Secret config-server-secrets containing three Secret values, all Base64 encoded. Its manifest will look like:
apiVersion: v1
kind: Secret
metadata:
  name: config-server-secrets
  labels:
    ...
type: Opaque
data:
  ENCRYPT_KEY: bXktdmVyeS1zZWN1cmUtZW5jcnlwdC1rZXk=
  SPRING_SECURITY_USER_NAME: ZGV2LXVzcg==
  SPRING_SECURITY_USER_PASSWORD: ZGV2LXB3ZA==
Note that this values.yaml file contains sensitive information, for example the encrypt key used by the config server and the password used to access the config server. This file must be stored in a secure way. An alternative, if it is inappropriate to store this file securely, is to remove the sensitive information from this file and supply the sensitive information when the helm install command is executed.
To use the Secret in the Deployment manifest for the config server, the following is defined in the dev-env charts values.yaml file:
config-server:
  envFromSecretRefs:
    - config-server-secrets
This will be used by the Deployment template described above to add the Secret as environment variables in the Deployment manifest for the config server.
The prod-env chart overrides more values than the dev-env chart. For example, the values.yaml file in the prod-env chart specifies that an extra Spring profile, prod, should be used and what version to use for the Docker images. This looks like the following for the product microservice:
product:
  image:
    tag: v1
  env:
    SPRING_PROFILES_ACTIVE: "docker,prod"
With this introduction to what the various types of charts contain, let's move on and use them together with the Helm commands we learned about to deploy our microservices in Kubernetes!
Deploying to Kubernetes for development and test
In this section, we will deploy the microservices in an environment to be used for development and test activities, for example, system integration tests. This type of environment is used primarily for functional tests and is therefore configured to use minimal system resources and the latest available versions of the microservices' Docker images.
To be able to run functional tests, we will deploy the microservices together with the resource managers they require in the same Namespace, which we will call hands-on. This makes it easy to set up a test environment, but also to remove it once we are done with it. We can simply delete the Namespace to get rid of all resources used by the test environment. This deployment scenario is illustrated by the following diagram:
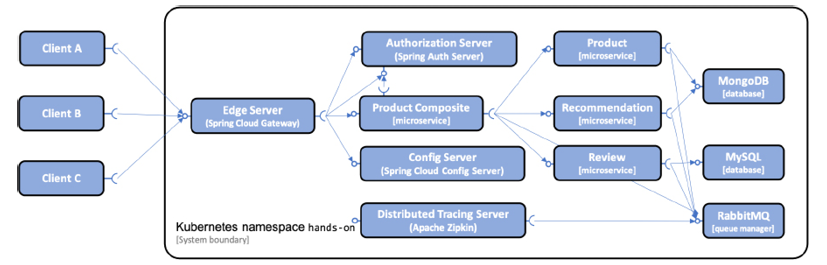
Figure 16.2: Resource managers deployed in the same Kubernetes Namespace as the microservices in the dev environment
Before we can deploy the system landscape, we need to build our Docker images and resolve the dependencies for our Helm charts.
Building Docker images
Normally, we have to push images to a Docker registry and configure Kubernetes to pull images from the registry. In our case, where we have a local single Node cluster, we can shortcut this process by pointing our Docker client to the Docker engine in Minikube and then running the docker-compose build command. This will result in the Docker images being immediately available to Kubernetes. For development, we will be using latest as the Docker image version for the microservices.
You can build Docker images from source as follows:
cd $BOOK_HOME/Chapter16
eval $(minikube docker-env)
./gradlew build && docker-compose build
The eval $(minikube docker-env) command directs the local Docker client to communicate with the Docker engine in Minikube.
The docker-compose.yml file has been updated to specify a name for the Docker images it builds. For example, for the product service, we have the following:
  product:
    build: microservices/product-service
    image: hands-on/product-service
latest is the default tag for a Docker image name, so it is not specified.
With the Docker images built, it's time to build the Helm charts.
Resolving Helm chart dependencies
First, we update the dependencies in the components folder:
for f in kubernetes/helm/components/*; do helm dep up $f; done
Next, we update the dependencies in the environments folder:
for f in kubernetes/helm/environments/*; do helm dep up $f; done
Finally, we verify that the dependencies for the dev-env folder look good:
helm dep ls kubernetes/helm/environments/dev-env/
Expect the command to respond with:

Figure 16.3: Helm chart dependencies resolved
With both Docker images built and Helm dependencies resolved, we can start deploying to Kubernetes!
Deploying to Kubernetes
A deploy to Kubernetes means creating or updating Kubernetes objects. We will use Helm to perform the deployment, per the following steps:
- To avoid a slow deployment process due to Kubernetes downloading Docker images (potentially causing the liveness probes we described previously to restart our Pods), run the following
docker pullcommands to download the images in advance:eval $(minikube docker-env) docker pull mysql:5.7.32 docker pull mongo:4.4.2 docker pull rabbitmq:3.8.11-management docker pull openzipkin/zipkin:2.23.2 - Before using the Helm charts, render the templates using the
helm templatecommand to see what the manifests will look like:helm template kubernetes/helm/environments/dev-envNote that no interaction was performed with the Kubernetes cluster, so cluster information will be faked, and no tests are run to verify whether the rendered manifest will be accepted by the cluster.
- To also verify that the Kubernetes cluster will actually accept the rendered manifest, a dry run of the installation can be performed by passing
–-dry-runto thehelm installcommand. Passing the--debugflag will also show which user-supplied and calculated values Helm will use when rendering the manifests. Run the following command to perform a dry run:helm install --dry-run --debug hands-on-dev-env kubernetes/helm/environments/dev-env - To initiate the deployment of the complete system landscape including creating the Namespace,
hands-on, run the following command:helm install hands-on-dev-env kubernetes/helm/environments/dev-env -n hands-on --create-namespaceNote that here is where the Helm machinery kicks in. It will use the charts we walked through in the Introducing Helm section above to render and apply the Kubernetes manifests, resulting in the required Kubernetes objects for the deployment being created.
- Set the newly created Namespace as the default Namespace for
kubectl:kubectl config set-context $(kubectl config current-context) --namespace=hands-on - To see the Pods starting up, run the command:
kubectl get pods --watchThis command will continuously report when new Pods are Running, and if something goes wrong it will report the status, for example Error and CrashLoopBackOff. After a while, you will probably see that errors are reported for the gateway, product-composite, and zipkin-server Pods. The reason for this is that they all depend on external resources that they require to be accessible during the startup. If not, they will crash. The gateway and product composite service depend on the auth server, and the Zipkin server depends on access to RabbitMQ. Typically, they start up faster than the resources they rely on, causing this situation. However, Kubernetes will detect the crashed Pods and they will be restarted. Once the resources are up and running, all Pods will start up and be reported as ready, showing 1/1 in the READY column. A typical output from the command looks like:

Figure 16.4: Pods restarted until external dependencies are ready
After seeing some output like the above, interrupt the command with Ctrl+C.
- Wait for all the Pods in the Namespace to be ready with the command:
kubectl wait --timeout=600s --for=condition=ready pod --allExpect the command to respond with eleven log lines like
pod/... condition met, where the three dots (...) are replaced with the name of the actual Pod that is reported to be ready. - To see the Docker images that are used, run the following command:
kubectl get pods -o json | jq .items[].spec.containers[].imageThe response should look like the following:
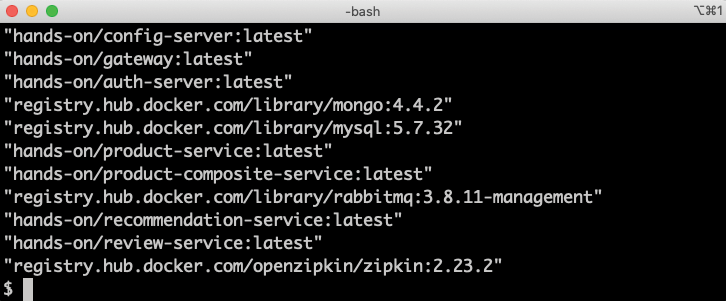
Figure 16.5: Docker images used in a test environment
Note that the Docker images have the version tag set to latest for the microservices.
We are now ready to test our deployment! But before we can do that, we need to go through changes that are required in the test script for use with Kubernetes.
Changes in the test script for use with Kubernetes
To verify the deployment, we will, as usual, run the test script, test-em-all.bash. To work with Kubernetes, the circuit breaker tests have been slightly modified. The circuit breaker tests call the actuator endpoints on the product-composite service to check their health state and get access to circuit breaker events. Since this endpoint isn't exposed externally, the previous chapters used the docker-compose exec command to run a curl command inside of the product-composite service to perform the tests.
Starting with this chapter, the test script can either use the docker-compose exec command or the corresponding kubectl command, kubectl exec, depending on if we are running the microservices using Docker Compose or Kubernetes.
To know which command to use, a new parameter has been added to the script, USE_K8S. It defaults to false. For details, see the testCircuitBreaker() function in the test script.
Testing the deployment
When launching the test script, we have to give it the address of the host that runs Kubernetes, that is, our Minikube instance, and the Node port where our gateway service listens for external requests. The gateway is accessible using port 30443. On a Mac, the minikube ip command can be used to find the IP address of the Minikube instance. On Windows running WSL 2, where we run the Minikube instances as a Docker container, the host is always localhost.
Start by setting up an environment variable for the hostname to use.
On macOS:
MINIKUBE_HOST=$(minikube ip)
On WSL2:
MINIKUBE_HOST=localhost
Then, start the tests with the following command:
HOST=$MINIKUBE_HOST PORT=30443 USE_K8S=true ./test-em-all.bash
In the output from the script, we see how the IP address of the Minikube instance is used, but besides that everything looks the same as when we used Docker Compose in the previous chapters:
Figure 16.6: Output from the automated tests of the system landscape
With the system landscape validations performed, let's see how we can test the new features in Spring Boot, graceful shutdown, and the probes for liveness and readiness.
Testing Spring Boot's support for graceful shutdown and probes for liveness and readiness
In this section, we will test out the new Spring Boot features and see how they interact with other components in Kubernetes.
Let's start with testing Spring Boot's support for graceful shutdown where the application during its shutdown phase will wait a configurable length of time for active requests to complete. Remember that no new requests are allowed during the shutdown phase.
To test the graceful shutdown mechanism, we will run a client that continuously sends requests to the composite service. First, we will use it to send requests that take 5 seconds, a shorter amount of time than the shutdown wait period. The wait period is configured to be 10 seconds. Next, we will use it to send requests that take a longer time, 15 seconds, to see how they are handled. As the test client, we will use Siege, a command line-based load test tool.
To be able to test run requests that take this long to complete, we need to temporarily increase the timeout in the product-composite service. Otherwise, its circuit breaker will kick in and prevent us from running the long requests. To increase the timeout in the composite service, perform the following steps:
- Add the following under the
product-compositesection in the values file for thedev-env,kubernetes/helm/environments/dev-env/values.yaml:env: RESILIENCE4J_TIMELIMITER_INSTANCES_PRODUCT_TIMEOUTDURATION: 20sAfter the change, the configuration file should look like:
product-composite:
  env:
    RESILIENCE4J_TIMELIMITER_INSTANCES_PRODUCT_TIMEOUTDURATION: 20s
  envFromSecretRefs:
    - config-client-credentials
As long as this setting is active, the circuit breaker tests in
test-em-all.bashwill no longer work since they assume a timeout of 2 seconds. - Update the Helm installation using Helm's
upgradecommand, using the--waitflag to ensure that the update is completed when the command terminates:helm upgrade hands-on-dev-env -n hands-on kubernetes/helm/environments/dev-env --wait
Now we can run the tests, proceeding with the following steps to test with requests that are shorter than the shutdown wait period:
- Get an access token:
ACCESS_TOKEN=$(curl -d grant_type=client_credentials
 -ks https://writer:secret@$MINIKUBE_HOST:30443/oauth2/token
 | jq .access_token -r)
Ensure you got an access token by issuing the command
echo $ACCESS_TOKEN. If it's empty, you have to check thecurlcommand above and the logs from the gateway and the auth server. - Make a test request and ask for a delay of 5 seconds using the
delayquery parameter:time curl -kH "Authorization: Bearer $ACCESS_TOKEN" https://$MINIKUBE_HOST:30443/product-composite/1?delay=5If you get a normal response and the
timecommand reports a 5 second response time, the config changes of the increased timeout worked! - Use Siege to start requests that take 5 seconds to complete, with five concurrent users sending requests with a random delay between 0 and 2 seconds to spread the requests a bit:
siege -c5 -d2 -v -H "Authorization: Bearer $ACCESS_TOKEN"
  https://$MINIKUBE_HOST:30443/product-composite/1?delay=5
Expect output from the tool for each completed request like:
HTTP/1.1 200 5.04 secs: 771 bytes ==> GET /product-composite/1?delay=5 - Watch log output from the
productservice in a separate terminal window with the command:kubectl logs -f --tail=0 -l app.kubernetes.io/name=product - We will now ask Kubernetes to restart the
productdeployment. The restart will first start a new Pod before the old one is shut down, meaning that none of the requests sent by Siege should be affected by the restart. Of specific interest are the few requests that are processed by the old Pod when it starts to shut down. If the graceful shutdown works as expected, none of the active requests should fail. Perform the restart by running the following command in a separate window:kubectl rollout restart deploy/product - Ensure that there are only successful requests reported in the output from the load test tool, Siege, reporting 200 (OK).
- In the log output from the now stopped
productPod, you should see that all requests were allowed to terminate gracefully before the application was stopped. Expect log output like the following, at the end of the log output: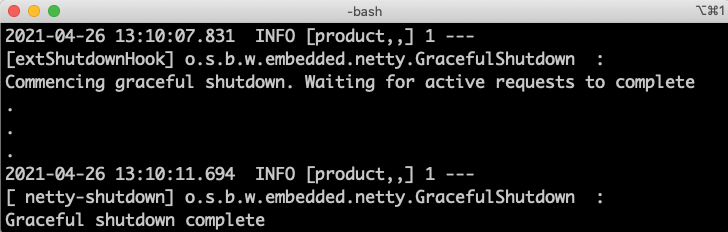
Figure 16.7: Graceful shutdown where all requests are allowed to complete
Specifically, note the time between the two log messages (4 seconds in this case), indicating that the shutdown procedure actually waited for the last request to complete.
Now let's run the second test, with requests taking a longer time to complete than the shutdown wait period:
- Restart Siege, requesting longer response times, above the wait limit of 10 seconds. Start five concurrent users asking for a 15 second response time and random delay between the requests of 0-5 seconds. Stop Siege with Ctrl+C and run the following command:
siege -c5 -d5 -v -H "Authorization: Bearer $ACCESS_TOKEN" https://$MINIKUBE_HOST:30443/product-composite/1?delay=15 - Watch the log output from the
productPod with the command:kubectl logs -f --tail=0 -l app.kubernetes.io/name=product - Restart the
productdeployment:kubectl rollout restart deploy/product - Follow the log output from the
productPod. Once it has shut down, you should be able to see that not all requests were allowed to terminate gracefully before the application was stopped. Expect log output like the following, at the end of the log output: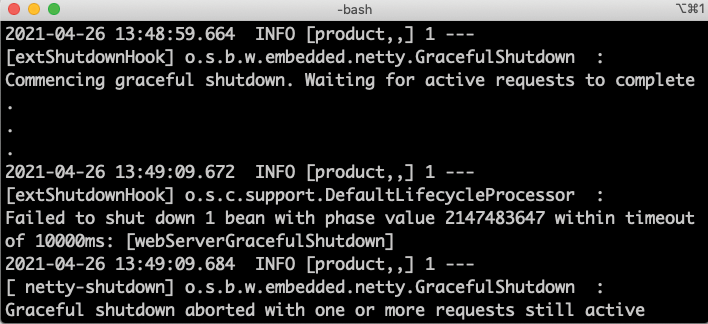
Figure 16.8: Graceful shutdown where some long-running requests are aborted
The log message Graceful shutdown aborted with one or more requests still active indicates that at least one request was not allowed to complete before the application was stopped.
- In the output from the load test tool, Siege, there should now appear one or a few failing requests reporting 500 (Internal Server Error) like:

Figure 16.9: Long-running requests fail during shutdown
This demonstrates how the shutdown procedure proceeds after the configured wait time and that the remaining long-running requests are aborted, as expected.
This completes the tests of Spring Boot's graceful shutdown mechanism, clearly useful to avoid normal client requests being affected by Pods being stopped, for example as a result of scaling down or a rolling upgrade being performed.
Clean up after the tests:
- Stop the Siege load test tool with Ctrl+C
- Roll back the latest Helm release to get rid of the increased timeout:
helm rollback hands-on-dev-env -n hands-on –waitThe
helm rollbackcommand is also useful for rolling back a failed upgrade. - Also remove the increased timeout setting in the file
kubernetes/helm/environments/dev-env/values.yaml - Run
test-em-all.bashto verify that the configuration is rolled back:HOST=$MINIKUBE_HOST PORT=30443 USE_K8S=true ./test-em-all.bash
Finally, let's see what information the Spring Boot liveness and readiness probes report. We will use the product service, but feel free to also try out the probes for the other services:
- Run the following command to get the output from the
productservice's liveness probe:kubectl exec -it deploy/product -- curl localhost/actuator/health/liveness -s | jq .Expect it to respond with:

Figure 16.10: Response from a liveness probe
- Run the following command to get the output from the
productservice's readiness probe:kubectl exec -it deploy/product -- curl localhost/actuator/health/readiness -s | jq .Expect its response to be a bit more extensive:

Figure 16.11: Response from a readiness probe
From the output above, we can confirm that the readiness of the
productnow depends on its access to both MongoDB and RabbitMQ. This is expected, since we configured the readiness health group to include health indicators for RabbitMQ, MongoDB, and SQL databases, if available. See the section Using Spring Boot's support for graceful shutdown and probes for liveness and readiness to recap, if required.
Before we move on, let's clean up what we have installed in the development environment. We can do this by simply deleting the Namespace. Deleting the Namespace will recursively delete the resources that exist in the Namespace, including information regarding the Helm installation.
Delete the Namespace with the following command:
kubectl delete namespace hands-on
If you just want to uninstall what the helm install command installed, you can run the command helm uninstall hands-on-dev-env.
With the development environment removed, we can move on and set up an environment targeting staging and production.
Deploying to Kubernetes for staging and production
In this section, we will deploy the microservices in an environment for staging and production usage. A staging environment is used for performing quality assurance (QA) and user acceptance tests (UATs) as the last step before taking a new release into production. To be able to verify that the new release not only meets functional requirements but also non-functional requirements, for example, in terms of performance, robustness, scalability, and resilience, a staging environment is configured to be as similar as possible to the production environment.
When deploying to an environment for staging or production, there are a number of changes required compared to when deploying for development or tests:
- Resource managers should run outside of the Kubernetes cluster: It is technically feasible to run databases and queue managers for production use on Kubernetes as stateful containers using
StatefulSetsandPersistentVolumes. At the time of writing this chapter, I recommend against it, mainly because the support for stateful containers is relatively new and unproven in Kubernetes. Instead, I recommend using the existing database and queue manager services on-premises or as managed services in the cloud, leaving Kubernetes to do what it is best for: running stateless containers. For the scope of this book, to simulate a production environment, we will run MySQL, MongoDB, and RabbitMQ as plain Docker containers outside of Kubernetes using the already existing Docker Compose files. - Lockdown:
- For security reasons, things like
actuatorendpoints and log levels need to be constrained in a production environment. - Externally exposed endpoints should also be reviewed from a security perspective. For example, access to the configuration server should most probably be locked down in a production environment, but we will keep it exposed in this book for convenience.
- Docker image tags must be specified to be able to track which versions of the microservices have been deployed.
- For security reasons, things like
- Scale up available resources: To meet the requirements of both high availability and higher load, we need to run at least two Pods per deployment. We might also need to increase the amount of memory and CPU that are allowed to be used per Pod. To avoid running out of memory in the Minikube instance, we will keep one Pod per Deployment but increase the maximum memory allowed in the production environment.
- Set up a production-ready Kubernetes cluster: This is outside the scope of this book, but, if feasible, I recommend using one of the managed Kubernetes services provided by the leading cloud providers. For the scope of this book, we will deploy to our local Minikube instance.
This is not meant to be an exhaustive list of things that have to be considered when setting up an environment for production, but it's a good start.
Our simulated production environment will look as follows:

Figure 16.12: Resource managers deployed outside of Kubernetes
Changes in the source code
The following changes have been applied to the source code to prepare for deployment in an environment that's used for staging and production:
- A Spring profile named
prodhas been added to the configuration files in theconfig-repoconfiguration repository:spring.config.activate.on-profile: prod - In the
prodprofiles, the following have been added:- URLs to the resource managers that run as plain Docker containers:
spring.rabbitmq.host: 172.17.0.1
spring.data.mongodb.host: 172.17.0.1
spring.datasource.url: jdbc:mysql://172.17.0.1:3306/review-db
We are using the
172.17.0.1IP address to address the Docker engine in the Minikube instance. This is the default IP address for the Docker engine when creating it with Minikube, at least for Minikube up to version 1.18.There is work ongoing for establishing a standard DNS name for containers to use if they need to access the Docker host they are running on, but at the time of writing this chapter, this work effort hasn't been completed.
- Log levels have been set to warning or higher, that is, error or fatal. For example:
logging.level.root: WARN
- The only
actuatorendpoints that are exposed over HTTP are theinfoandhealthendpoints that are used by the liveness and readiness probes in Kubernetes, as well as thecircuitbreakereventsendpoint that's used by the test script,test-em-all.bash:management.endpoints.web.exposure.include: health,info,circuitbreakerevents
In a real-world production environment, we should also have changed the
imagePullPolicy: Neversetting toIfNotPresent, to download Docker images from a Docker registry. But since we will be deploying the production setup to the Minikube instance where we manually build and tag the Docker images, we will not update this setting. - URLs to the resource managers that run as plain Docker containers:
Deploying to Kubernetes
To simulate the use of production-grade resource managers, MySQL, MongoDB, and RabbitMQ will run outside of Kubernetes using Docker Compose. We start them up as we did in the previous chapters:
eval $(minikube docker-env)
docker-compose up -d mongodb mysql rabbitmq
We also need to tag the existing Docker images with v1 using the following commands:
docker tag hands-on/auth-server hands-on/auth-server:v1
docker tag hands-on/config-server hands-on/config-server:v1
docker tag hands-on/gateway hands-on/gateway:v1
docker tag hands-on/product-composite-service hands-on/product-composite-service:v1
docker tag hands-on/product-service hands-on/product-service:v1
docker tag hands-on/recommendation-service hands-on/recommendation-service:v1
docker tag hands-on/review-service hands-on/review-service:v1
From here, the commands are very similar to how we deployed to the development environment.
- Deploy using Helm:
helm install hands-on-prod-env kubernetes/helm/environments/prod-env -n hands-on --create-namespace - Wait for the deployments to be up and running:
kubectl wait --timeout=600s --for=condition=ready pod --all - To see the Docker images that are currently being used in the production environment, run the following command:
kubectl get pods -o json | jq .items[].spec.containers[].imageThe response should look something like the following:

Figure 16.13: Docker images used in a prod environment
Note the
v1version of the Docker images!Also note that the resource manager Pods for MySQL, MongoDB, and RabbitMQ are gone; these can be found with the
docker-compose pscommand. - Run the test script,
test-em-all.bash, to verify the simulated production environment:CONFIG_SERVER_USR=prod-usr CONFIG_SERVER_PWD=prod-pwd HOST=$MINIKUBE_HOST PORT=30443 USE_K8S=true ./test-em-all.bashRemember that the environment variable,
MINIKUBE_HOST, must be set for the hostname to use according to the following:- On macOS:
MINIKUBE_HOST=$(minikube ip) - On WSL2:
MINIKUBE_HOST=localhost
- On macOS:
Expect the same type of output that we got when the test script was run against the development environment.
That completes the tests; let's clean up so that the Kubernetes environment is ready for the next chapter.
Cleaning up
To delete the resources that we used, run the following commands:
- Delete the Namespace:
kubectl delete namespace hands-on - Shut down the resource managers that run outside of Kubernetes:
eval $(minikube docker-env)
docker-compose down
As already described earlier in this chapter, the kubectl delete namespace command will recursively delete all Kubernetes resources that existed in the Namespace, and the docker-compose down command will stop MySQL, MongoDB, and RabbitMQ. With the production environment removed, we have reached the end of this chapter.
Summary
In this chapter, we learned how to deploy the microservices in this book on Kubernetes using Helm. We have seen how Helm can be used to create reusable templates minimizing the boilerplate code required to create the Kubernetes manifests. Reusable templates are stored in a common chart, while microservice-specific charts provide values specific to each microservice. At the top level, we have parent charts that describe how a dev/test and stage/production environment should be deployed using the microservice charts, optionally together with charts for resource managers such as databases and queue managers.
We have also seen how we can benefit from using Spring Boot features to facilitate deployments to Kubernetes. Spring Boot's support for graceful shutdown can be used to allow active requests to complete before a Spring Boot-based microservice is stopped, for example during a rolling upgrade. The support for liveness and readiness probes makes it easy to declare probes that are aware of the availability of external resources that a specific microservice depends on.
Finally, to be able to deploy our microservices in Kubernetes, we had to replace Netflix Eureka with the built-in discovery service in Kubernetes. Changing the discovery service was done without any changes in the Java source code – all we had to do was apply changes to the build dependencies and some of the configuration.
In the next chapter, we will see how we can further utilize Kubernetes to reduce the number of supporting services we need to deploy in Kubernetes. Head over to the next chapter to see how we can eliminate the need for the configuration server and how our edge server can be replaced by a Kubernetes Ingress controller.
Questions
- Why did we remove the Eureka server from the microservice landscape when deploying it on Kubernetes?
- What did we replace the Eureka server with and how was the source code of the microservices affected by this change?
- What's the purpose of liveness and readiness probes?
- How is Spring Boot's mechanism for graceful shutdown useful?
- What is the purpose of the following Helm template directives?
{{- $common := dict "Values" .Values.common -}} {{- $noCommon := omit .Values "common" -}} {{- $overrides := dict "Values" $noCommon -}} {{- $noValues := omit . "Values" -}} {{- with merge $noValues $overrides $common -}} - Why would the following named Helm template fail?
{{- define "common.secrets" -}} {{- range $secretName, $secretMap := .Values.secrets }} apiVersion: v1 kind: Secret metadata: name: {{ $secretName }} labels: app.kubernetes.io/name: {{ $secretName }} type: Opaque data: {{- range $key, $val := $secretMap }} {{ $key }}: {{ $val | b64enc }} {{- end }} {{- end -}} {{- end -}} - Why would the following manifests not work together?
apiVersion: v1 kind: Service metadata: name: review labels: app.kubernetes.io/name: review spec: type: ClusterIP ports: - name: http port: 80 protocol: TCP targetPort: http selector: app.kubernetes.io/pod-name: review --- apiVersion: apps/v1 kind: Deployment metadata: name: review labels: app.kubernetes.io/name: review spec: replicas: 1 selector: matchLabels: app.kubernetes.io/name: review template: metadata: labels: app.kubernetes.io/name: review spec: containers: - name: review image: "hands-on/review-service:latest" ports: - containerPort: 80 name: http-port protocol: TCP - What is going on here?

Figure 16.14: What is going on here?