Now that you've started to put data into Microsoft CRM, you're ready to get that data out. An easy way to analyze data in Microsoft CRM is to run a report. But what if one of the pre-installed reports isn't what you're looking for? In fact, experience tells us that it's very unlikely that the prebuilt reports are going to be exactly what you want. So what now?
Prior to Microsoft CRM 4, custom report creation was left to people who could author reports in SQL Reporting. Not an easy task for the average user. But don't worry, because version 4 has a built-in Report Wizard. The Report Wizard is simple to use, especially if you're familiar with using Advanced Find. (See Chapter 3 for more on Advanced Find.)
The Report Wizard provides limited design features. Designing reports with the Report Wizard allows for grouping and sub-grouping of data, column selection, some data summary, and graphing. Reports with graphs can also have the additional capability of drilling down to the details that represent the graph.
In Microsoft CRM, you can aggregate reports by category. Out of the box, there are four categories: Sales, Service, Administrative, and Marketing. You can add your own categories to the list as well. Although you can find reports in more than one category, Microsoft has segregated the reports based on the following:
Sales reports: Collect all the activities associated with a sale, from the lead through the actual sale. These reports can also provide statistical information about accounts, lead sources, competitors, and products.
Service reports: Provide statistical information related to contracts, cases, and summaries of knowledge base articles. These reports provide quick analyses of which products require the most support and where your service representatives are spending the most time.
Administrative reports: Provide summary information about your Microsoft CRM users.
Marketing reports: Describe accounts, campaigns, lead source effectiveness, and other areas of interest to the marketing department. The reports provide summary and detail information across accounts, campaigns, and lead sources.
You can add your own report categories. To do so, follow these steps:
In the navigation pane, click Settings.
The Settings navigation options appear at the top of the navigation pane.
In the navigation pane, click the Administration icon.
The Administration options are now available on the right.
In the Administration pane on the right, click System Settings.
Settings are divided by tabs. Click the Reporting tab on the right.
Click Add on the right.
Create the new category.
For our scenario, we added a category called Stephanie's Reports.
Click OK.
Click OK on the bottom.
Your new category appears in the report area.
Prior to designing our first report, let's take a look at the report area of Microsoft Dynamics CRM. To access the report area, follow these steps:
The top right of the report screen has the View drop-down list, like all other areas in Microsoft CRM. In this case the values in the drop-down list include the report categories.
The report toolbar has several icons. From the right, the first icon is More Actions. Clicking the More Actions icon reveals a menu with the following options:
Run Report: Run report is obvious and works in the same manner as double-clicking the report.
Edit Default Filter: When you add reports to the system, they're filtered to display the data desired. Microsoft CRM allows the user to edit the filter at runtime; that way, the user can customize the data displayed without actually editing the report. In the More Actions menu, Edit Default Filter allows the system administrator a way to edit the default filter used by the report at runtime, should the user not edit the filter.
To understand report filtering, first run a report without filtering:
Double-click the Account Overview report.
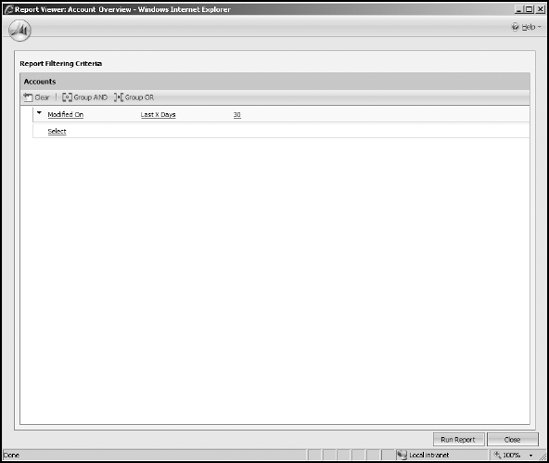
The Report filtering criteria appears. (See Figure 10-1.) You could change the default filtering now, but don't do so just yet.
Click Clear at the top left.
This removes all filtering for the report.
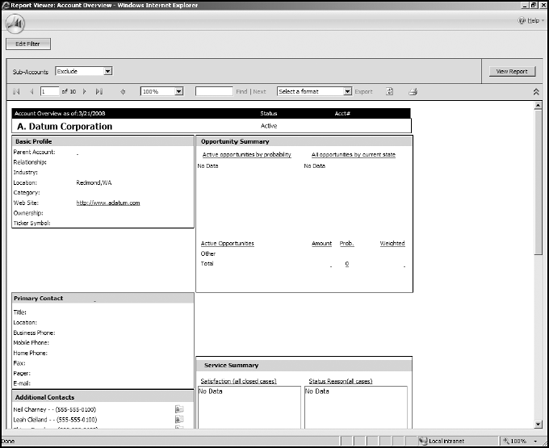
Click Run Report on the bottom right.
The report's listing now appears on the right. (See Figure 10-2.)
From the report screen, click Edit Filter on the top left.
The report filtering window appears. Defining the filter criteria is much like working with Advanced Find. (See Chapter 3 for more on Advanced Find.) In this example, we filter the company name.
Click Select and choose Account Name.
For this example, we filter the report based on Account Name. However, you can choose a different field based on your filtering requirements.
Make sure the operator shown is Equals.
If you need to change the operator from equals, simply click the word Equals.
Because you chose Equals, this value must match exactly the company name in the account area. Choose your operator carefully. If you want to return all records in which the company name begins with the letter
A, you would choose Begins With and not Equals. To learn more about selecting the proper operator, see Chapter 3.Place mouse over Enter Value and type a company name.
If necessary, you can add more sophisticated filtering prior to running the report. To do so, click Select below your first criteria and repeat steps 5-7.
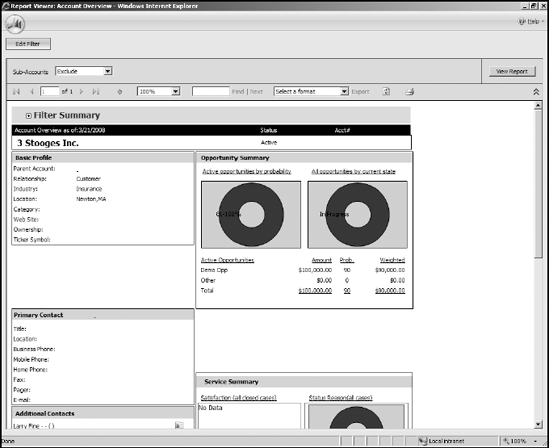
Click Run Report on the bottom right.
Figure 10-3 shows a filtered report based on the Account Name.
Note
Reports are also filtered based on user security. This happens regardless of the filter criteria chosen. Therefore, users running reports will only have access to records via the reports that they can access via the CRM interface.
From the More Actions menu, the Edit Default filter allows the system administrator a way to edit the default filter used by the report at runtime, should the user not edit the filter. Follow the preceding steps for filtering a report to edit the default filter (after you've chosen Edit Default Filter from the More Actions menu).
Schedule Report: This is a wonderful way to create a report snapshot. Report snapshots are analogous to pictures in that they are frozen in time. When a snapshot is created, it preserves the report and data at the time the snapshot was created. Rerunning a report snapshot, then, shows the same data every time. This is in contrast to running the actual report, which will dynamically update the report with the most current data.
Warning
Reports snapshots cannot be created unless the Microsoft CRM Connector for SQL Reporting Services is installed. If you try to create a snapshot and receive such an error message, speak with your Microsoft CRM partner.
Microsoft CRM allows for eight snapshots per report. You can create snapshots manually or via a schedule. To create a report snapshot, follow these steps:
On the Report area toolbar, select More Actions
Schedule Report.
The Schedule Report Wizard runs.
Select either On Demand or On a Schedule.
Both are similar; however, On Demand has fewer options. In this list, I choose On a Schedule.
Click Next.
The Select Frequency form opens. The schedule varies based on the selection on the left.
Create a schedule for your report and click Next.
Depending on your selection in Step 4, pick start and/or end dates.
Click Next.
The Define Report Parameters form is displayed.
Fill in the appropriate parameters. If you don't need to edit the default filter, click Next; otherwise, edit the default filter.
Review the snapshot criteria and click Create.
Click Finish.
Sharing: Sharing is the last option in More Actions. Remember that snapshots contain data. They have the data that was available to the user who created the snapshot. Sharing the report with a user who otherwise wouldn't have access to sensitive data when running the report means that user now has access to that data when viewing a snapshot.
The other report toolbar icons work like their brethren on other forms, and we don't cover them in this chapter.
After you've run the report, you may have noticed the viewing options just above the report. Let's take a look at all those options. (Depending on the report you're running, not all of the options that follow are displayed.)
Group By: Group By options vary by report. Choose this to group report data.
Page navigation: If your report has more than one page, you can move through them using these VCR-type controls. From left to right, the first button (First Page) takes you to page one of the report. The next button (Previous Page) takes you back one page from the page currently displayed. The third button (Next Page) takes you to the next page. The last button (Last Page) takes you to the last page of the report. The display between the second and third button tells you the page you're on and the total page count.
Display size: Next to the navigation options is a box showing the size of the display. Click the arrow for the drop-down list to modify the size of the report.
Find|Next: This field enables you to search for specific text in the report. You can use * as a wildcard to search partial text. (For example, typing Mart* will find Martin.) Just fill in the Find field and click Find. You're taken to the first result. To move to the second result, click Next.
Tip
If the text you enter in the Find field appears in the report on a page previous to the one you're viewing on the screen, the search will come up empty. So, when conducting a search using the Find field, always jump to the first page of the report before clicking Find.
Tip
You can drill down on summary reports (or graphs) to see the underlying detail. For example, if you open the Sales Pipeline report, you see a single bar in the graph. Change the Group By to Sales User and click View Report. You now have multiple bars representing your sales team. Click a bar and you're presented with a table of data representing the selected bar. Move your mouse over any of the items in the left column (Opportunity). Your mouse turns into a hand. Click and drill all the way down to the actual opportunity record.
Exporting report data is just what it sounds like — the movement of data from inside Microsoft CRM to outside Microsoft CRM. Let's look at exporting your spiffy report.
Printing is a form of exporting. To print your report, just click the little printer icon in the line above the report. You'll get the basic Print dialog window, where you can make the usual selections.
For the most part, when we use the term export in this business, it describes sending the data to another application. In Microsoft CRM's case, the data doesn't export to just Microsoft products. You can create your report in HTML (good for display on your company Web site) or export it to an Adobe Acrobat file.
Follow these steps to export a report:
With the report on the screen in the Report Viewer window, click the Export drop-down list and select the application.
Your choices are HTML, Excel, Web Archive, Acrobat, TIFF, CSV (comma delimited), and XML.
Click the word Export.
You see a familiar screen, asking whether you want to open the file or save it to disk. Your computer thinks you're downloading a file from a Web site, so you're asked whether you want to open it or save it. If you choose to open it, you have the option to save it from the report window.
Decide whether to open or save the file and then click OK.
After a moment, your report opens in the format you selected.
Note
When you select one of the export formats, the associated application opens and displays the report. Interestingly, no matter which selection you make, the report opens in a browser window. (Remember that Microsoft CRM is browser based.) So, for example, if you select Microsoft Excel as the export format, the report opens in essentially a browser version of Excel, and all of Excel's menus will be available.
Microsoft CRM 4 uses SQL Server 2005 Reporting Services as its primary reporting tool. Should you desire to learn the Reporting Services design tool, you will need Microsoft Visual Studio. You can find a free version at www.asp.net. We suggest you try the Report Wizard first, as it is much easier to learn. So read on.
Before designing a report with the Report Wizard, we suggest you sketch your design. After doing so, you're ready to create a report with the Report Wizard.
If you read the "Navigating the Report Area" section earlier in the chapter, you now know your way around the report area in Microsoft CRM, and you're ready to create a new report.
What is our scenario for this report? The sales manager of Mega Corp, Stephanie, would like to create an opportunity pipeline report, grouping data by sales person or owner and sub-grouping by state and ordering by revenue. She has three sales people; Zach, Ethan, and Rachel. Let's take a look at how Stephanie would go about creating the report. Follow these steps:
In the navigation pane, click the Workplace button.
The Workplace navigation options appear at the top of the navigation pane.
In the navigation pane, click the Reports icon.
The reports listing is now available on the right.
Click New to Create a new Report.
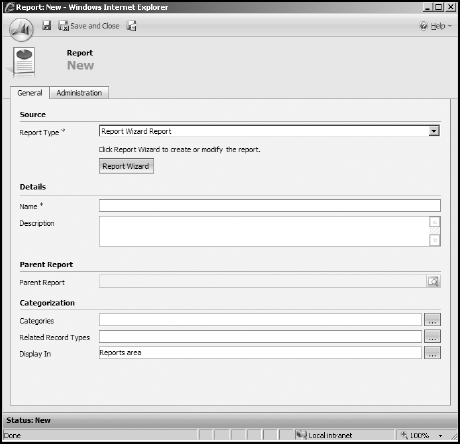
The Report: New dialog box opens. (See Figure 10-4.)
On the General tab, click the Report Wizard button.
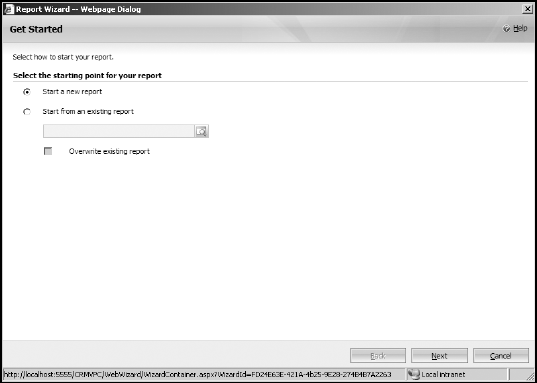
The Report Wizard dialog box opens. (See Figure 10-5.)
Select the Start a New Report radio button and click Next.
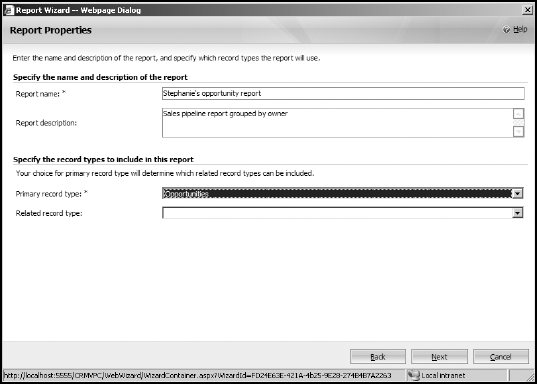
The Report Properties dialog box opens.
Enter a report name and description.
Select a primary record type. (See Figure 10-6.)
In our case, the Primary Record type that we select is Opportunities.
Leave the Related Record Type field blank for this report. You could add a related record if your report displays fields from a related entity.
Click Next.
The Report Filtering Criteria dialog box opens.
Click Clear icon to reset the report filter.
You can now enter your own filtering criteria. Of course, you don't have to click Clear in this step. Leave the default filtering criteria when it matches your desired filter criteria.
Note
Report filtering criteria can be changed at run-time. See the section, "Navigating the Reports Area," earlier in this chapter.
Click Next.
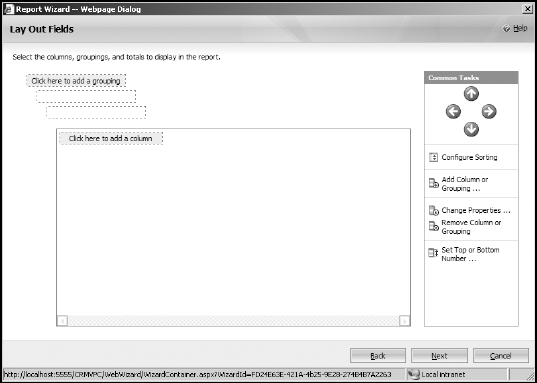
The Lay Out Fields dialog box opens.
Click "Click here to add a grouping" to set the report's highest level grouping (see Figure 10-7) and add a field to group by.
The Add Grouping dialog box opens. You can group your report in three levels. For example, group first by date, then by sales rep, and lastly by product.
In the Add Grouping dialog box, leave Opportunities in the record Type drop-down list. Select Owner in the Column field, and leave remainder of the fields as-is.
Click OK.
Back to the Lay Out Fields dialog box.
Click the "Click here to add a column" option.
The Add Column dialog box opens.
Select a Column for the report.
We're adding only Opportunity fields, so make sure the Record Type field says Opportunities. If you'd like to add fields from related entities, change the drop-down list to the desired entity. Select the field you'd like to have in the left-most column (Stephanie chose Topic), and set the column size. The largest column width is 300 pixels, and 25 pixels is the smallest. Add more columns as desired.
Click OK.
Repeat Steps 15 and 16 to add additional columns.
Click Next.
The Format Report dialog box is displayed.
Select Table Only or Chart and Table.
For now, select Table Only. You can't choose Chart and Table without a number field that is summarized; we cover that in the next numbered step list.
Tip
Summary choices relate to the type of number field.
Select Table only, click Next.
The Report Summary dialog box is displayed.
Click Next.
The Report Successfully Created dialog box opens.
Click Finish.
The report new/edit dialog box opens.
Before we alter the report settings, let's return to step 19 above, the one in which we chose Table Only. If we'd like to include a chart, we would have instead chosen Chart and Table. However, that option may not have been available to us. To access Chart and Table we need a field in the body of the report summarized. Let's back up to step 15 above and make the necessary changes so we can select Chart and Table.
Highlight an existing field and click Change Properties on the right.
The Edit Column Properties dialog box opens. Note, you MUST change the properties of a number field and not a text field. Otherwise you won't be able to perform 16a below.
Change the summary type to the option that best fits your data.
We chose Sum.
Click OK.
The dialog box closes.
Click Next.
The Chart and Table option is now available. Choose:
Show table below chart on same page: This displays the table and the chart on the same page.
Show chart. To view data for a chart region, click the chart region: This option lets you click on the chart and drill into the report table for the details not displayed by the chart.
Select a chart type. Click Next.
The Customize Chart Format dialog opens.
Depending on your selections in step 15, you'll be able to select which fields are displayed as data slices and values. Decide if you want to show data labels and legend and click Next.
The Report Summary dialog box opens.
Click Next.
Click Finish.
At this point we've created a new report using the report wizard. However, we're not done yet. We need to set up where we want to display the report, the associated categories, and several other options. Then we need to run the report to see if we're happy with how it looks.
When we click Finish (step 22 above) the New/Edit Report dialog box opens. (See Figure 10-4.) We're now ready to complete the remaining options on the form and run it.
The options on the General Tab are:
Report Type: Report Wizard Report, Existing File, or Link to Web Page. If you've followed the steps above and created a report using the Report Wizard, leave this alone. If you're adding a Microsoft SQL Reporting Service Report (SRS Report), then choose one of these options:
From Existing File: An "existing file" is a report already uploaded to your report server.
Link to Web Report: This choice lets you link to other reports that have not been uploaded to your Microsoft CRM report Web server.
Name: The report name. You can rename your report here. If you are naming a SRS report name, you'd be changing the display name in Microsoft CRM and not the actual name.
Description: Add any report description you deem appropriate.
Parent Report: This pertains to sub-reports that are totally or partially displayed in another report — the parent report. For our example, leave this field blank.
Categories: Select the categories under which your report can be found. To learn more about categories, see the section "Adding Report Categories," earlier in this chapter.
Related Record Types: This controls the location (lists and forms) in which the report will be available. For example, to ensure that this report is available in the local opportunities list (the reports available from the opportunity form), select Opportunities.
Display In: Controls where reports are displayed, as follows:
Forms for related record types: When a form is open, the report is accessed via the report icon on the form toolbar.
Lists for related record types: The report can be accessed from the local toolbar when viewing a list of data. To find the report list, click on an entity from the navigation bar, such as Accounts. A report icon is available on the toolbar above the list of records returned.
Reports area. The Reports area is where we began this chapter. Access the reports area by clicking Workplace on the navigation bar, then Reports.
Now you're ready to save the report and run it! Here's all you need to do:
Complete the report as necessary.
We want our report to be run from the Reports area and from the list of opportunities, so we completed the form as follows:
Related Record Type: Opportunities.
Display In: Lists for related record types and Reports area.
Click Save or Save and Close on the toolbar at the top of the form.
Click Run Report from the toolbar to view the report.
Your new report is displayed.
You can use the Report Wizard to edit reports created with the Report Wizard, but you can't use the Report Wizard to edit reports created elsewhere. That means that you would have to use Microsoft SQL Reporting Services to edit any report created with Microsoft SQL Reporting Services. Such reports aren't covered in this book.
Note
Only users with the appropriate rights can add, edit, or delete reports.
After you've created a report with the report wizard, you may want to make some changes to the report. To do so, follow these steps:
In the navigation pane, click the Workplace button.
The Workplace navigation options appear at the top of the navigation pane.
In the navigation pane, click the Reports icon.
The reports listing is now available on the right.
Highlight the report to be edited and click Edit Report on the toolbar above.
The Reports dialog box opens.
Click the Report Wizard button.
The Report Wizard appears.
Leave the default selections as they are and click Next.
Change the Report Name, Description, Primary Record, and Secondary Record Types and click Next.
Edit the report filter and click Next.
Click the group or column to change and click Change Properties.
You can change the Column Width field and Summary field (if it's a numeric field).
To remove a column or group, click it and click Remove Group or Column. Similarly, to add a group or column, click Add Group or Column.
Click Next.
Edit the layout and click Next.
Select the chart type (if your selection in Step 11 included a chart).
Customize chart type and click Next.
Click Next.
Click Finish.
The report now reflects your changes.
To remove a report from the report area, follow these steps:
Navigate to the report area.
Click the report you'd like to remove.
Click the black X on the report toolbar.
Confirm deletion.
Throughout the CRM system, you find the ever present Excel icon. Often in this book, we refer to the fact that you can export data from Microsoft CRM to Excel and further manipulate that data. When you've created an Excel spreadsheet that you'd like to run often with refreshed CRM data, you can do so by saving your Excel file as a report.
Let's say that Stephanie would like to create an Advance Find (refer to Chapter 3 for more on Advanced Find) to show opportunities closing in the next 30 days with estimated revenue greater than $50,000. She saves the Advance Find, which is now visible in the Opportunity view.
Stephanie exports data to Excel and reformats the spreadsheet, and then she would like to run the spreadsheet and have the data change dynamically. To do this, she would follow these steps:
On the Navigation Bar, click Sales.
The sales-related icons appear at the top of the navigation bar.
Click Opportunities.
The Main Opportunity form opens to the right.
Click the Excel icon on the toolbar.
The Export Data to Excel dialog box opens. The dialog box provides three export options, as follows:
Static worksheet with records from this page: With this option you export the data and the columns visible on the grid. Selecting this option makes the Make This Data Available for Re-Import by Including Required Columns option available at the bottom of the form. To learn more about this option, see Appendix A.
Dynamic PivotTable: Select this option when you want to see your data in a pivot table. When selected, you can select your columns (see step 4). Also, this is dynamic so if you save the spreadsheet the data will refresh each time the saved spreadsheet is run.
Dynamic worksheet: Similar to the pivot table, but you create an Excel worksheet instead of a pivot table.
Select an option (we chose Dynamic Worksheet) and click Export.
The File Download dialog box opens.
Click Open.
The Excel spreadsheet opens.
If prompted, select Yes.
Edit the spreadsheet as you see fit.
Because the worksheet or pivot table is dynamic, it reflects changes in the data whenever you run it. For example, the spreadsheet might have two opportunities with estimated revenue of $100,000; when you rerun it, if a third opportunity exists with estimated revenue of $50,000, the resultant total in the Excel spreadsheet is $150,000.
Save the Excel Spreadsheet.
We suggest you select Save As Excel and save the report with a name you prefer such as,
Open Opportunity Report.In Microsoft CRM, click Workplace on the Navigation Bar.
The workplace options now appear at the top of the navigation bar.
Click Reports at the top of the Navigation Bar.
In the report, click the New icon on the toolbar.
The new report dialog opens. (See Figure 10-4.)
Change the Report Type to Existing File.
For File Location, browse to the file you just saved.
Add categories.
For more information, see the section, "Report Settings," earlier in this chapter.
Choose the Related Record Type.
In our example, we chose Opportunities.
In Display Area, select Lists for Related Records.
The spreadsheet now is available in the toolbar above the Opportunity grid.
Note
The Related Record Types and Display In fields control the location in which your reports will be visible. The Categories field controls the categories in which a report will be displayed in the main reports area (Workplace
To share your report with others in your organization, complete steps 17 and 18. Otherwise, skip to step 19.
Click the Administration Tab.
Select Organization in Viewable By.
Click the Save Icon or Save and Close.