
The bookmark features allow report creators to capture the view of a report page. This includes the filtering and the state of the visuals at the time when the bookmark was created, allowing them to return to that state by simply selecting the bookmark in question. There are some additional options that we will explore a little later on, but lets begin with the basics on to use this storytelling feature. To gain access to the bookmarks, simply access the View ribbon and place a check mark next to the Bookmarks Pane option. You will see a new window present itself next to the Visualizations pane. Because we have not created any bookmarks, the only option we have is to Add, but first, we need to bring in a couple more visuals to the Summary Page to make it worthwhile.
Let's take a look at, setting up the example:
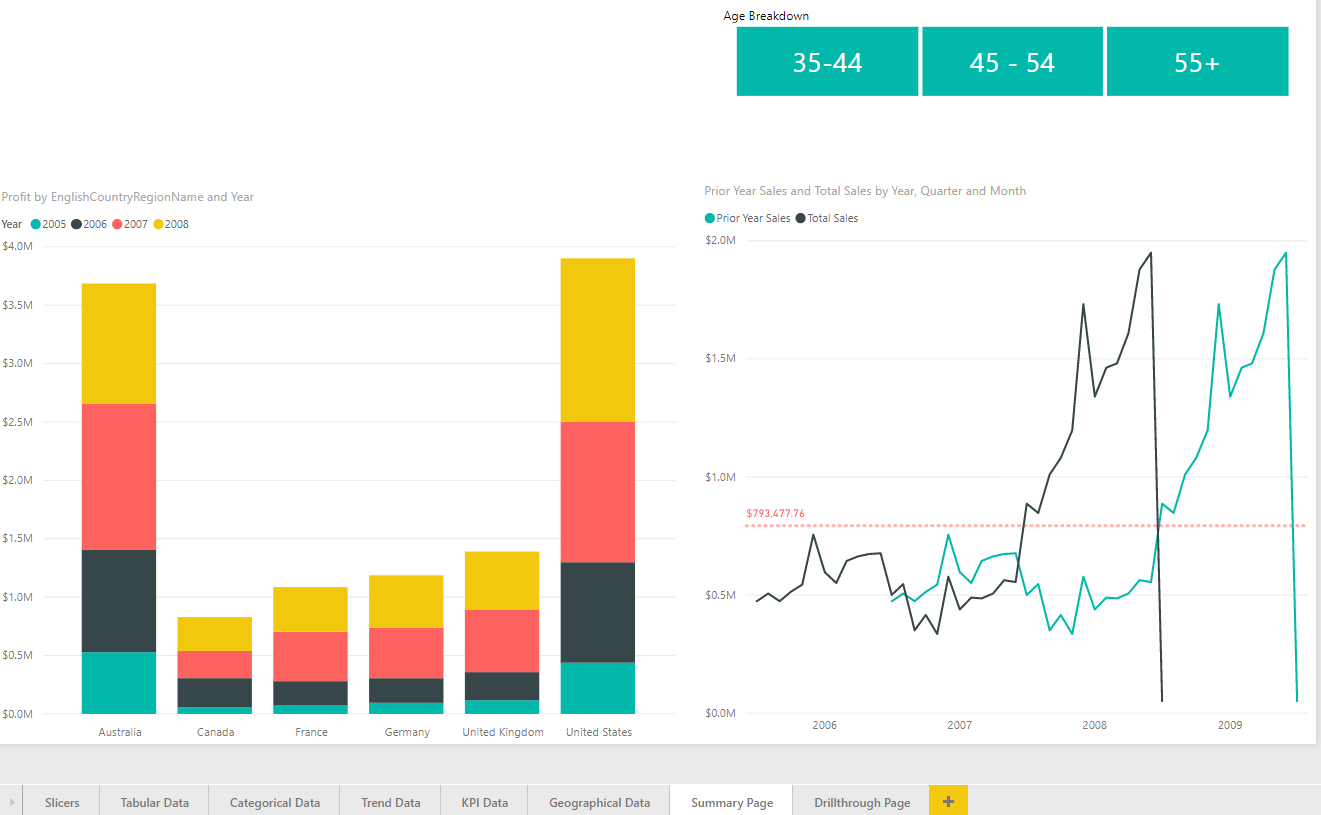
- Select the Trend Data report page and highlight the Line Chart, which showcases the Total Sales and Prior Year Sales measures from the years 2005–2009. What we want to do is copy this visual directly over to the Summary Page. This can be done by holding the Ctrl + C keys on the keyboard. If this is not possibly, simply take note of the settings for this visual and recreate it on the Summary Page.
- Next, let's add a slicer to the Summary Page using the Age Breakdown field for the values. To make this look a bit nicer, let's make this slicer look like a button by visiting the Format Area for the slicer and changing the Orientation selection to Horizontal with the General dropdown. You can also change the coloring to your liking, as shown in Figure 6.3:
With the visuals that we have put in place, we can start to create bookmarks. There are a couple of different approaches that can be adopted. The first option we will look at is simply filtering the data to a specific state and then selecting the Add option inside of the Bookmarks pane. Let's go ahead and select the option of 35–44 from the slicer to filter the page. Creating a bookmark for this really isn't impactful because this is something that users can do by themselves with a visual slicer, but we can use some of the other features in combination with this to create a specialized view of the data—for instance, the Spotlight option. Select the ellipsis in the upper right-hand corner of the Stacked Column Chart visual and choose the Spotlight option, which will fade all other visuals on the page. Now we can go ahead and select the Add option inside of the Bookmarks pane and rename the bookmark as Spotlight Column 35–44.
In order to rename the bookmark, you just need to select the ellipsis to the right of the newly created item. You will see the Rename option, along with many others, as shown in Figure 6.4:

Let's take a moment to talk about what these options mean and how they will affect the bookmark:
- Update: With the bookmark selected, if any changes are made to the visuals, you can simply choose this option and the current state of the page will be saved for the selected bookmark.
- Rename: This option allows you to rename the selected bookmark.
- Delete: This option removes the currently selected bookmark.
- Data: If this option is checked, it will retain all the data properties from when this bookmark was created, such as the slicers or filters. Effectively, the visual will always reset the data to the state of when the bookmark was captured whenever it is selected. By deselecting this option, there will be no resetting of the filters when this bookmark is selected.
- Display: This option will retain visual properties, such as the Spotlight feature and the visibility.
- Current page: When this option is turned off, the bookmark page is effectively disabled, unless you are on the same page that the bookmark is referencing.
- All visuals: If this option is selected, then all visuals on the page, both visible and hidden, are part of the bookmark.
- Selected visuals: If this option is selected, then only the visuals that are selected when the bookmark is created will be stored.
As you can see from these many options, there are many different behaviors that we can choose to use with bookmarks. Now let's look at how bookmarks are best displayed. Go ahead select any area in the report page where there are no visuals. This will deselect the bookmark. Switch the slicer filter to 45–54 and once again use the Spotlight feature on the Stacked Column Chart and create another bookmark called Spotlight Column 45–54. Let's go ahead and add a third bookmark following the same steps, but pointing to the 55+ option within the slicer. This one should be called Spotlight Column 55+. Users can now open the Bookmark pane and choose to view whichever option they would like very easily, but we can also set this to a view mode that works well for presentations. Just next to the Add button, you will see an option called View, which will bring up some new icons at the bottom of the report page. As seen in Figure 6.5, we can now have a forward and back arrow, which allows us to move through all the available bookmarks and really tell a tailored story of the data. Also, while in this mode, all of the visuals are still completely available to be interacted with. To exit simply choose the X icon next to the arrows at the bottom or the Exit option within the Bookmarks pane, as shown in the following screenshot:

Even though we have already seen many different ways to use bookmarks, there are still more. Another fantastic way to guide report consumers to these tailored views of the data is by using images to link to these bookmarks. To get a better understanding of how to accomplish this, we must look at the Selection pane.