
Chapter 30 Using ZENworks Server Management Alarm Management
One of the most powerful features of ZENworks Server Management is its capability to make network management much more controlled and easy. ZENworks Server Management adds a powerful alarm management system and a service monitoring system to help you more easily monitor, manage, and control problems on your network.
The ZENworks Server Management alarm management system employs a series of trap and alarm handlers to manage and store information about important events occurring on your network. You can then use tools provided by the ZENworks Server Management console to understand, manage, and resolve those events.
The ZENworks Server Management service monitoring system employs utilities and views from the management console to help you actively test and understand the connectivity between the management console and the monitored services. This feature helps you detect, locate, and understand service and network outages much faster.
The following sections describe the components and utilities that make up the ZENworks Server Management alarm management system and the ZENworks Server Management monitoring services system. They also discuss how to configure and use the services to best detect, diagnose, and resolve network issues.
The ZENworks Server Management alarm management system comprises several components, each of which has a specific responsibility to either send, receive, transfer, handle, store, or view network alarms. ZENworks Server Management uses these components to alert you when conditions or events occur on the network that require an action on your part to resolve.
The following sections discuss the different components that ZENworks Server Management uses to monitor and manage alarms on your network.
The SNMP (Simple Network Management Protocol) trap receiver is an agent that actively receives SNMP traps from managed servers with SNMP agents loaded on them. When the SNMP trap receiver gets an alarm, it is this agent’s responsibility to pass the alarm to the SNMP trap injector component and the SNMP trap forwarder component.
The SNMP trap forwarder checks traps passed from the SNMP trap receiver against the Alarm Manager database to determine whether the trap has an SNMP trap-forwarding disposition. If the Alarm Manager database has a forwarding disposition for the trap, the SNMP trap forwarder forwards the trap based on the criteria specified by the disposition. If there is no forwarding disposition, the SNMP trap forwarder simply ignores the trap.
The SNMP trap injector is responsible for converting the SNMP traps into manageable alarms. After the trap is converted into an alarm, the SNMP trap injector then passes the alarm to the alarm injector.
The alarm injector is responsible for collecting alarms from the SNMP trap injector as well as other applications that can transfer alarms to the ZENworks Server Management system. After it receives an alarm, it then passes it to the inbound processor.
The alarm processors are responsible for processing network and server alarms that are added to them by the alarm injector. The following are the three types of alarm processors and their functions:
![]() Inbound processor—Receives alarms from the alarm injector and applies a predefined alarm template to them. The alarm template is based on SNMP traps and other proprietary definitions based on specific criteria from the ZENworks Server Management alarm management system. After the inbound processor has applied the template to the alarm, it transfers it to the archive processor.
Inbound processor—Receives alarms from the alarm injector and applies a predefined alarm template to them. The alarm template is based on SNMP traps and other proprietary definitions based on specific criteria from the ZENworks Server Management alarm management system. After the inbound processor has applied the template to the alarm, it transfers it to the archive processor.
![]() Archive processor—Takes alarms from the inbound processor, adds them to a log, and then stores data about them in the Alarm Manager database. After the alarm data is stored, the archive processor passes the alarm to the outbound processor.
Archive processor—Takes alarms from the inbound processor, adds them to a log, and then stores data about them in the Alarm Manager database. After the alarm data is stored, the archive processor passes the alarm to the outbound processor.
![]() Outbound processor—Accepts alarms from the archive processor and then dispatches them to the subscription server and the disposition server.
Outbound processor—Accepts alarms from the archive processor and then dispatches them to the subscription server and the disposition server.
Now that you understand how traps are picked up and converted to alarms and then handled by the processors, you need to understand the Alarm Manager database. The Alarm Manager database is responsible for storing information about processed alarms as well as alarm templates and dispositions. The following sections discuss the different types of alarm information stored in the database.
The biggest responsibility of the Alarm Manager database is to store data about alarms that have been handled by the alarm processors. This is the data that you can view at the ZENworks Server Management console via the alarm query server, using the alarm reporting.
Another key type of alarm information that is stored in the Alarm Manager database are the templates used by the inbound processor to format the alarm so that it can be properly handled by the ZENworks Server Management alarm management system.
Many SNMP traps, for example, do not have an object ID associated with them. But an object ID is required by the ZENworks Server Management alarm management system to process the alarm. Therefore, a template is applied to the alarm at processing, which associates an object ID with the device or node that triggered the alarm.
The Alarm Manager database also stores any configured alarm dispositions. Alarm dispositions enable you to configure, prior to the alarm occurring, an automated method of handling the alarm. The alarm dispositions enable you to launch applications, send an email alert, and send console alerts in the form of messages or beeps, forwarding the SNMP traps to other ZENworks Server Management systems or even to other non-ZENworks Server Management systems.
Now that you understand what information is stored in the Alarm Manager database, you need to know what components are responsible for putting it there. The following is a list of alarm database archivers and their responsibilities:
![]() Alarm archiver—Stores the actual data and statistics about alarms that have occurred on the network. You can configure the alarm archiver to store whatever alarms you want to manage. The default for the alarm archiver is to store all alarms.
Alarm archiver—Stores the actual data and statistics about alarms that have occurred on the network. You can configure the alarm archiver to store whatever alarms you want to manage. The default for the alarm archiver is to store all alarms.
![]() Disposition archiver—Receives alarm disposition information from the ZENworks Server Management console and saves it to the Alarm Manager database to be used by the SNMP trap forwarder.
Disposition archiver—Receives alarm disposition information from the ZENworks Server Management console and saves it to the Alarm Manager database to be used by the SNMP trap forwarder.
![]() Template archive—Stores changes made to alarm templates by the MIB compiler in the database. ZENworks Server Management includes basic templates for all SNMP traps and proprietary alarms; however, you can reconfigure them by using the MIB compiler.
Template archive—Stores changes made to alarm templates by the MIB compiler in the database. ZENworks Server Management includes basic templates for all SNMP traps and proprietary alarms; however, you can reconfigure them by using the MIB compiler.
The final component involved in the ZENworks Server Management alarm management system is the alarm viewers. The alarm viewers are simply different views available at the ZENworks Server Management console.
The ZENworks Server Management console uses alarm queries to the Alarm Manager database to provide you with views on currently active alarms as well as historically archived alarms. You should become familiar with how to view alarm information. The different alarm views are discussed more fully in the next section.
Now that you understand the components that make up the ZENworks Server Management alarm management system, you need to know how to begin managing alarms on your network. Alarm management is a process of enabling alarms, monitoring for alarm conditions, handling the alarm situations, and deleting the alarm.
The following sections describe how to use the ZENworks Server Management console to enable alarms, disable alarms, understand alarm indicators, work with alarm views, manage alarms, perform actions on the alarms, and then remove alarms from the system.
The first task you must be familiar with when managing the ZENworks Server Management alarm management system is how to enable and disable alarms. Alarm thresholds are associated with each managed server and segment. When an alarm threshold is exceeded, an alarm is generated.
Although server threshold alarms are enabled by default, segment threshold alarms are not. You need to use the ZENworks Server Management console to enable and configure the threshold alarms for your network.
Follow these steps in the management console to enable and disable the alarms for your managed servers and segments to best match your needs:
1. Select the server or segment object to which you want to enable or disable alarms.
2. Right-click the object and select Properties from the pop-up menu.
3. Select the Segment Alarms property tab, shown in Figure 30.1.

4. Select the alarm you want to modify.
5. Click the Edit button, and the Set Alarm Threshold dialog box appears.
6. Select Enable to enable the alarm or deselect Enable to disable the alarm.
7. If you are enabling an alarm, set the threshold value.
8. If you are enabling an alarm, you should also set the amount of time in the Sampling Interval field by which the threshold value must be exceeded to generate the alarm.
After the last step, you can click OK to save your alarm setting and return to the Segment Alarms property tab.
After enabling, disabling, and configuring the alarm thresholds for the managed servers and segments on you network, ZENworks Server Management starts tracking, storing, and relaying network alarms as they occur. At this point, you need to become familiar with the different alarm indicators so that you can recognize and respond to the alarms as they occur.
The following sections discuss the different indicators that you can watch for when alarms are triggered on your network.
Alarms that are triggered with a critical, major, or minor severity are displayed in the ZENworks Server Management console in both the Atlas and Console views. When an alarm is triggered on a segment or server being managed by the ZENworks Server Management alarm management system, an Alarm icon is anchored to the object. Therefore, as you browse through the ZENworks Server Management namespace, watch out for Alarm icons.
You can also configure the ZENworks Server Management alarm management system to display alarm messages on the status bar of the management console. This option is on by default. If this option is on, as the alarm management system recognizes an alarm, it displays a descriptive message on the status bar that an alarm has been triggered. This is another thing that you should keep an eye out for. The messages let you know which object is affected so that you can quickly find the problem and resolve it.
The final alarm indicator is an audible beep sent to the management console. The alarm management system can be configured to force an audible beep on the management console when an alarm occurs. This is useful if you are not actively browsing or looking for alarms. If you hear a beep on the management console, look for the Alarm icon on your server or segment objects and investigate the alarm.
Now that you understand the alarm indicators that you should look and listen for, you need to know how to use the views provided with ZENworks Server Management to monitor and manage alarms. The ZENworks Server Management console gives you access to both active and historical data about alarms that are occurring or have occurred on your network.
You can define access restrictions to alarm data and management functions through ZENworks Server Management role-based services. You can also modify the presentation of the alarm data displayed in the views by sorting and filtering on specific data elements.
The following sections discuss the different alarm views provided with ZENworks Server Management and how to use them to monitor and manage alarms.
Active alarms are typically the most important type of alarm that you will encounter. Active alarms indicate that a problem is currently happening on either a monitored segment or a server. The ZENworks Server Management Active Alarm view, shown in Figure 30.2, displays the following alarm statistics for all current alarms for the managed site.
FIGURE 30.2 Active Alarm view for a ZENworks Server Management site management object in ConsoleOne.
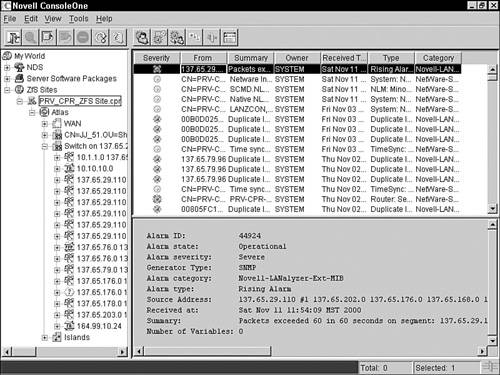
![]() Severity—Displays an Alarm icon color coded to indicate the level of alarm severity: Red = Critical, Magenta = Major, Yellow = Minor, Blue = Informational, and White = Unknown.
Severity—Displays an Alarm icon color coded to indicate the level of alarm severity: Red = Critical, Magenta = Major, Yellow = Minor, Blue = Informational, and White = Unknown.
![]() From—Specifies the network address of the device that sent the alarm to the alarm management system.
From—Specifies the network address of the device that sent the alarm to the alarm management system.
![]() Summary—Displays a summary of the alarm event, including names, addresses, and other information about the alarm.
Summary—Displays a summary of the alarm event, including names, addresses, and other information about the alarm.
![]() Owner—Specifies the person or group responsible for handling the alarm.
Owner—Specifies the person or group responsible for handling the alarm. SYSTEM is specified until an owner is set.
![]() Received Time—Displays the date and time when the alarm management system received the alarm.
Received Time—Displays the date and time when the alarm management system received the alarm.
![]() Type—Specifies the generic type description of the alarm.
Type—Specifies the generic type description of the alarm.
![]() Category—Specifies the category of the trap-type object identified from its MIB association.
Category—Specifies the category of the trap-type object identified from its MIB association.
For each of the alarms, the ZENworks Server Management Active Alarm view displays the following alarm-specific data for the selected alarm (refer to Figure 30.2):
![]() Alarm ID—Displays the object ID of the alarm in the Alarm Manager database.
Alarm ID—Displays the object ID of the alarm in the Alarm Manager database.
![]() Alarm State—Displays the current status of the alarm. This tells you if the alarm is currently operational or not.
Alarm State—Displays the current status of the alarm. This tells you if the alarm is currently operational or not.
![]() Alarm Severity—Displays the severity of the alarm: Severe, Major, Minor, Informational, or Unknown.
Alarm Severity—Displays the severity of the alarm: Severe, Major, Minor, Informational, or Unknown.
![]() Generator Type—Displays the type of agent that activated the alarm.
Generator Type—Displays the type of agent that activated the alarm.
![]() Alarm Category—Displays the category of the trap-type object identified from its MIB association.
Alarm Category—Displays the category of the trap-type object identified from its MIB association.
![]() Alarm Type—Displays the generic type description of the alarm.
Alarm Type—Displays the generic type description of the alarm.
![]() Source Address—Displays the address of the device that triggered the alarm.
Source Address—Displays the address of the device that triggered the alarm.
![]() Received At—Displays the time at which the alarm management system received the alarm from the agent.
Received At—Displays the time at which the alarm management system received the alarm from the agent.
![]() Summary—Gives a descriptive summary of the alarm. This is one of the most useful statistics because the descriptions include node names and specific data about the nature of the alarm.
Summary—Gives a descriptive summary of the alarm. This is one of the most useful statistics because the descriptions include node names and specific data about the nature of the alarm.
![]() Number of Variables—Lists the number of variables associated with the alarm.
Number of Variables—Lists the number of variables associated with the alarm.
Follow these steps from within the ZENworks Server Management console to access the Active Alarm view:
In addition to the currently active alarms, ZENworks Server Management also enables you to view data about all archived alarms that have occurred on the network. The Alarm History view is similar to the Active Alarm view. But the Alarm History view includes a Handled status field, shown in Figure 30.3, in addition to the same information about the alarms.
FIGURE 30.3 Alarm History view for a ZENworks Server Management site management object in ConsoleOne.

Follow these steps from within the ZENworks Server Management console to access the Alarm History view:
After bringing up either the Active Alarm or the Alarm History view on the management console, you can change the look of the view by sorting the alarms according to a specific criterion. This enables you to tailor the view to meet the needs of the problem you are trying to resolve or a report that you need to prepare.
The following are the most common criteria you may want to sort alarms on and examples of when to use them:
![]() Received Time—The default sort order. This enables you to see the alarms in the chronological order that they occurred. This is the most useful view in understanding the initial status of the network and when problems started occurring.
Received Time—The default sort order. This enables you to see the alarms in the chronological order that they occurred. This is the most useful view in understanding the initial status of the network and when problems started occurring.
![]() Affected Object—Enables you to focus on the specific server or node that triggered the alarm. This is most useful when you are troubleshooting a server or router issue.
Affected Object—Enables you to focus on the specific server or node that triggered the alarm. This is most useful when you are troubleshooting a server or router issue.
![]() Severity—Enables you to focus on a specific level of error. Typically, you sort according to severity when you want to see only the most severe errors that are occurring and resolve them first.
Severity—Enables you to focus on a specific level of error. Typically, you sort according to severity when you want to see only the most severe errors that are occurring and resolve them first.
![]() Category—Enables you to focus on specific trap types identified in the MIB. This sorting enables you to focus on a specific alarm. Use this if you are troubleshooting or monitoring a specific router or server issue where you know the specific SNMP trap you are looking for.
Category—Enables you to focus on specific trap types identified in the MIB. This sorting enables you to focus on a specific alarm. Use this if you are troubleshooting or monitoring a specific router or server issue where you know the specific SNMP trap you are looking for.
![]() Type—Can be useful to troubleshoot some specific issues. If you were watching for hard drive space problems, for example, you may sort by type and bring together all the volume out of disk space alarms.
Type—Can be useful to troubleshoot some specific issues. If you were watching for hard drive space problems, for example, you may sort by type and bring together all the volume out of disk space alarms.
![]() Owner—Sorting by Owner can be useful to get all the issues sorted by whom the problem belongs to.
Owner—Sorting by Owner can be useful to get all the issues sorted by whom the problem belongs to.
Follow these steps from within the ZENworks Server Management console to sort the Active Alarm or the Alarm History view:
1. Open up the alarm view you want to sort.
2. Select View→Settings→Sort from the main menu in ConsoleOne.
3. From the Alarm Sorting dialog box, shown in Figure 30.4, select the criteria by which you want the alarms to be sorted.
FIGURE 30.4 Alarm Sorting dialog box for a ZENworks Server Management site management object in ConsoleOne.
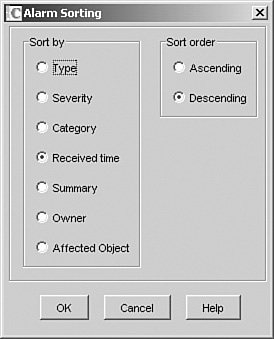
4. Select the sort order: Ascending or Descending.
5. Click OK to save your setting. The alarm view should be sorted according to your selections.
This completes the steps for sorting the Active Alarm/Alarm History view.
ZENworks Server Management also enables you to filter on alarms according to specific criteria after you bring up either the Active Alarm or the Alarm History view on the management console. This enables you even greater control to customize the view to meet more specific needs of the problems you are trying to resolve or reports that you need to prepare.
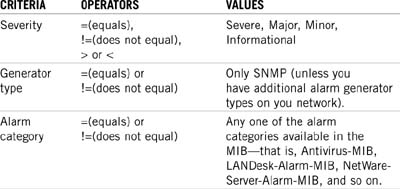
Table 30.1 shows the available criteria and options that you may want to use to filter alarms in the Active Alarm or Alarm History view.
TABLE 30.1 Criteria Available to Filter Alarm Views On

Follow these steps from within the ZENworks Server Management console to filter the Active Alarm or the Alarm History view:
1. Bring up the view that you want to filter.
2. Select View→Settings→Filter from the main menu in ConsoleOne. The Alarm Filter dialog box, shown in Figure 30.5, appears.
FIGURE 30.5 Alarm Filter dialog box for a ZENworks Server Management site management object in ConsoleOne.

3. Select the criteria by which you want the alarm management system to filter alarms from the drop-down list on the left.
4. Select an appropriate operator, from Table 30.1, to use from the next drop-down list.
5. Select an appropriate value from the third drop-down list, or specify a value if one is not provided.
6. Specify how this specific filter relates to other statements you want to define. You can use the AND, OR, new row, delete row, and new group relationship criteria. This enables you to add multiple filters and groups of filters to the alarm view, as shown in Figure 30.5.
7. If you defined relationship criteria in step 6, repeat steps 3 through 6.
When you finish specifying filters, click OK. The filter is saved, and the view is adjusted according to your criteria.
ZENworks Server Management allows you to view a summary of the alarms for a managed site. The Alarm Summary view provides concise, but complete, data about the alarms that have occurred on your network over the past day, week, or month.
The following list breaks down the information displayed in the Alarm Summary view shown in Figure 30.6:
![]() Severity Distribution—Displays a pie chart breaking out the alarms based on their severity. This information is useful to find out how many critical alarms your network is seeing. You can, for example, view this in terms of days, weeks, and months to determine whether your network is getting healthier or sicker.
Severity Distribution—Displays a pie chart breaking out the alarms based on their severity. This information is useful to find out how many critical alarms your network is seeing. You can, for example, view this in terms of days, weeks, and months to determine whether your network is getting healthier or sicker.
![]() Category Distribution—Displays a pie chart breaking out the alarms based on the alarms category. This information is useful to help you understand where your network may need to grow or where problems need to be resolved.
Category Distribution—Displays a pie chart breaking out the alarms based on the alarms category. This information is useful to help you understand where your network may need to grow or where problems need to be resolved.
![]() Owner Distribution—Displays a pie chart breaking out the alarms based on the owner of the service that triggered the alarm. This information is useful to know where to begin troubleshooting issues.
Owner Distribution—Displays a pie chart breaking out the alarms based on the owner of the service that triggered the alarm. This information is useful to know where to begin troubleshooting issues.
![]() State Disposition—Displays a pie chart that breaks down the alarms based on the state that they are in. This information helps you understand the duration of the alarms on your network. If the active state, for example, is the majority of the pie chart, you know that the alarms are active much of the time, and the issues are much more severe.
State Disposition—Displays a pie chart that breaks down the alarms based on the state that they are in. This information helps you understand the duration of the alarms on your network. If the active state, for example, is the majority of the pie chart, you know that the alarms are active much of the time, and the issues are much more severe.
![]() Top Alarm Types—Displays a bar graph of the alarms triggered most often. This information helps determine which services are being affected most on your network.
Top Alarm Types—Displays a bar graph of the alarms triggered most often. This information helps determine which services are being affected most on your network.
![]() Top Affected Nodes—Displays a bar graph of the nodes where alarms are triggered most often. This information helps determine which nodes and/or segments need the most attention in terms of growth and optimization.
Top Affected Nodes—Displays a bar graph of the nodes where alarms are triggered most often. This information helps determine which nodes and/or segments need the most attention in terms of growth and optimization.
![]() Top Source Address—Displays a bar graph of the network addresses where alarms are triggered most often. This information enables you to understand on what segments, routers, and so on problems are occurring.
Top Source Address—Displays a bar graph of the network addresses where alarms are triggered most often. This information enables you to understand on what segments, routers, and so on problems are occurring.
![]() Arrival Rate—Displays a line graph that shows the number of active alarms based on a time interval. The arrival rate shows you the number of alarms active at any given time. This information is useful to understand network issues that have to do with time. If you are getting numerous alarms at the same time in the morning, for example, you can look at when employees are arriving to work and logging in to the network. You may need to add additional hardware to handle the morning login or perhaps stagger the time employees can log in to the network.
Arrival Rate—Displays a line graph that shows the number of active alarms based on a time interval. The arrival rate shows you the number of alarms active at any given time. This information is useful to understand network issues that have to do with time. If you are getting numerous alarms at the same time in the morning, for example, you can look at when employees are arriving to work and logging in to the network. You may need to add additional hardware to handle the morning login or perhaps stagger the time employees can log in to the network.
FIGURE 30.6 Alarm Summary view for a ZENworks Server Management site management object in ConsoleOne.

The Alarm Summary page allows you to use the following options from the Alarm Summary view to customize what data is displayed:
![]() Select Interval—This drop-down menu enables you to view data collected from the last day, week, or month. This information is important in giving you an understanding of how the network’s status is changing over a period of time.
Select Interval—This drop-down menu enables you to view data collected from the last day, week, or month. This information is important in giving you an understanding of how the network’s status is changing over a period of time.
![]() Refresh Every—This check box instructs ZENworks to refresh the data every 10 seconds, 30 seconds, or 1 minute.
Refresh Every—This check box instructs ZENworks to refresh the data every 10 seconds, 30 seconds, or 1 minute.
![]() Customize—Enables you to configure what information is displayed in the Alarm Summary view. You can disable any of the statistics, and you can set the number of top alarm types, top affected nodes, and top source addresses to display in the bar graphs.
Customize—Enables you to configure what information is displayed in the Alarm Summary view. You can disable any of the statistics, and you can set the number of top alarm types, top affected nodes, and top source addresses to display in the bar graphs.
Now that you understand how to detect and view network alarms from the ZENworks Server Management console, you need to know how to manage them on large networks. This sort of management is especially important if numerous administrators are managing different aspects of the management site.
ZENworks Server Management adds options to the alarm to enable you to assign, own, and handle alarms. This feature helps you keep track of who is responsible for what issues and which issues have been resolved.
After you select an alarm from the Active Alarm or the Alarm History view, you can manage the alarm by selecting one of the following options for it from the View menu in ConsoleOne:
![]() Assign—Enables you to specify a person or group responsible for handling an alarm. When this option is set, other administrators know that they do not need to respond to it.
Assign—Enables you to specify a person or group responsible for handling an alarm. When this option is set, other administrators know that they do not need to respond to it.
![]() Own—Causes the owner that is filed to change to the NDS name you are logged in as. This lets other administrators know that you are handling this alarm. Therefore, they do not need to act on the alarm, and they have a person to contact for estimated resolutions and so forth.
Own—Causes the owner that is filed to change to the NDS name you are logged in as. This lets other administrators know that you are handling this alarm. Therefore, they do not need to act on the alarm, and they have a person to contact for estimated resolutions and so forth.
![]() Handle—Removes the alarm from the Active Alarm view. This removes the alarm from active issues that need resolving, enabling administrators to focus on current problems. But the alarm still shows up on the Alarm History view.
Handle—Removes the alarm from the Active Alarm view. This removes the alarm from active issues that need resolving, enabling administrators to focus on current problems. But the alarm still shows up on the Alarm History view.
![]() Note—Adds any special comments or notes about the alarm. After a note has been added to an alarm, the alarm’s icon changes to one with a small icon designating that the alarm has a special note attached to it. The note can be viewed in the alarm information pane when the alarm is selected.
Note—Adds any special comments or notes about the alarm. After a note has been added to an alarm, the alarm’s icon changes to one with a small icon designating that the alarm has a special note attached to it. The note can be viewed in the alarm information pane when the alarm is selected.
![]() Jump—Use this to jump directly to the object that triggered the alarm. This allows you faster access to the object to troubleshoot issues.
Jump—Use this to jump directly to the object that triggered the alarm. This allows you faster access to the object to troubleshoot issues.
One of the most powerful features of the ZENworks Server Management alarm management system is its capability to perform actions automatically to help you manage alarms as they are triggered. You can use the ZENworks Server Management console to configure an alarm to automatically trigger an action when it occurs.
Alarm actions are configured through alarm dispositions. Follow these steps to access the Alarm Disposition page, shown in Figure 30.7, and to configure alarm actions in ConsoleOne:
1. Right-click on the ZENworks Server Management site object to which you want to configure alarm dispositions and select properties.
2. Select the Alarm Disposition tab.
3. Select the Templates tab shown in Figure 30.7.
4. Select the alarm you want to configure from the list.
5. Click the Edit button to bring up the Edit Alarm Disposition dialog box.
FIGURE 30.7 Alarm Disposition tab for a ZENworks Server Management site management object in ConsoleOne.

This completes the steps for configuring alarm actions in ConsoleOne.
ZENworks Server Management has added a Sort button to the Alarm Disposition tab that allows you to define a template for ZENworks to use when sorting alarms. This capability is useful to analyze and understand the nature of alarms occurring on your network. You could, for example, narrow down problem services by setting up a template to sort by the alarm type.
To set up a template to sort alarms, click the Sort button shown in Figure 30.7 to bring up the Template Sorting dialog box. From the Template Sorting dialog box you can define a template to sort based on up to four of the following different criteria types:
![]() Severity—Severity of the alarm
Severity—Severity of the alarm
![]() Generator Type—Type of service that generated the alarm
Generator Type—Type of service that generated the alarm
![]() Category—The classification of the alarm
Category—The classification of the alarm
![]() Type—The specific type of the alarm
Type—The specific type of the alarm
ZENworks Server Management enables administrators to print the alarm dispositions. The printout of the alarm dispositions can then be saved or taken to use for troubleshooting purposes. Use the following steps to print the alarm dispositions for a ZENworks Server Management site in ConsoleOne:
1. Select the ZENworks Server Management site object you want to print.
2. Select the Alarm Disposition tab, shown previously in Figure 30.7.
3. Select the alarm(s) you want to print.
4. Click the Print button.
5. Set the print properties options and click OK.
ZENworks Server Management also enables administrators to export the alarm dispositions to one of the following file formats:
![]() .HTML—HTML
.HTML—HTML
![]() .CSV—Comma-delimited
.CSV—Comma-delimited
![]() .TXT—Tab-delimited
.TXT—Tab-delimited
![]() .TXT—Space-delimited
.TXT—Space-delimited
The saved file containing the alarm dispositions can then be used in reports or documenting issues. Use the following steps to export the alarm dispositions for a ZENworks Server Management site in ConsoleOne:
1. Select the ZENworks Server Management site object you want to print.
2. Select the Alarm Disposition tab, shown previously in Figure 30.7.
3. Select the alarm(s) you want to print.
4. Click the Print button.
5. Click the Print to File button.
6. Select the Export file type and specify a filename and location.
7. Click OK.
The following sections discuss the actions to be performed when an alarm is triggered and that are available from the Edit Alarm Disposition dialog box.
The first available option from the Alarm Disposition dialog box is the capability to send an email notification to a user or group. It is useful to be notified when critical alarms occur on the network.
Network administrators use this feature for various kinds of notification. Some have their SMTP mail server configured to page them with the notification email when it is received.
Follow these steps to configure an email notification action for an alarm from the Edit Alarm Disposition dialog box in ConsoleOne:
1. Select the SMTP Mail Notification tab, shown in Figure 30.8.
FIGURE 30.8 SMTP Mail Notification tab of an alarm disposition for a site management object in ConsoleOne.
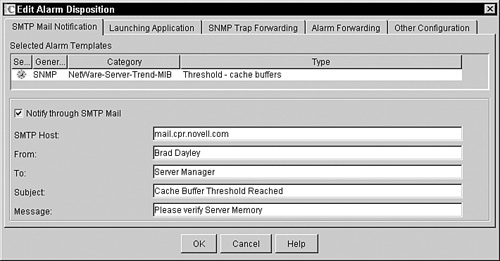
2. Select the Notify Through SMTP Mail check box.
3. In the SMTP Host text box, specify the IP address or DNS name of the SMTP host server that handles incoming and outgoing email. You can also specify a port on the host server by typing a colon and the port number after the IP address.
4. In the From text box, specify the mail ID you want to use. This information is usually important for any additional automation on the back end.
5. In the To text box, specify the mail IDs of the users or groups you want to notify when the alarm is triggered.
6. In the Subject text box, specify the subject line you want to appear on the mail message that is sent. This information is also often important for additional automation on the back end. You can also add variables to the subject line by specifying a % sign in front of them. Use Table 30.2 to specify any variables that might be useful in the email Subject line.
TABLE 30.2 Available Variables for Use in the Subject and Message Options for SMTP Mail Notifications

7. In the Message text box, specify the text message you want to appear in the body of the email that is sent. This message should include a description of what the alarm means. You can also add variables to the subject line by specifying a % sign in front of them. Use Table 30.2 to specify any variables that might be useful in the email body.
At the completion of these steps, click OK to save your settings and return to the Alarm Dispositions tab.
The next option available from the Alarm Disposition dialog box is the ability to launch an application. This option enables you to specify an NLM to be launched when an alarm is triggered on a server.
If your network utilization is too high, for example, you could launch an NLM that shuts down noncritical applications that normally consume high amounts of network bandwidth.
From the Edit Alarm Disposition dialog box in ConsoleOne, follow these steps to configure an external program to be launched when an alarm is triggered:
1. Select the Launching Application tab, shown in Figure 30.9.
FIGURE 30.9 Launching Application tab of an alarm disposition for a site management object in ConsoleOne.

2. Select the Launch Application check box.
3. Specify the application path and filename in the Application Name text box.
4. Specify any additional arguments in the Argument text box. You can use variables listed in Table 30.2 as parameters by preceding them with the % sign.
5. Click OK to save your settings and return to the Alarm Dispositions tab.
The next option available from the Alarm Dispositions dialog box is the ability to forward the SNMP trap to another management system. This option enables you to specify the IP address of another management station or server to forward the SNMP trap to.
If you had another SNMP management system, for example, in addition to ZENworks Server Management, and wanted that system to receive the trap as well, you could send an SNMP trap to that management system, too.
From the Edit Alarm Disposition dialog box in ConsoleOne, follow these steps to configure an IP address to which the SNMP trap should be forwarded:
1. Select the SNMP Trap Forwarding tab, shown in Figure 30.10.
FIGURE 30.10 SMTP Trap Forwarding tab of an alarm disposition for a site management object in ConsoleOne.

2. Enter the IP address of the server to which you want to forward the SNMP traps in the SNMP Target Address field. You can also specify a port on the target server by adding a colon and the port number after the IP address.
3. Click Add to add it to the list of targets.
4. Click OK to save your settings and return to the Alarm Dispositions tab.
This completes the steps necessary to configure an IP address to which the SNMP trap should be forwarded.
The next option available from the Alarm Dispositions dialog box is the ability to forward the alarm to another ZENworks Server Management site. This option enables you to specify a ZENworks Server Management site name and hostname in which to forward the alarm.
From the Edit Alarm Disposition dialog box in ConsoleOne, follow these steps to configure another ZENworks Server Management site to which the alarm should be forwarded:
1. Select the Alarm Forwarding tab, shown in Figure 30.11.
FIGURE 30.11 Alarm Forwarding tab of an alarm disposition for a site management object in ConsoleOne.

2. Enter the ZENworks Server Management site name to which you want to forward the alarm in the Server Name field.
3. Enter the ZENworks Server Management site hostname in the Host field.
4. Click Add to add it to the list of targets.
5. Click OK to save your settings and return to the Alarm Dispositions tab.
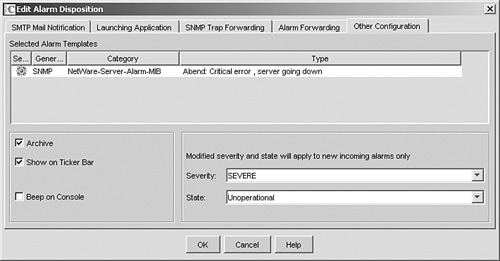
The final options panel available from the Edit Alarm Disposition dialog box is the Other Configuration tab, shown in Figure 30.12. This tab enables you to configure the following actions to be performed when an alarm is triggered:
![]() Archive—Stores the statistical data for the alarm instance in the Alarm Manager database on the management server. If you want to see the alarm in the Alarm History view, you need to select this option. It is on by default.
Archive—Stores the statistical data for the alarm instance in the Alarm Manager database on the management server. If you want to see the alarm in the Alarm History view, you need to select this option. It is on by default.
![]() Show on Ticker Bar—Displays a message of the alarm on the status bar of the ZENworks Server Management console to silently notify the administrator of the most recent alarm.
Show on Ticker Bar—Displays a message of the alarm on the status bar of the ZENworks Server Management console to silently notify the administrator of the most recent alarm.
![]() Beep on Console—Sends an audible beep to the ZENworks Server Management console to notify the administrator that an alarm has been triggered.
Beep on Console—Sends an audible beep to the ZENworks Server Management console to notify the administrator that an alarm has been triggered.
FIGURE 30.12 Other Configuration tab of an alarm disposition for a site management object in ConsoleOne.
Follow these steps to configure additional options for the alarm from the Edit Alarm Disposition dialog box in ConsoleOne:
1. Select the Other Configuration tab (refer to Figure 30.12).
2. Select the Archive check box if you want to save the alarm to the Alarm Manager database.
3. Select the Show on Ticker Bar check box if you want a message to be displayed in the status bar of the management console.
4. Select the Beep on Console check box if you want the alarm to send an audible beep to the management console.
5. Set the Severity of future alarms of this type to Information, Minor, Major, Severe, or Unknown.
6. Set the State of future alarms of this type to Operation, Unoperational, or Degraded.
On completion of these steps, click OK to save your settings and return to the Alarm Dispositions tab.
In addition to assigning actions to specify alarms, ZENworks 7 introduces a powerful feature that allows you to configure rules to define how certain types of alarms are handled automatically.
Use the following steps to configure an alarm rule in ConsoleOne:
1. Right-click on the ZENworks Server Management site object to which you want to configure alarm dispositions and select properties.
2. Select the Alarm Disposition tab.
3. Select the Rules tab shown in Figure 30.13.
FIGURE 30.13 Alarm Rules tab on the Alarm Disposition page for a ZENworks Server Management site management object in ConsoleOne.
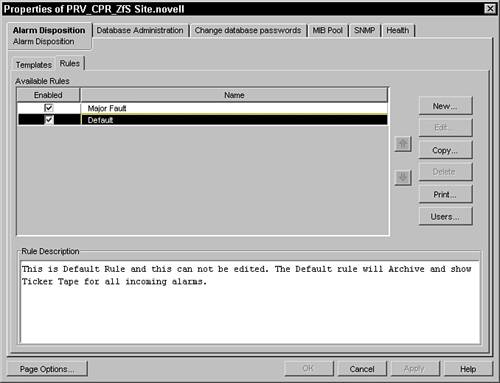
4. Click the New button to bring up the New Rule dialog box, shown in Figure 30.14.
The following sections discuss configuring the alarm rules from the New Rule dialog box.
You should configure the alarm rule properties first when creating a new alarm by selecting the Properties tab shown in Figure 30.14. From the Properties tab you can specify a rule name and description. This will allow you and others to identify the type and purpose of the rule and should be descriptive enough for all alarm administrators to understand.
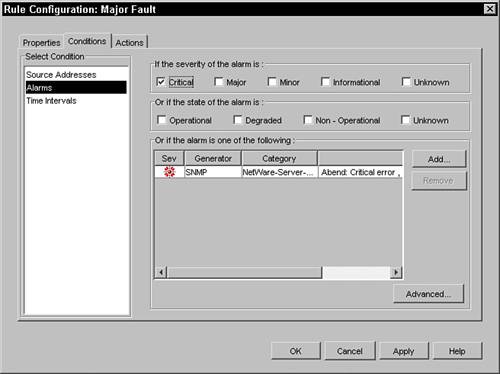
After you have configured the rule name and description on the Properties tab, select the Conditions tab shown in Figure 30.14. From the Conditions tab you can specify the following conditions that determine whether the rule applies to a triggered alarm:
![]() Source Addresses—Allows you to specify a specific IP address or a range of addresses. This allows you to limit the rule to a specific device or set of devices.
Source Addresses—Allows you to specify a specific IP address or a range of addresses. This allows you to limit the rule to a specific device or set of devices.
![]() Alarms—Allows you to specify to which severity/severities, state(s), or specific alarm(s) the rule should apply. This allows you to limit to which specific alarms the rule should apply. It also allows you to limit the rule based on the severity and/or state of the alarms.
Alarms—Allows you to specify to which severity/severities, state(s), or specific alarm(s) the rule should apply. This allows you to limit to which specific alarms the rule should apply. It also allows you to limit the rule based on the severity and/or state of the alarms.
![]() Time Intervals—Allows you to specify a specific time interval during which the alarm rule will be enforced. Alarms that occur outside that time interval will not be enforced. This is extremely useful if you need to define rule actions that should not be applied during production hours.
Time Intervals—Allows you to specify a specific time interval during which the alarm rule will be enforced. Alarms that occur outside that time interval will not be enforced. This is extremely useful if you need to define rule actions that should not be applied during production hours.
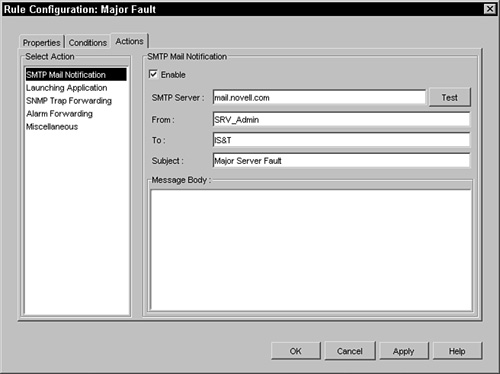
After you have configured the rule conditions on the Conditions tab, select the Actions tab shown in Figure 30.15. From the Actions tab you can specify the following actions if the alarm rule conditions apply to a triggered alarm:
![]() SMTP Mail Notification—Allows you to configure an SMTP mail message that will be sent in the event an alarm is triggered.
SMTP Mail Notification—Allows you to configure an SMTP mail message that will be sent in the event an alarm is triggered.
![]() Launching Application—Allows you to specify an application and arguments that should be executed in the event a triggered alarm matches the conditions.
Launching Application—Allows you to specify an application and arguments that should be executed in the event a triggered alarm matches the conditions.
![]() SNMP Trap Forwarding—Allows you to specify target addreses and ports that the SNMP Trap should be forwarded to.
SNMP Trap Forwarding—Allows you to specify target addreses and ports that the SNMP Trap should be forwarded to.
![]() Alarm Forwarding—Allows you to forward the alarm to another ZENWorks for Servers site and host.
Alarm Forwarding—Allows you to forward the alarm to another ZENWorks for Servers site and host.
![]() Miscellaneous—Allows you to specify that the alarm should be archived, that it should be shown on the ticker bar, that the server console should beep, or that the alarm should be automatically handled. It also allows you to change the severity and state of the alarm or assign it to a specific user.
Miscellaneous—Allows you to specify that the alarm should be archived, that it should be shown on the ticker bar, that the server console should beep, or that the alarm should be automatically handled. It also allows you to change the severity and state of the alarm or assign it to a specific user.
The final task you need to be familiar with when managing ZENworks Server Management alarms is how to remove them when you are completely finished with them. The alarms take up space in the Alarm Manager database until they are removed. If you do not consistently keep the alarms cleaned out of the database, the database can begin to take up an excessive amount of hard drive space.
The following sections discuss how to manually and automatically remove unwanted alarms from the Alarm Manager database.
You can manually delete alarms from the Alarm Manager database by simply deleting them from the ZENworks Server Management console. This is the best way to delete an individual alarm. But if numerous alarms have occurred, this process could be too time-consuming. If you have numerous alarms, instead use the automatic alarm deletion method described in the next section.
Follow these steps to manually delete an alarm from the Alarm Manager database from the management console:
The best way to handle the deletion of alarms is to automate the process by configuring the purge utility to delete the alarms for you. The purge utility is a Java application that runs on the server where the Alarm Manager database is stored.
The purge utility is controlled by a configuration file, AMPURGE.PROPERTY, which defines the criteria for selecting alarms to be purged as well as when to start purging alarms. The first step in using the purge utility to automatically delete alarms is to configure the criteria listed in Table 30.3 according to how long you need the alarms and when to start purging.
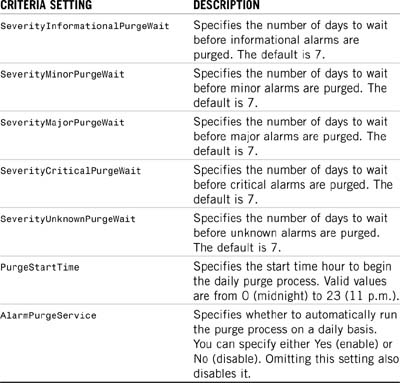
After configuring the criteria for purging alarms, you have two options. The first option is to wait for the start time that you specified the purge to begin. The second option is to manually start the purge process.
You may want to manually start the purge process because you turned off the automatic run by setting AlarmPurgeService to No, or because the database has grown too rapidly because of a network problem and you need to free up hard drive space.
Use the following command from the console of the server where the Alarm Manager database is stored to start the automatic purge process manually:
java com.novell.managewise.am.db.purge.AutoPurgeManager –s
–d <properties_file_directory>
The properties_file_directory parameter should be replaced with the directory location where the AMPURGE.PROPERTY file is located.
In addition to the alarm management services, ZENworks Server Management provides monitoring services to monitor devices on the network. The ZENworks Server Management alarm management system relies on agents either on the device or on the management server to capture events, turn them into alarms, and relay them to the management console.
The ZENworks Server Management monitoring services does the opposite. It enables the management console to check the status of network devices from the point of view of the console itself. This enables you to be immediately notified if connectivity between the console and critical nodes is interrupted.
Use the monitoring service as another option to monitor the status of the critical services on your network. The following sections describe how to define and configure target services you want to monitor.
ZENworks Server Management uses a ping method to monitor service status on target nodes. A ping packet is sent from a remote server to the target node. The remote server then waits for a specific interval. If a reply is received back from the target node before the interval elapses, the status of the server is up. If a reply is not received back from the target node before the interval elapses, the status of the server is down.
The following sections describe the different utilities and views that ZENworks Server Management provides from the management console to monitor servers on one or more target nodes.
ZENworks Server Management provides the ping test as a quick method for you to monitor the status of a specific node. Use the ping test if you suspect a problem with a specific node in the network.
The ping test provides the status—up or down—of communication from the management console to the node as well as the round-trip delay for the ping to be received back.
Follow these steps to perform a ping test on a particular node from the management console:
1. Select the node you want to monitor.
2. Select File→Actions→Ping from the main menu. The Ping dialog box, shown in Figure 30.16, appears.

3. The IP address should be already displayed for you, if it is the default. But you can also specify a DNS name or IPX address as well at this point. You can also specify a time in milliseconds to wait before timing out. Click the Apply button.
4. View the status in the Ping Status area. The status continues to be updated at a configured interval.
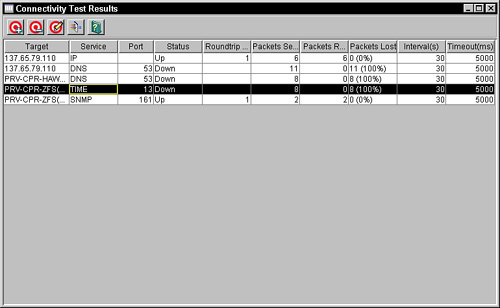
ZENworks Server Management also enables you to monitor the services of several target nodes, from the management console, through the use of a connectivity test utility and Polling view. Each of these options displays the following statistics that are dynamically updated:
![]() Target—The name or address of the node for which connectivity to services is being tested.
Target—The name or address of the node for which connectivity to services is being tested.
![]() Service—The service being monitored on the target node.
Service—The service being monitored on the target node.
![]() Port—The port number of the service on the target node.
Port—The port number of the service on the target node.
![]() Status—The status, up or down, for the service. Up means that a ping packet is sent to the service, and a reply is returned; it doesn’t necessarily mean that the service is operating normally.
Status—The status, up or down, for the service. Up means that a ping packet is sent to the service, and a reply is returned; it doesn’t necessarily mean that the service is operating normally.
![]() Roundtrip Delay—Time interval, in milliseconds, from when the remote ping server sends a ping to the target service and a reply is received back from the target.
Roundtrip Delay—Time interval, in milliseconds, from when the remote ping server sends a ping to the target service and a reply is received back from the target.
![]() Packets Sent—Number of packets sent from the remote ping server to the target node.
Packets Sent—Number of packets sent from the remote ping server to the target node.
![]() Packets Received—Number of packets received by the remote ping server that were sent from the target node.
Packets Received—Number of packets received by the remote ping server that were sent from the target node.
![]() Packets Lost—Number of ping packets and percentage of total packets lost during the connectivity testing.
Packets Lost—Number of ping packets and percentage of total packets lost during the connectivity testing.
![]() Interval—Time, in seconds, the remote ping server waits after sending one ping packet before sending the next.
Interval—Time, in seconds, the remote ping server waits after sending one ping packet before sending the next.
![]() Timeout—Time, in milliseconds, the remote ping server waits for a reply from the target node before declaring the service in a down state.
Timeout—Time, in milliseconds, the remote ping server waits for a reply from the target node before declaring the service in a down state.
The Polling view displays connectivity statistics for all configured services on the managed segment. This view can give you a quick understanding of the current status of a segment, which can be useful when trying to understand problems such as network outages or LAN overusage. To view the Polling view for a segment, select the desired segment in ConsoleOne; then select View→Polling from the main menu.
The connectivity test utility displays statistics for services from a selective group of nodes. You can tailor the Connectivity view to more closely meet your needs by adding only the most important nodes. Typically, you use the Connectivity view when you are troubleshooting issues on a selective group of servers.
Follow these steps to start the Connectivity view from the management console:
1. Select the segment that contains the nodes in which you want to monitor services.
2. Select the nodes you want to monitor services on in the right pane of the console.
3. Select File→Action→Connectivity Test from the main menu. A screen similar to the one in Figure 30.17 appears.
4. Click the Add button, located in the button bar in Figure 30.17, to add additional services (discussed in the next section) to the view.
After you have the connectivity test utility running, you can add new services to be monitored. This can be useful as you are monitoring connectivity issues on a node because it enables you to check all services on the monitored node to see whether all, some, or only a single service is affected.
ZENworks Server Management enables you to monitor the following services on monitored nodes from the management console:
![]() IP—Internet Protocol
IP—Internet Protocol
![]() IPX—Internet Packet Exchange
IPX—Internet Packet Exchange
![]() DNS—Domain Name System
DNS—Domain Name System
![]() DHCP—Dynamic Host Configuration Protocol
DHCP—Dynamic Host Configuration Protocol
![]() ECHO—Echo Protocol
ECHO—Echo Protocol
![]() FTP—File Transfer Protocol
FTP—File Transfer Protocol
![]() TFTP—Trivial File Transfer Protocol
TFTP—Trivial File Transfer Protocol
![]() HTTP—Hypertext Transfer Protocol
HTTP—Hypertext Transfer Protocol
![]() HTTPS—Hypertext Transfer Protocol Secure
HTTPS—Hypertext Transfer Protocol Secure
![]() SNMP—Simple Network Management Protocol
SNMP—Simple Network Management Protocol
![]() SMTP—Simple Mail Transfer Protocol
SMTP—Simple Mail Transfer Protocol
![]() TIME—Time Services
TIME—Time Services
![]() WUSER—Windows User
WUSER—Windows User
![]() NNTP—Network News Transfer Protocol
NNTP—Network News Transfer Protocol
![]() NFS—Network File System
NFS—Network File System
From the connectivity test utility, follow these steps to add services to the Connectivity Test window:
1. Select the target node you want to monitor another service from—or, if you want to add a server from a node not already listed, select any node.
2. Click the Add button. The Add Ping Target(s) dialog box, shown in Figure 30.18, appears.
FIGURE 30.18 The Add Ping Target(s) dialog box for the connectivity test on a monitored segment object in ConsoleOne.
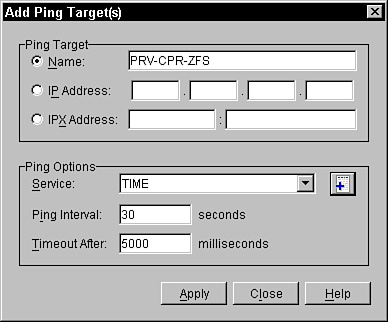
3. If you are adding a service from a node not already listed, type the name, IP address, or IPX address in the Ping Target field.
4. Select the service from the drop-down menu, or click the plus sign button next to the Service field and specify a new service and port number.
5. Specify the interval at which you want to ping the service in the Ping Interval field.
6. Specify the amount of time you want to wait for a ping reply before determining that the service is down in the Timeout After field.
On completion of these steps, click the Close button to add the service to the monitor list and close the Add Ping Target(s) dialog box, or click the Apply button to add the service to the list but keep the dialog box open to add additional services.
You must configure monitoring services on each node you want to monitor from the Polling view in the management console. The connectivity test utility simply uses a list of targets to test; however, the Polling view must read the node object contained within it and check for nodes with monitoring services enabled on them before they can be added to the view.
Follow these steps from the management console to configure and enable monitoring services on nodes you want to monitor:
1. Select the segment in which you want to monitor nodes.
2. Select a node located in the selected segment to which you want to configure monitor services.
3. Right-click the node and select Properties from the pop-up menu.
4. Select the Monitor Services tab, as shown in Figure 30.19.
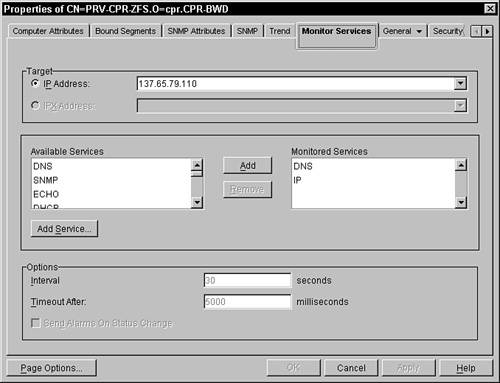
5. Select the IP or IPX address you want to use for the node. If the node is connected to multiple segments, make sure that you use the address for the segment you want to monitor.
6. Select the services that you want to monitor on the node and click the Add button, or you can also click the Add Service button to specify a new service name and port number.
7. Set the polling interval to ping the server in the Interval field.
8. Set the amount of time to wait for a reply from the service before declaring it down in the Timeout After field.
9. Specify whether to send an alarm if the state changes either from up to down or from down to up.
10. Click the Apply button to save the changes.
This completes the steps for configuring and enabling monitoring services on nodes you want to monitor.