
Chapter 32 Making the Most of ZENworks Server Management Reporting
One of the most powerful tools included with ZENworks Server Management is its extensive reporting engine. ZENworks Server Management has the capability to generate reports for you that show you everything from your server inventory to network health. ZENworks Server Management reporting can be a useful tool in helping you understand the condition of your network and plan for future additions. The following sections describe understanding, creating, and using server inventory reports, topology reports, and network health reports to quickly understand and administer your network.
All ZENworks Server Management reports are based on Crystal Reports and are executed through a delivered runtime module. You can design your own reports by creating defined reports through Crystal Reports designer and running them against the ZENworks Server Management database.
The first step is to understand what types of reports are available and what information can be obtained from them. ZENworks Server Management provides inventory reports that enable you to create lists of hardware and services available on your network to use for tracking and planning your network resources. You can use topology reports, generated by ZENworks, to understand the layout and design of your network, enabling you to plan for future growth. ZENworks Server Management also includes health reports that you can use to understand the overall health of your network and quickly diagnose issues.
ZENworks Server Management enables you to create inventory reports of hardware and software located on your managed servers. These reports can be useful if you need to know what hardware or software is on a particular machine.
Suppose, for example, that you want to install new server software that requires a server with a minimum of 256MB of RAM and a processor speed of at least 500MHz. You can use ZENworks Server Management to generate a report of all NetWare servers that are possible candidates for the software. ZENworks Server Management can generate two different types of inventory reports: simple inventory lists and comprehensive inventory lists.
The most common report you will likely use is the simple inventory list report. This report enables you to selectively create reports on every aspect of your server by selecting specific criteria that must be matched.
Simple inventory list reports are usually generated quickly, so the information you need will be almost instantaneously available. You may want to run several different inventory list reports, shown in Table 32.1, depending on what information you need.

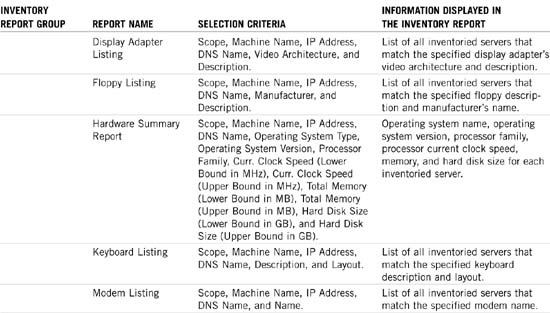
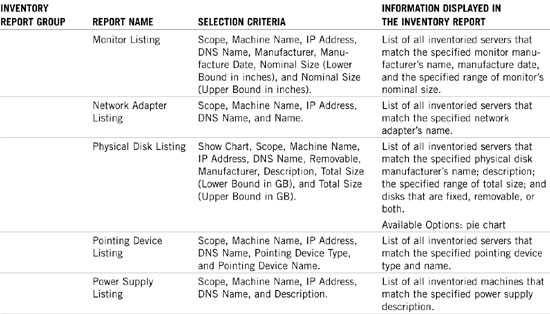
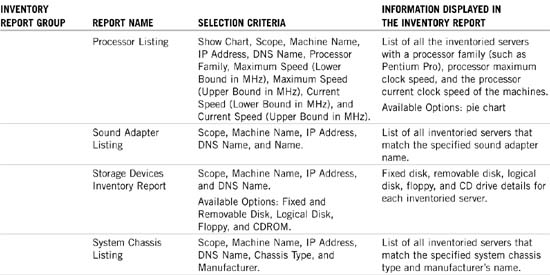
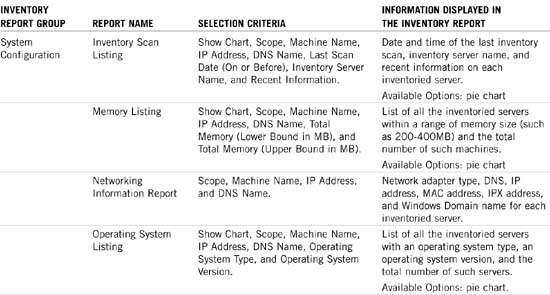
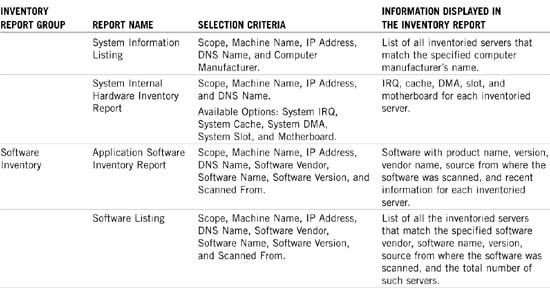
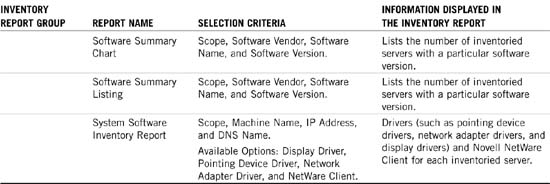
The other type of inventory report that you will use is the comprehensive inventory report. The comprehensive inventory report combines several aspects of server inventory into each report. Each report takes considerably longer to generate; however, they are more specific and inclusive. You will typically use one of the comprehensive inventory reports listed in Table 32.1 to help you with business and network planning.
ZENworks Server Management can also deliver reports on your network topology. These topology reports provide information about the specific topology of selected ZENworks Server Management sites or segments.
ZENworks Server Management can generate two basic types of topology reports. The first is a site-level report, which provides details about the discovered devices on each segment included in the ZENworks Server Management site. The second type of report is the segment-level topology report, which enables you to narrow the report down to a specific segment in the ZENworks Server Management site.
NOTE
Whenever possible, generate a segment-level topology report rather than a site-level topology report. A site-level report takes considerably longer to generate.
The five predefined topology reports that can be generated by ZENworks Server Management are discussed in the following sections.
The Computer Systems by Segment report can be done at a segment level to get only the systems in that segment; however, it is typically used as a comprehensive report to obtain a list of systems at the management site level.
The Computer Systems by Segment report lists the following information about each node and groups them by segment:
![]() System name—Node name. Use descriptive names for your systems to make these reports more useful.
System name—Node name. Use descriptive names for your systems to make these reports more useful.
![]() MAC address—Physical address.
MAC address—Physical address.
![]() IP address—IP address of node. Useful to match to captured packets and trend data.
IP address—IP address of node. Useful to match to captured packets and trend data.
![]() IPX address—IPX address of node. Useful to match to captured packets and trend data.
IPX address—IPX address of node. Useful to match to captured packets and trend data.
![]() Services—Network services running on the node. Manageable services for the computer system.
Services—Network services running on the node. Manageable services for the computer system.
![]() MIB services—MIB services running on the node. Manageable MIB services for the device.
MIB services—MIB services running on the node. Manageable MIB services for the device.
![]() Community string—Community string defined for SNMP services. SNMP community names associated with this computer system.
Community string—Community string defined for SNMP services. SNMP community names associated with this computer system.
When running the NCP Servers report, ZENworks Server Management queries the management site or segment (depending on where the report was run from) and returns the following information for each NetWare server:
![]() Server name—Use descriptive names for your servers to make these reports more useful.
Server name—Use descriptive names for your servers to make these reports more useful.
![]() MAC address—Physical address.
MAC address—Physical address.
![]() IP address—Useful to match to captured packets and trend data.
IP address—Useful to match to captured packets and trend data.
![]() IPX address—Useful to match to captured packets and trend data.
IPX address—Useful to match to captured packets and trend data.
![]() Labels—Other names by which the server is known.
Labels—Other names by which the server is known.
![]() MIB services—Manageable MIB services for the device.
MIB services—Manageable MIB services for the device.
![]() Services—Manageable services for the computer system.
Services—Manageable services for the computer system.
![]() Community strings—SNMP community names associated with reads and writes to the server.
Community strings—SNMP community names associated with reads and writes to the server.
When running the Router report, ZENworks Server Management queries the management site or segment (depending on where the report was run from) and returns the following information for each router discovered:
![]() IPX address—Useful to match to captured packets and trend data.
IPX address—Useful to match to captured packets and trend data.
![]() IP address—Useful to match to captured packets and trend data.
IP address—Useful to match to captured packets and trend data.
![]() MAC address—Physical address.
MAC address—Physical address.
![]() Labels—Other names by which the server is known.
Labels—Other names by which the server is known.
![]() MIB servers—Manageable MIB services for the device.
MIB servers—Manageable MIB services for the device.
![]() Services—Manageable services for the computer system.
Services—Manageable services for the computer system.
![]() Bound segments—Segments currently bound to the router.
Bound segments—Segments currently bound to the router.
When running the Segment report on a management site, ZENworks Server Management queries the management site and lists the number of computer systems on all segments. If this report is run at the segment level, it lists only the systems on the selected segment. The following information is shown for each computer system listed:
The Segment Topology report provides network information about routers and bridges in a ZENworks Server Management or segment (depending on where the report is run from).
The following information is shown for each router listed in the report:
![]() Router name—Use descriptive names for your routers to make these reports more useful.
Router name—Use descriptive names for your routers to make these reports more useful.
![]() MAC address—Physical address.
MAC address—Physical address.
![]() IP address—Useful to match to captured packets and trend data.
IP address—Useful to match to captured packets and trend data.
![]() IPX address—Useful to match to captured packets and trend data.
IPX address—Useful to match to captured packets and trend data.
![]() MIB services—Manageable MIB services for the device.
MIB services—Manageable MIB services for the device.
![]() Community strings—SNMP community names associated with the router.
Community strings—SNMP community names associated with the router.
The following information is shown for each bridge listed in the report:
![]() Bridge name—Use descriptive names for your bridges to make these reports more useful.
Bridge name—Use descriptive names for your bridges to make these reports more useful.
![]() Bridge type—Type of bridge device.
Bridge type—Type of bridge device.
![]() IP address—Useful to match to captured packets and trend data.
IP address—Useful to match to captured packets and trend data.
![]() Number of ports—Number of ports on bridge. This is useful when planning for network growth.
Number of ports—Number of ports on bridge. This is useful when planning for network growth.
![]() Port number (attached address)—Useful when troubleshooting software and network problems.
Port number (attached address)—Useful when troubleshooting software and network problems.
ZENworks Server Management alarm reports provide useful information about the alarms received by the ZENworks Server Management server. Alarm reports allow administrators to understand issues and visualize the current status of issues on their network better than any other report.
The three predefined alarm reports that can be generated by ZENworks Server Management are discussed in the following sections.
The Alarms Details report contains the detailed information of the alarms captured on the ZENworks Server Management site. This report is used when you need to know more detailed information about some of the alarms being triggered on your managed server.
The report provides the following information about each managed server:
![]() Alarm severity—Describes how bad the alarm is in terms of how well the node can continue functioning.
Alarm severity—Describes how bad the alarm is in terms of how well the node can continue functioning.
![]() Affected object name—Name of the node affected.
Affected object name—Name of the node affected.
![]() Source address—Address of the node affected.
Source address—Address of the node affected.
![]() Alarm state—Describes whether the alarm is active.
Alarm state—Describes whether the alarm is active.
![]() Alarm category—Describes the categorization of the alarm.
Alarm category—Describes the categorization of the alarm.
![]() Alarm generator—Describes the trap that triggered the alarm.
Alarm generator—Describes the trap that triggered the alarm.
![]() Alarm time—Time the alarm was triggered.
Alarm time—Time the alarm was triggered.
![]() Alarm owner—Person responsible for handling the alarm.
Alarm owner—Person responsible for handling the alarm.
![]() Alarm type—Describes what type of alarm was triggered.
Alarm type—Describes what type of alarm was triggered.
![]() Alarm summary—More detailed description of the alarm.
Alarm summary—More detailed description of the alarm.
The Alarms Summary report generates a short summary of the alarms on the site. This report also allows administrators to see a graphical representation of the distribution of alarms based on the selected number of days.
The report provides the following information about each managed server:
![]() Alarm severity—Describes how bad the alarm is in terms of how well the node can continue functioning.
Alarm severity—Describes how bad the alarm is in terms of how well the node can continue functioning.
![]() Alarm category—Describes the categorization of the alarm.
Alarm category—Describes the categorization of the alarm.
![]() Alarm owner—Person responsible for handling the alarm.
Alarm owner—Person responsible for handling the alarm.
![]() Alarm state—Describes whether the alarm is active.
Alarm state—Describes whether the alarm is active.
![]() Top alarm types—List the types of the most frequent alarms.
Top alarm types—List the types of the most frequent alarms.
![]() Top affected objects—Lists the names of the nodes most frequently affected by alarms.
Top affected objects—Lists the names of the nodes most frequently affected by alarms.
![]() Top source address—Lists the addresses of the nodes most frequently triggering alarms.
Top source address—Lists the addresses of the nodes most frequently triggering alarms.
The Available Trap Information report lists the information of the SNMP traps currently available on the site server.
The report is generated based on the MIBs compiled on the site server and provides the following information:
![]() Total traps—Lists the total number of traps serviced by the site.
Total traps—Lists the total number of traps serviced by the site.
![]() Alarm category—Describes the categorization of the alarms.
Alarm category—Describes the categorization of the alarms.
![]() Alarm severity—Describes the severity of the alarms.
Alarm severity—Describes the severity of the alarms.
![]() Alarm type—Describes what type of alarm was triggered.
Alarm type—Describes what type of alarm was triggered.
![]() Trap OID—Lists the MIB object ID for each trap.
Trap OID—Lists the MIB object ID for each trap.
![]() Trap description—Describes the trap in a text form.
Trap description—Describes the trap in a text form.
Network health reports provide information about the overall health of a specified ZENworks Server Management site or managed network segment. ZENworks Server Management uses a predefined health profile to generate health reports. These health profiles define the trend parameters used to calculate the overall health of the segment or site.
The following sections describe the six predefined health profiles provided with ZENworks Server Management.
The NetWare server profile is used to monitor and understand the basic health of your NetWare servers. It provides graphs and data about the following types of trend parameters used to calculate the overall health of NetWare servers on the managed site or segment:
![]() Cache buffers—Enables you to see the amount of free memory on the server. Low memory is one of the most common symptoms of a sick server.
Cache buffers—Enables you to see the amount of free memory on the server. Low memory is one of the most common symptoms of a sick server.
![]() Cache hits—Enables you to see memory usage to troubleshoot overaggressive applications.
Cache hits—Enables you to see memory usage to troubleshoot overaggressive applications.
![]() CPU utilization—Enables you to see how hard the server processor is being worked. High utilization for extended periods can lead to server health problems. Watching the server’s utilization can help you strategically plan for network growth in overused areas.
CPU utilization—Enables you to see how hard the server processor is being worked. High utilization for extended periods can lead to server health problems. Watching the server’s utilization can help you strategically plan for network growth in overused areas.
![]() Volume free space—Enables you to monitor available disk space on each volume. Low disk space, especially on the
Volume free space—Enables you to monitor available disk space on each volume. Low disk space, especially on the SYS volume, often causes server and application problems.
ZENworks Server Management uses the Microsoft Windows profile to generate reports that monitor the basic health of your Microsoft Windows servers. It provides graphs and data about the following types of trend parameters used to calculate the overall health of Microsoft Windows servers on the managed site or segment:
![]() Available memory—Enables you to see the amount of free memory on the Windows server. Low memory is one of the most common symptoms of a sick server.
Available memory—Enables you to see the amount of free memory on the Windows server. Low memory is one of the most common symptoms of a sick server.
![]() Cache hits—Enables you to see memory usage to troubleshoot overaggressive Windows applications.
Cache hits—Enables you to see memory usage to troubleshoot overaggressive Windows applications.
![]() CPU utilization—Enables you to see how hard the Windows server processor is being worked. High utilization for extended periods can lead to server health problems. Watching the Microsoft Windows server’s utilization can help you strategically plan for network growth in overused areas.
CPU utilization—Enables you to see how hard the Windows server processor is being worked. High utilization for extended periods can lead to server health problems. Watching the Microsoft Windows server’s utilization can help you strategically plan for network growth in overused areas.
![]() Disk free space—Enables you to monitor available disk space on each disk. Low disk space, especially on the Windows drive, often causes Windows server and application problems. A health report is generated for this parameter but no trend graph.
Disk free space—Enables you to monitor available disk space on each disk. Low disk space, especially on the Windows drive, often causes Windows server and application problems. A health report is generated for this parameter but no trend graph.
ZENworks Server Management uses the Linux server profile to generate reports that monitor the basic health of your Linux servers. These reports provide data that allow administrators to quickly determine the overall health of their Linux servers.
Health reports can be generated automatically on a daily, weekly, monthly, or yearly basis using the Linux server profile.
The Linux server profile uses the processor utilization trend parameter to calculate the overall status of the Linux server; however, disk reads, disk block writes, and logged-in users are also displayed on the report.
The Ethernet network profile is used to monitor and understand the basic health of your network. It provides graphs and data about the following types of trend parameters used to calculate the overall health of your Ethernet network on the managed site or segment:
![]() Total errors—Enables you to see the number of network errors occurring on your managed site or segment. This helps you troubleshoot problem networks.
Total errors—Enables you to see the number of network errors occurring on your managed site or segment. This helps you troubleshoot problem networks.
![]() Network utilization—Enables you to see the current usage of your Ethernet networks. This can help you understand which segments are being overused and help you plan for future expansion.
Network utilization—Enables you to see the current usage of your Ethernet networks. This can help you understand which segments are being overused and help you plan for future expansion.
![]() Total packets—Enables you to monitor the packets being sent on your managed Ethernet networks. A health report is generated for this parameter but no trend graph.
Total packets—Enables you to monitor the packets being sent on your managed Ethernet networks. A health report is generated for this parameter but no trend graph.
![]() Good packets—Enables you to see the good packets being sent on your managed Ethernet networks. Combined with the total packets, this can help you troubleshoot network problems and overusage. A health report is generated for this parameter but no trend graph.
Good packets—Enables you to see the good packets being sent on your managed Ethernet networks. Combined with the total packets, this can help you troubleshoot network problems and overusage. A health report is generated for this parameter but no trend graph.
The token ring network profile is used to monitor and understand the basic health of your token ring network. It provides graphs and data about the following types of trend parameters used to calculate the overall health of your token ring network on the managed site or segment:
![]() Total errors—Enables you to see the number of token ring network errors occurring on your managed site or segment. This helps you troubleshoot problems on your token ring networks.
Total errors—Enables you to see the number of token ring network errors occurring on your managed site or segment. This helps you troubleshoot problems on your token ring networks.
![]() Network utilization—Enables you to see the current usage of your token ring networks. This can help you understand which segments are being overused and help you plan for future expansion.
Network utilization—Enables you to see the current usage of your token ring networks. This can help you understand which segments are being overused and help you plan for future expansion.
Finally, the FDDI network profile is used to monitor and understand the basic health of your FDDI network. It provides graphs and data about the following types of trend parameters used to calculate the overall health of your FDDI network on the managed site or segment:
![]() Total errors—Enables you to see the number of FDDI network errors occurring on your managed site or segment. This helps you troubleshoot problems on your FDDI networks.
Total errors—Enables you to see the number of FDDI network errors occurring on your managed site or segment. This helps you troubleshoot problems on your FDDI networks.
![]() Network utilization—Enables you to see the current usage of your FDDI networks. This can help you understand which segments are being overused and help you plan for future expansion.
Network utilization—Enables you to see the current usage of your FDDI networks. This can help you understand which segments are being overused and help you plan for future expansion.
![]() Total packets—Enables you to monitor the total packets being sent on your managed FDDI networks. A health report is generated for this parameter but no trend graph.
Total packets—Enables you to monitor the total packets being sent on your managed FDDI networks. A health report is generated for this parameter but no trend graph.
Now that you understand the types of reports that ZENworks Server Management can generate and the trend profiles it uses to calculate health, you need to understand how you use the ZENworks Server Management console to create, view, and manage those reports. The following sections discuss how to use the three types of ZENworks Server Management reports to monitor and maintain your network health.
The Server Inventory report enables you to create inventory reports of hardware and software located on your managed servers, as discussed earlier in this chapter. The following sections describe how to create, customize, print, and export the Server Inventory reports.
The first step in using Server Inventory reports is knowing how to generate them. Follow these steps to generate and view the inventory report from within ConsoleOne:
1. Right-click the ZENworks Server Management site or managed segment.
2. Select Reporting from the pop-up menu.
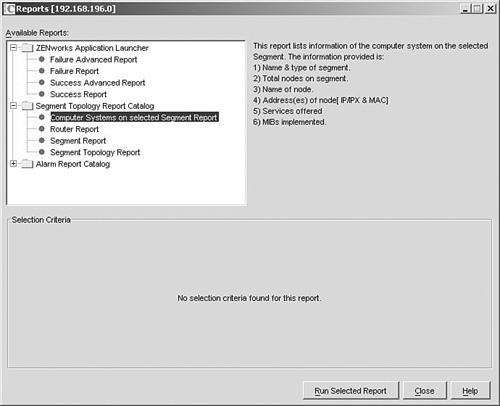
3. Select a report category from the Available Reports window, shown in Figure 32.1.

4. Specify any additional options you want to use as filters when generating the report. Each report will have different options available to filter the report and reduce the number of entries.
5. Click the Run Selected Report button. A report similar to the one shown in Figure 32.2 appears.
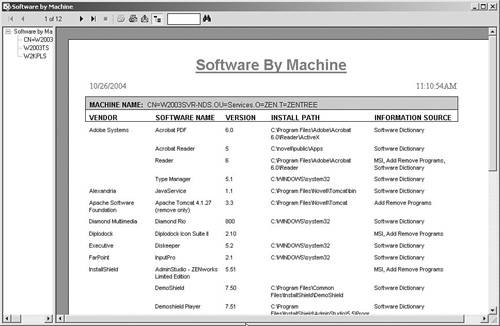
After you generate the report, it’s displayed in a window similar to the one shown in Figure 32.2. You can now view the information ZENworks Server Management collected. Notice that the report in Figure 32.2 is a software by machine listing. Listed are the server name, the software title, version (if available), and the number of servers with this software installed. The left and right arrow buttons enable you to navigate from page to page in a multipage report.
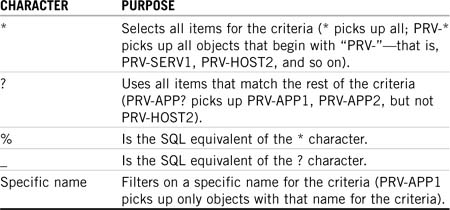
ZENworks Server Management enables you to customize the provided reports by filtering certain parameters. This is vital in large managed sites because it enables you to reduce the number of entries returned in the report. If wildcards are allowed, the report will show filter options and state that wildcard characters are allowed, as shown for the Software List report in Figure 32.1.
Table 32.2 lists several character filters you can use to narrow down your report.
After you generate the report, you may want to make a hard copy for later reference. To print the report, simply click the Printer icon shown in Figure 32.2. The Print dialog box comes up, enabling you to print the report.
You also have the option to export the report to a file. Exporting the report can be useful if you want to publish the report in a presentation or on the Web, or import it into another database.
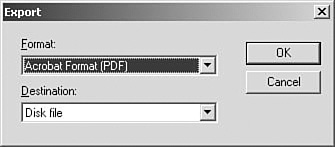
To export a report select File→Export Report from the menu when you have the report up. From the dialog box shown in Figure 32.3, specify the destination as Disk file; then select one of the following or any other of the 30 supported types of files to which ZENworks Server Management should export the report:
![]() Text—Exports the report to a simple text file that can be imported into a word processor for a status report.
Text—Exports the report to a simple text file that can be imported into a word processor for a status report.
![]() HTML—Exports the report directly to HTML format. This can be useful to publish server status directly to an internal website automatically.
HTML—Exports the report directly to HTML format. This can be useful to publish server status directly to an internal website automatically.
![]() PDF—Exports the report to an Adobe Acrobat format. This can be useful when preparing a presentation or publishing it on the Web.
PDF—Exports the report to an Adobe Acrobat format. This can be useful when preparing a presentation or publishing it on the Web.
![]() SDF—Exports the report to a Standard Delimited Format (SDF). This is useful to import the report into another database for tracking purposes. You must specify a common delimiter such as a comma, space, or tab.
SDF—Exports the report to a Standard Delimited Format (SDF). This is useful to import the report into another database for tracking purposes. You must specify a common delimiter such as a comma, space, or tab.
![]() XML—Exports the report to an XML document that can be distributed and read from a variety of XML interfaces.
XML—Exports the report to an XML document that can be distributed and read from a variety of XML interfaces.
ZENworks Server Management also enables you to generate topology reports that can help you understand the status and infrastructure of your network. You can generate two types of reports, one based at a managed site level and the other based at a segment level. The segment level reports provide information about managed devices on the selected segment only.
Follow these steps to generate and view one of the types of topology reports from within ConsoleOne:
1. Right-click the ZENworks Server Management site or managed segment.
2. Select Reporting from the pop-up menu.
3. Select a topology report category from the Reports window, shown in Figure 32.4.
4. Click the Run Selected Report button. A report similar to the one shown in Figure 32.5 appears.
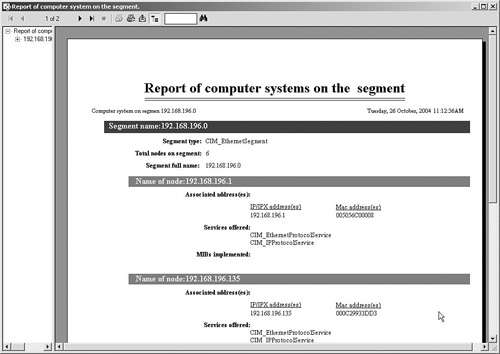
After you generate the topology report, it’s displayed in a Report window similar to the one shown in Figure 32.5. You can now view the information collected by ZENworks Server Management, such as segment names, addresses, and nodes. The left and right arrow buttons enable you to navigate from page to page in a multipage report. You also have the same options to export and print the report as you do with inventory reports.
The final type of ZENworks Server Management report is the Network and Server Management health report. You should become familiar with this report. The six standard profiles used by ZENworks Server Management to generate health reports were discussed earlier in the chapter:
![]() NetWare server profile
NetWare server profile
![]() Linux server profile
Linux server profile
![]() Microsoft server profile
Microsoft server profile
![]() Ethernet server profile
Ethernet server profile
![]() FDDI network profile
FDDI network profile
The following sections discuss using those six basic profiles, as well as customizing profiles of your own to schedule, run, and view health reports.
The first step when working with network health reports is learning how to customize one of the existing health profiles that you use to generate a health report. Customizing an existing health profile means modifying the trend parameters, discussed earlier in the chapter, to more accurately reflect the health of the monitored devices.
Follow these steps to customize one of the existing health profiles from within ConsoleOne:
1. Right-click the ZENworks Server Management managed site object and select Properties from the pop-up menu.
2. Select the Health Profiles tab.
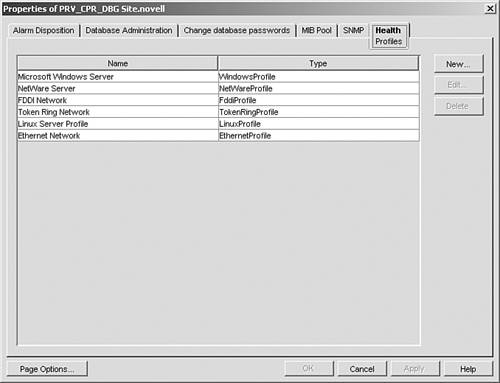
3. Select the health profile you want to customize and click the Edit button, as shown in Figure 32.6. If you do not want to edit one but want to create a new one, click the New button (discussed in the next section).
FIGURE 32.6 Available health profiles in the Health Profiles tab for a managed site object in ConsoleOne.
4. From the Edit profile box, shown in Figure 32.7, you can modify the directory location to which reports generated by this profile should be published by typing a network path in the Publish Directory box.

5. Modify the trend parameters used to calculate health by either checking or unchecking the In Health Calculation box next to them. This adds or removes the parameter from a list used to calculate the health of the device or segment.
6. Modify the rank of importance of each of the selected trend parameters by specifying a value in the Weight field. You may enter any whole number in the Weight field. ZENworks Server Management uses the number you specify to determine how important the parameter is in calculating the overall health of the device or segment. Larger numbers mean more weight is given to the trend parameter when calculating health of the device.
7. Modify the trend parameters you want to see rendered graphically in the health report. Data from the parameters selected will be calculated and graphically represented on the health report.
On completion of these steps, click OK to save your changes.
Adding a new health profile means defining the location of the report, the type of report, the trend parameters, and the weights to parameters used to generate a health report of the monitored device. Follow these steps to add a new health profile from within ConsoleOne:
1. Right-click the ZENworks Server Management managed site object and select Properties from the pop-up menu.
2. Select the Health Profiles tab.
3. Select the health profile you want to customize and click the New button, as shown previously in Figure 32.6.
4. From the New Profile dialog box, shown in Figure 32.8, type in the name of the new profile.
FIGURE 32.8 Drop-down list of health profile types shown in the New Profile dialog box in ConsoleOne.
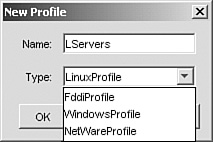
5. Select the type of device or segment to which the profile applies from the drop-down list, as shown in Figure 32.8.
6. Click OK. The Edit Profile dialog box appears.
7. From the Edit Profile box, shown in Figure 32.9, you can modify the directory location to which reports generated by this profile should be published by typing a network path in the Publish Directory box.
FIGURE 32.9 The Edit Profile dialog box showing the health trend parameters and location for the new health profile in ConsoleOne.

8. Select the trend parameters used to calculate health by either checking or unchecking the In Health Calculation box next to them. This adds or removes the parameter from a list used to calculate the health of the device or segment.
9. Enter the rank of importance of each of the selected trend parameters by specifying a value in the Weight field. You may enter any whole number in the Weight field. ZENworks Server Management uses the number you specify to determine how important the parameter is in calculating the overall health of the device or segment. Larger numbers mean more weight is given to the trend parameter when calculating health of the device.
10. Select which of the trend parameters you want to see rendered graphically in the health report. Data from the parameters selected will be calculated and graphically represented on the health report.
On completion of these steps, click OK to save your changes.
After you create and customize the health profiles for your managed network devices and segments, you need to know how to create and schedule a health report to run. You must tell ZENworks Server Management which devices you want a health report to be run on, what type of report to run, and when to run it.
Follow these steps in ConsoleOne to create and schedule a health report:
1. Right-click the ZENworks Server Management managed site object or a container object in the ZENworks Server Management namespace and select Properties from the pop-up menu.
2. Select the Health Reports tab, as shown in Figure 32.10.
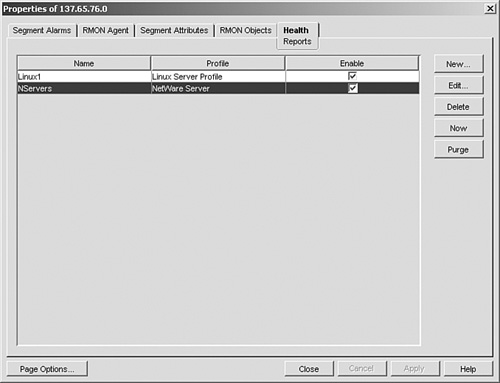
3. Click the New button. The Edit Report dialog box appears.
4. From the Edit Report dialog box, shown in Figure 32.11, enter the name you want to call the report.
FIGURE 32.11 The Edit Profile dialog box showing the health trend parameters and location for the new health profile in ConsoleOne.
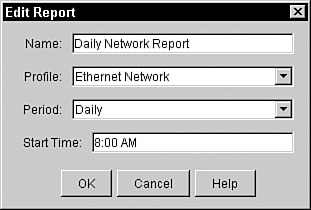
5. Select the profile that you want ZENworks Server Management to use when generating the health report by selecting one of the available types from the Profile drop-down list.
6. Set the frequency that you want to run by selecting Daily, Weekly, or Monthly from the Period drop-down list.
7. Set the time that you want the health report to be generated by entering the appropriate values in the Start Time field.
8. Click OK. The report will be generated by using the date and time that you entered for the report.
TIP
Schedule reports to run at optimal times to balance data gathering and network performance. Some of the segment reports, for example, tend to be somewhat network intensive; therefore, you may not want to run them at 9 a.m., when all users are logging in and network usage is at its peak. It could be more advantageous to run them at 1:00 a.m. when the system is slow.
Now that you understand how to schedule health reports to run, you should also be familiar with how to force them to run. Although health reports are scheduled to run on a daily, weekly, or monthly basis at predefined times, you may also need to run them at unscheduled times.
You may, for example, want to force a report to run if you are troubleshooting a network problem, or if you need to know the current health of a segment of servers before upgrading them.
Follow these steps in ConsoleOne to force a health report to run:
1. Right-click the ZENworks Server Management managed site object or a managed container object and select Properties from the pop-up menu.
2. Select the Health Reports tab, shown earlier in Figure 32.10.
3. Select the report to which you want to force generation.
4. Click the Now button, and the report is saved to the publish directory specified in the health profile for the report.
Now that you understand how to schedule a health report or force one to run, you need to know how to actually view it. After ZENworks Server Management creates the health report, it will be automatically published to a directory specified by its controlling profile.
Also located in the published directory is an HTML document named INDEX.HTM that is associated with the health report. The INDEX.HTM file is an HTML document that contains a Java application that provides access to all the reports stored in the directory.
Follow these steps to view a health report after ZENworks Server Management generates it:
1. From your console workstation, browse to the directory where the health reports for the associated profile are stored.
2. Open the INDEX.HTM file located in the directory specified in the controlling profile. The left column of INDEX.HTM lists the report hierarchy based on profiles and your network topology.
3. Click the plus sign next to the health profile associated with the health report you want to view. The profile object expands to display a list of container objects.
4. Click the plus sign next to the container object associated with the health report you want to view. The container object should expand and display a list of report names associated with it.
5. Click the plus sign next to the report you want to view. The report object expands to display a list of instances of that particular report. A report scheduled to run daily, for example, would have one instance for each day the report was run. The date and time at which the report was run is used to generate the report’s name. A report generated on October 11, 2005, at 5:05:00 Mountain Daylight Time would have a name of 2005.10.11_05.05.00_MDT.
6. Click the plus sign next to the report name to display a list of individual report pages. The number of report pages depends on which profile you selected and which managed device or segment the report was generated for.
7. Click the individual report page to display the health report in the right frame, as shown in Figure 32.12. The top of the report displays statistical information about the segment or device and provides an overall calculation of health. The trend parameters specified in the report’s health profile are listed with trend data. Below the statistical information are trend graphs depicting health based on the trend data selections in the health profile.
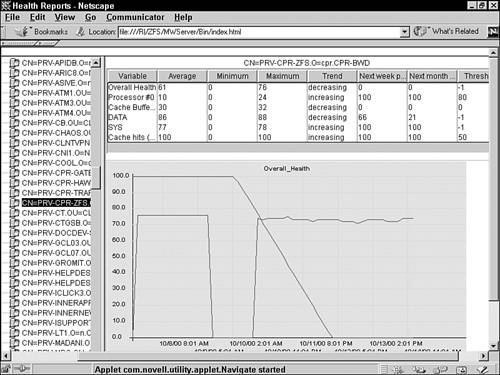
You can now click the Print button at the bottom of the left frame to print the report if you need a hard copy.
NOTE
The Java application in the INDEX.HTM file for health reports requires that the Java 1.1.2 plug-in for your Web browser be installed prior to viewing the report. If you do not have the plug-in, you cannot view the report. Also, if there has not been a report fully generated in that directory yet, the Java application will fail to initialize.