
Appendix G. Debugging and Profiling OpenGL
This appendix describes the facilities provided by debug contexts, which can greatly assist you in finding errors in your programs and in getting the best possible performance from OpenGL. This appendix contains the following major sections:
• “Creating a Debug Context” explains how to create OpenGL contexts in debug mode, enabling debugging features.
• “Debug Output” describes how OpenGL communicates debugging information back to your application.
• “Debug Groups” delves deeper into debug output, showing how your application, any utility libraries, and tools you use can cooperate to group parts of your scenes for debug purposes.
• “Profiling” concludes the appendix with information about profiling and optimizing your application for performance.
Not all platforms provide debug contexts, so you may need to find an alternate platform that does to try out these features. Specific platforms that do provide debug contexts are discussed next.
Creating a Debug Context
To get the most from OpenGL’s debugging facilities, it is necessary to create a debug context, which implies that you need control over the flags and parameters used to create the context. Context creation is a platform-specific task that is often handled by a wrapper layer such as GLFW. Most such wrapper libraries include functions that can be used to control how the contexts subsequently created behave. This includes the ability to enable a debug context. If you are not using an abstraction layer, you will need to directly interface to your platform’s context-creation mechanisms.
In WGL (the window system layer for Microsoft Windows), you need to use the WGL_ARB_create_context extension and access the wglCreateContextAttribsARB() function. This function takes as one of its parameters an attribute list. By specifying the WGL_CONTEXT_DEBUG_BIT_ARB as one of the context flags, a debug context will be created. The code to create this context is given in Example G.1.
Example G.1 Creating a Debug Context Using WGL
HGLRC CreateDebugContext(HDC hDC, HGLRC hShareContext,
int major, int minor)
{
const int attriblist[] =
{
// Major version of context
WGL_CONTEXT_MAJOR_VERSION_ARB,
major,
// Minor version of context
WGL_CONTEXT_MINOR_VERSION_ARB,
minor,
// Always select a core profile
WGL_CONTEXT_PROFILE_MASK_ARB,
WGL_CONTEXT_CORE_PROFILE_BIT_ARB,
// Turn on the debug context
WGL_CONTEXT_FLAGS_ARB,
WGL_CONTEXT_DEBUG_BIT_ARB,
0
};
return wglCreateContextAttribsARB(hDC, hShareContext, attribs);
}
Note that due to some limitations in the design of WGL, it is not possible to use any WGL extensions without first creating a context. This is because wglGetProcAddress() will return NULL if no context is current at the time it is called. This means that you will need to create a context with wglCreateContext() first, make it current, get the address of the wglCreateContextAttribsARB() function, and then create a second context using that function. If you wish, you may delete the first context. Ultimately, though, you will always end up creating at least two contexts in any new application that uses a core profile context or needs debugging features.
GLX has a similar mechanism, using the similarly named glXCreateContextAttribsARB() function. Unlike in WGL, there is no requirement to create and activate a context before determining the address of glXCreateContextAttribsARB(), so you should use this function to create the first (and possibly only) context in your application. Code for GLX equivalent to Example G.1 is given in Example G.2.
Example G.2 Creating a Debug Context Using GLX
GLXContext CreateDebugContext(Display* dpy,
GLXFBConfig config,
GLXContext share_context,
int major, int minor)
{
const int attriblist[] =
{
// Major version of context
GLX_CONTEXT_MAJOR_VERSION_ARB,
major,
// Minor version of context
GLX_CONTEXT_MINOR_VERSION_ARB,
minor,
// Always select a core profile
GLX_CONTEXT_PROFILE_MASK_ARB,
GLX_CONTEXT_CORE_PROFILE_BIT_ARB,
// Turn on the debug context
GLX_CONTEXT_FLAGS_ARB,
GLX_CONTEXT_DEBUG_BIT_ARB,
0
};
return glXCreateContextAttribsARB(dpy, config,
share_context,
True, attriblist);
}
Creating a debug context doesn’t really do anything special; it just tells OpenGL that you’re intending to use its debugging facilities and that it should turn them on. Once development of your application is completed and you’re no longer debugging, you should turn the debug context off, as some of the debugging features supported by OpenGL may come at a performance cost. Once your application is debugged and working correctly, you no longer need a debug context, and it’s best to avoid this potential performance loss in a shipping application.
Debug Output
The primary feature of a debug context is the ability to perform additional error checking and analysis. There are two ways that a debug context can get this information back to you. The first, which is really intended to support remote rendering, is via a log that is part of the context and must be queried. The second, far more efficient mechanism is through the use of a callback function. The reason that a log exists for remote rendering is that a remote server cannot call a callback function in the client application. However, whenever direct rendering is in use, it is strongly recommended to use the callback function.
A callback function is essentially a function pointer that you pass a third-party component (such as OpenGL). That component holds on to the pointer and calls it when it needs the attention of the host application. The callback function has an agreed-upon prototype and calling convention such that both sides of the call know how that call should be handled. The prototype for the callback function is shown in Example G.3. You hand the pointer to a function with this prototype using the glDebugMessageCallback() function, whose prototype and a simple implementation are
Example G.3 Prototype for the Debug Message Callback Function
typedef void (APIENTRY *DEBUGPROC)(GLenum source,
GLenum type,
GLuint id,
GLenum severity,
GLsizei length,
const GLchar* message,
void* userParam);
void APIENTRY DebugCallbackFunction(GLenum source,
GLenum type,
GLuint id,
GLenum severity,
GLsizei length,
const GLchar* message,
void* userParam)
{
printf("Debug Message: SOURCE(0x%04X), "
"TYPE(0x%04X), "
"ID(0x%08X), "
"SEVERITY(0x%04X), "%s"
",
source, type, id, severity, message);
}
Debug Messages
Each message generated by OpenGL is comprised of a text string and a number of attributes. These are passed back to the application in the parameters to the callback function. The prototype of the callback function is shown in Example G.3, with this declaration of the function:
Each debug message has several attributes associated with it: the source, type, and severity of the message, and a unique identifier for that message. These attributes are passed to the callback function you’ve specified and can also be used as the basis for message filtering, which will be covered shortly. The source may be one of the following:
• GL_DEBUG_SOURCE_API indicates that the message originates from direct usage of OpenGL.
• GL_DEBUG_SOURCE_WINDOW_SYSTEM indicates that the message originates from the window system (e.g., WGL, GLX, or EGL).
• GL_DEBUG_SOURCE_SHADER_COMPILER indicates that the message is generated by the shader compiler.
• GL_DEBUG_SOURCE_THIRD_PARTY indicates that the message is generated by a third-party source, such as a utility library, middleware, or tool.
• GL_DEBUG_SOURCE_APPLICATION indicates that the message was generated explicitly by the application.
• GL_DEBUG_SOURCE_OTHER indicates that the message does not fit into any of the above categories.
Messages with the source GL_DEBUG_SOURCE_THIRD_PARTY or GL_DEBUG_SOURCE_APPLICATION should never be generated by the OpenGL implementation but are instead injected into the debug message stream explicitly by a tool or library, or by the application directly. The mechanisms to insert messages into the debug stream will be covered shortly.
Each debug message also has a type. This allows your application to determine what to do with the message. The available types of message are as follows:
• GL_DEBUG_TYPE_ERROR is generated when an error is generated.
• GL_DEBUG_TYPE_DEPRECATED_BEHAVIOR is produced by the use of deprecated functionality in OpenGL.
• GL_DEBUG_TYPE_UNDEFINED_BEHAVIOR is generated if the application has attempted to use functionality in a way that might produce undefined results.
• GL_DEBUG_TYPE_PERFORMANCE indicates that the application is using OpenGL in a way that is not optimal for performance.
• GL_DEBUG_TYPE_PORTABILITY is generated if the behavior of the application is relying on the functionality of the OpenGL implementation that may not be portable to other implementations or platforms.
• GL_DEBUG_TYPE_MARKER is used for annotation of the debug stream.
• GL_DEBUG_TYPE_PUSH_GROUP is generated when the application calls glPushDebugGroup().
• GL_DEBUG_TYPE_POP_GROUP is generated when the application calls glPopDebugGroup().
• GL_DEBUG_TYPE_OTHER is used when the type of the debug message does not fall into any of the above categories.
In addition to a source and a type, each debug message has a severity associated with it. Use the severity to again filter or otherwise direct the output. For example, an application may choose to log all messages but cause a break into a debugger in the case that a high-severity message is encountered. The available severities are as follows:
• GL_DEBUG_SEVERITY_HIGH is used to mark the most important messages and generally would be used for OpenGL errors, shader compiler failures, and so on.
• GL_DEBUG_SEVERITY_MEDIUM is used to mark messages that the application really should know about but that may not be fatal. These might include portability issues and performance warnings.
• GL_DEBUG_SEVERITY_LOW is used when the OpenGL implementation needs to tell the developer about issues that they should address but that won’t be detrimental to the functioning of the application. These might include minor performance issues, redundant state changes, and so on.
• GL_DEBUG_SEVERITY_NOTIFICATION is used to mark messages that may not have a negative consequence, such as a tool attaching to an application or initialization of the context.
Finally, the unique identifier assigned to each message is implementation-dependent and may be used for any purpose.
Enabling Debug Output
It is possible to enable or disable debug output globally without affecting filter state. In a debug context, debug output is on by default, and you should receive fairly verbose messages from the context if your application does anything it shouldn’t. However, in a nondebug context, while the default is to not produce any debug output, it is possible to enable debug messages anyway. You should be aware that a nondebug context may not generate very useful output; in fact, it may generate nothing at all. To enable or disable debug output, use glEnable() or glDisable() with the GL_DEBUG_OUTPUT.
In many cases, OpenGL may operate somewhat asynchronously to the application. In some implementations, OpenGL might batch up several function calls and execute them later. This can help the implementation work around redundancy in the command stream or batch related state changes together and validate a lot of parameters in one go. In other implementations, the OpenGL driver might run in multiple threads that could be behind the application in processing order. The debug output is often generated when parameters are validated or even cross-validated against each other, and this can happen some time after the actual error has occurred from the application’s perspective. The net result is that the debug callback might not be called immediately when the application generates an error, but when the OpenGL implementation validates the requested state changes.
To change this behavior, it is possible to ask OpenGL to operate synchronously with regards to generating debug output. To do this, call glEnable() with the GL_DEBUG_OUTPUT_SYNCHRONOUS parameter. This is disabled by default, although some implementations may force all debug output to be synchronous in a debug context, for example. However, it’s generally a good idea to turn synchronous debug output on if you want to rely on it for catching errors.
Filtering Messages
Messages are filtered before they are sent to your callback function. When you create a debug context, by default, only medium- and high-severity messages are sent to your callback function. You can enable and disable various types of messages, filter messages by severity, and even turn individual messages on and off using their identifiers. To do this, use glDebugMessageControl().
If source is GL_DONT_CARE, the source of the messages will not be used when forming the filter. That is, messages from any source will be considered to match the filter. Likewise, if either type or severity is GL_DONT_CARE, the type or severity of the message will not be included in the filter, respectively, and messages of any type or severity will be considered to match the filter. If count is nonzero, it indicates the number of items in the array ids, allowing messages to be filtered by their unique identifiers. Example G.4 shows a couple of examples of how to build filters to enable and disable certain classes of debug messages.
Example G.4 Creating Debug Message Filters
// Enable all messages generated by the application
glDebugMessageControl(GL_DEBUG_SOURCE_APPLICATION, // Application
// messages
GL_DONT_CARE, // Don't care about type
GL_DONT_CARE, // Don't care about severity
0, NULL, // No unique identifiers
GL_TRUE); // Enable them
// Enable all high-severity messages
glDebugMessageControl(GL_DONT_CARE, // Don't care about origin
GL_DONT_CARE, // Don't care about type
GL_DEBUG_SEVERITY_HIGH, // High-severity messages
0, NULL, // No identifiers
GL_TRUE); // Enable
// Disable all low-severity messages
glDebugMessageControl(GL_DONT_CARE, // Don't care about origin
GL_DONT_CARE, // Don't care about type
GL_DEBUG_SEVERITY_LOW, // Low-severity messages
0, NULL, // No identifiers
GL_FALSE);
// Enable a couple of messages by identifiers
static const GLuint messages[] = { 0x1234, 0x1337 };
glDebugMessageControl(GL_DONT_CARE, // Don't care about origin
GL_DONT_CARE, // Don't care about type
GL_DONT_CARE, // Don't care about severity
2, messages, // 2 ids in 'messages'
GL_TRUE);
Application-Generated Messages
There are two sources of message that are reserved for the application or its helper libraries and tools. These two sources are GL_DEBUG_SOURCE_APPLICATION, which is intended to be used by the application for its own messages, and GL_DEBUG_SOURCE_THIRD_PARTY, which is intended for use by third-party libraries such as middleware or by tools such as debuggers and profilers. Messages with these two source identifiers should never be generated by an OpenGL implementation. Instead, they may be injected into the debug output stream by the application, library, or tool. To do this, call glDebugMessageInsert(), whose prototype is as follows:
When you call glDebugMessageInsert(), the message contained in buf is sent directly to the context’s callback function (which might be inside your application or inside a debugging or profiling tool). The values you pass in source, type, id, and severity are passed as specified to the callback function. In general, you should use GL_DEBUG_SOURCE_APPLICATION for messages generated by your application (or GL_DEBUG_SOURCE_THIRD_PARTY if you are writing a tool or utility library). Example G.5 shows an example of sending a message via the glDebugMessageInsert() function.
Example G.5 Sending Application-Generated Debug Messages
// Create a debug context and make it current
MakeContextCurrent(CreateDebugContext());
// Get some information about the context
const GLchar * vendor = (const GLchar *)glGetString(GL_VENDOR);
const GLchar * renderer = (const GLchar *)glGetString(GL_RENDERER);
const GLchar * version = (const GLchar *)glGetString(GL_VERSION);
// Assemble a message
std::string message = std::string("Created debug context with ") +
std::string(vendor) + std::string(" ") +
std::string(renderer) +
std::string(". The OpenGL version is ") +
std::string(version) + std::string(".");
// Send the message to the debug output log
glDebugMessageInsert(GL_DEBUG_SOURCE_APPLICATION,
GL_DEBUG_TYPE_MARKER,
0x4752415A,
GL_DEBUG_SEVERITY_NOTIFICATION,
-1,
message.c_str());
Here is the result of executing this code on a debug context with the example implementation of the debug callback function given in Example G.3:
Debug Message: SOURCE(0x824A), TYPE(0x8268),
ID(0x4752415A), SEVERITY(0x826B), "Created
debug context with NVIDIA Corporation GeForce
GTX 560 SE/PCIe/SSE2. The OpenGL version is
4.3.0."
Debug Groups
In a large, complex application, you may have many subsystems rendering various parts of the scene. For example, you may render the world, dynamic and animated objects, special effects and particle systems, user interfaces, or postprocessing. At any given moment, it is likely that you’ll be concentrating your attention on just one of these elements. You may be debugging issues or concentrating on performance. It is likely that you’ll want to turn on very verbose debug message reporting for the sections of code you’re working on while leaving debug messages at their most concise levels for code that you’ve already debugged. To do this, you will need to turn certain categories of messages on and off and to restore the debug log to its original state. You would need to query the current state of the debug context to determine whether certain types of messages are enabled or disabled.
Rather than trying to implement all of this yourself, you can rely on OpenGL’s debug groups, which is a stack-based system of filters that allows you to push the current debug state onto an internal stack managed by OpenGL, modify the state, and then return to a previously saved state by popping it off the stack. The functions to do this are glPushDebugGroup() and glPopDebugGroup().
In addition to allowing the current state of the debug output filters to be saved and restored, pushing and popping the debug group generates messages to the debug output callback function. This function, often implemented inside tools and debuggers, can track the current depth of the debug group stack and apply formatting changes to the displayed output, such as coloring or indentation.
Each implementation has a maximum depth of the debug group stack. This depth must be at least 64 groups, but you can find the actual maximum by calling glGetIntegerv() with the parameter GL_MAX_DEBUG_GROUP_STACK_DEPTH. If you attempt to push more than this number of debug groups onto the stack, glPushDebugGroup() will generate a GL_STACK_OVERFLOW error. Likewise, if you try to pop an item from an empty stack, glPopDebugGroup() will generate a GL_STACK_UNDERFLOW error.
Naming Objects
When OpenGL generates debugging messages, it will sometimes make reference to objects such as textures, buffers, or framebuffers. In a complex application, there may be hundreds or thousands of textures and buffers in existence at any given time. Each of these objects has a unique identifier that was assigned by OpenGL’s glCreateTextures(), glCreateBuffers(), or other name-generation functions, and those names may have no bearing on what the application intends to use them for. It is possible to name the objects by giving them labels. If you give an object a label, when a reference to it appears in a debug message, OpenGL will use the object’s label rather than (or as well as) its number. To give an object a label, use glObjectLabel() or glObjectPtrLabel().
When you apply a label to an object, the label is stored with the object by OpenGL. When it is referred to in a debug message, OpenGL can use the label you provided rather than just using the numerical name directly. You can also retrieve the label of the object by calling glGetObjectLabel() or glGetObjectPtrLabel().
For both glObjectLabel() and glGetObjectLabel(), name is the numerical name of the object that was provided by OpenGL through a call to glCreateTextures(), glCreateBuffers(), or other object creation functions. Because names for different object types are allocated from different name spaces (the same numeric value can refer to both a texture and a buffer, for example), the identifier parameter is provided to allow you to tell OpenGL which name space name resides in. identifier must be one of the following tokens:
• GL_BUFFER indicates that name is the name of a buffer object generated by glCreateBuffers().
• GL_SHADER indicates that name is the name of a shader object generated by glCreateShader().
• GL_PROGRAM indicates that name is the name of a program object generated by glCreateProgram().
• GL_VERTEX_ARRAY indicates that name is the name of a vertex array object.
• GL_QUERY indicates that name is the name of a query object generated by glCreateQueries().
• GL_PROGRAM_PIPELINE indicates that name is the name of a program pipeline object generated by glCreateProgramPipelines().
• GL_TRANSFORM_FEEDBACK indicates that name is the name of a program pipeline object generated by glCreateProgramPipelines().
• GL_SAMPLER indicates that name is the name of a sampler object generated by glCreateSamplers().
• GL_TEXTURE indicates that name is the name of a texture.
• GL_RENDERBUFFER indicates that name is the name of a renderbuffer.
• GL_FRAMEBUFFER indicates that name is the name of a framebuffer.
The maximum length of a label that can be applied to an object is given by the value of the implementation-dependent constant GL_MAX_LABEL_LENGTH. One potential use of object labels, for example, is to modify your texture-loading code such that the generated texture objects are labeled with the filename of the texture. Then if there’s a problem with a particular texture, a tool might be able to cross-reference the texture object with the file that it was loaded from to verify that the data ended up in the right place.
Profiling
Once your application is close to its final state, you may wish to turn your attention to performance tuning. One of the most important aspects of performance tuning is not the modifications you make to your code to make it run faster, but the measurements and experiments you make to determine what you should do to your code to achieve your desired performance goals. This is known as performance profiling.
Performance measurement techniques generally fall into two1 categories. The first is tool-assisted profiling, and the second involves actually making changes to your code to measure its execution time.
1. Not including “Try a bunch of stuff and see what happens.”
Profiling Tools
Perhaps the most powerful way to profile your application is to use an external profiling and debugging tool. This type of tool hooks OpenGL on a running system and intercepts the function calls that your application makes. The simplest tools merely take a log of the function calls, perhaps gathering statistics or other information about them. Some of these tools may even allow you to play back the resulting trace and replicate the execution of your application in a stand-alone environment. More advanced tools allow you to inspect data that flows between the application and OpenGL, to time execution of various elements of the scene and even to modify the application’s behavior as it executes by disabling parts of the OpenGL pipeline, replacing shaders or textures with alternatives, and so on.
One such application is AMD’s GPUPerfStudio 2, a screen shot of which is shown in Figure G.1.2
2. Figure G.1 courtesy of AMD.
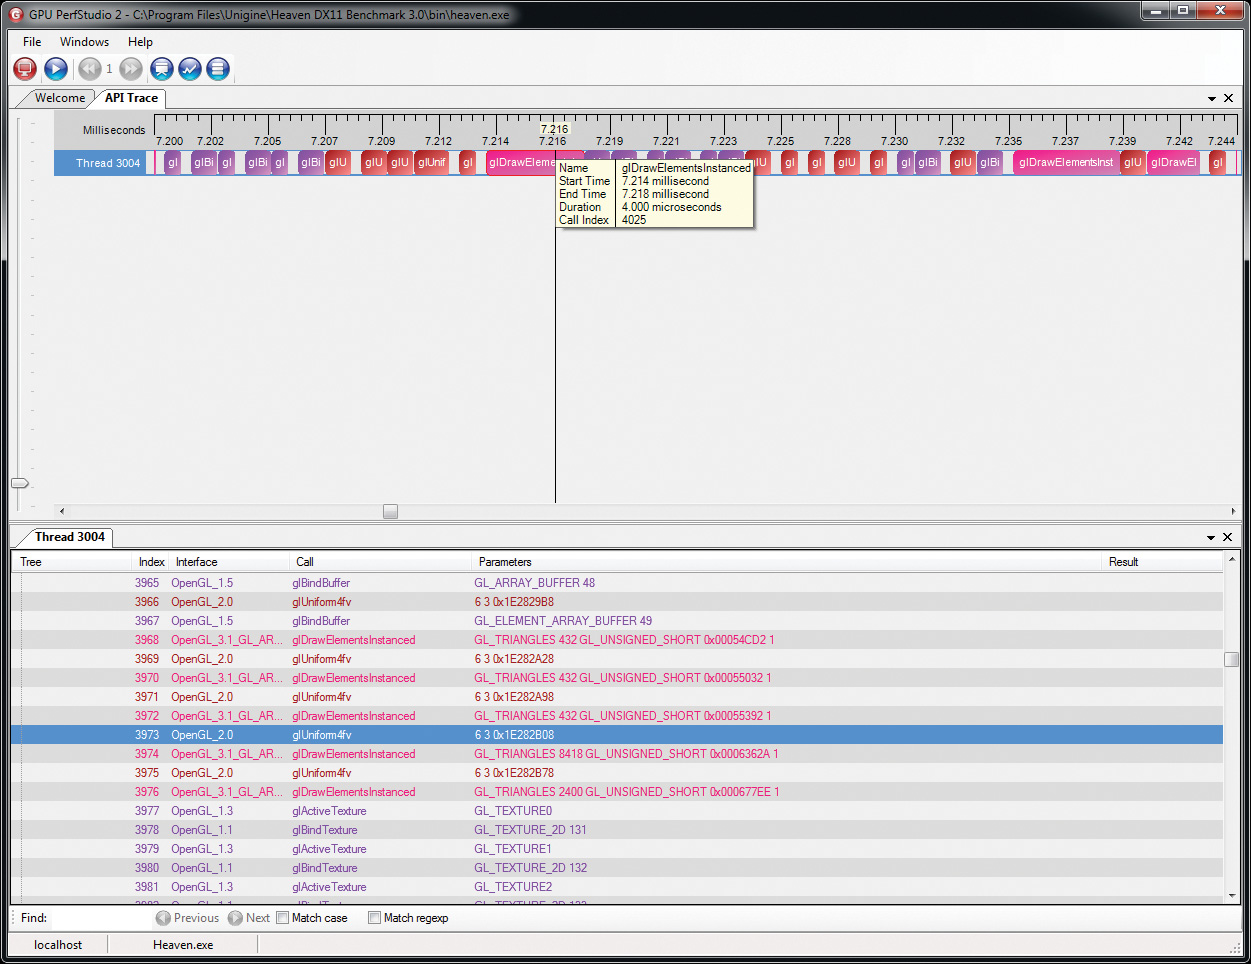
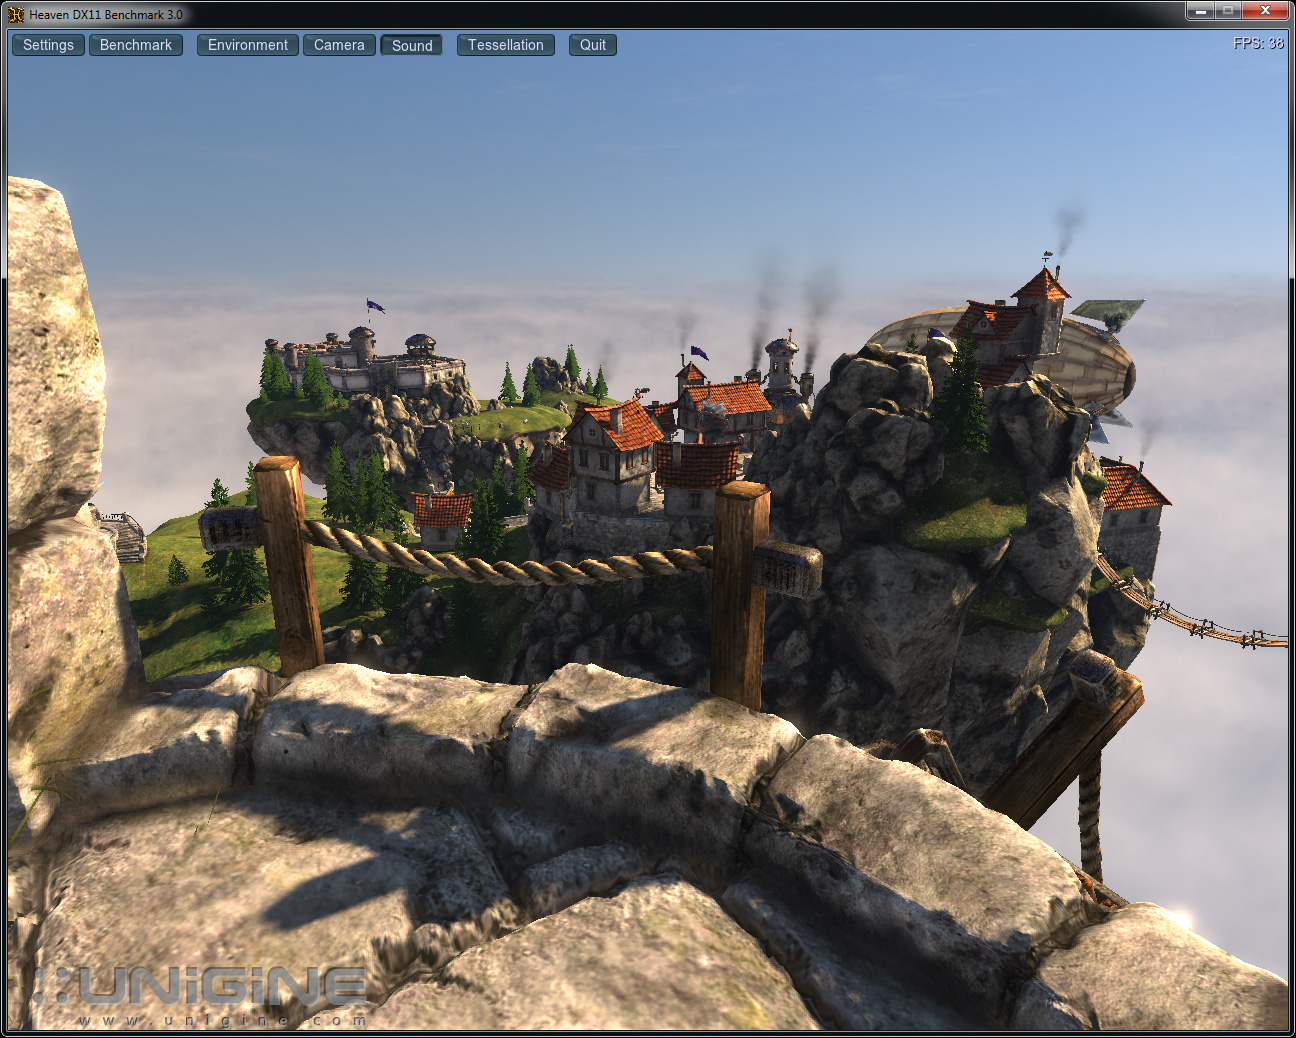
In Figure G.1, GPUPerfStudio 2 is being used to examine the application’s call trace generated by the Unigine Heaven 3.0 benchmark, which makes advanced use of modern OpenGL. A screen shot of the application is shown in Figure G.2.3 The application makes use of advanced graphics features including tessellation, instancing, and off-screen rendering, and renders effects such as reflections and volumetric lighting effects. GPUPerfStudio 2 is able to capture the OpenGL calls made by the benchmark and measure their execution time. On some GPUs, it is even able to measure the amount of time various parts of the OpenGL pipeline (such as the texture processor, tessellation engine, blending unit, etc.) spend on individual commands. The tool will tell you if you are making too many draw commands, which ones are the most expensive, and what the GPU spends its time on for each one. Profiling tools such as GPUPerfStudio 2 are invaluable resources for performance tuning and debugging OpenGL applications.
3. Figure G.2 is of Unigine Heaven DX11 benchmark, developed by Unigine Corp.: https://unigine.com/. Used by permission.
In-Application Profiling
It is possible for your application to measure its own performance. A naïve approach is to simply measure the amount of time taken for a particular piece of code to execute by reading the system time or just measuring frame rate. (Besides, frame rate is a fairly poor measure of application performance.) However, assuming that your application is efficiently written, the goal is for the graphics processor to be the bottleneck, and therefore you are interested in the amount of time it takes to process parts of your scene.
You can make these measurements yourself. In fact, some tools may use very similar mechanisms to measure GPU performance by injecting equivalent sequences of commands into your application’s rendering thread. OpenGL provides two types of timer queries for this purpose. The two types are an elapsed time query and an instantaneous time query. The first operates very similarly to an occlusion query, as described in “Occlusion Query” in Chapter 4.
Elapsed Time Queries
Elapsed time queries use the GPU’s internal counters to measure the amount of time it spends processing OpenGL commands. As with occlusion queries, you wrap one or more rendering commands in a timer query and then read the results of the query back into the application, ideally at a later time so as to not force the GPU to finish rendering that may be in the pipeline.
To start an elapsed time query, call glBeginQuery() with the target parameter set to GL_TIME_ELAPSED and with id set to the name of a query object retrieved from a call to glCreateQueries(). To end the query, call glEndQuery() again with the target parameter set to GL_TIME_ELAPSED. Once the query has ended, retrieve the result by calling glGetQueryObjectuiv() with the name of the query object in id and the pname parameter set to GL_QUERY_RESULT. The resulting value is the time, measured in nanoseconds, to execute the commands between the calls to glBeginQuery() and glEndQuery(). You should be aware that a nanosecond is an extremely small amount of time. One unsigned integer is large enough to count roughly four seconds’ worth of nanoseconds, after which it will roll over and start from zero again. If you expect your timer queries to last a very long time (such as the duration of several tens or hundreds of frames), you might want to use glGetQueryObjectui64v(), which retrieves the result as a 64-bit number.4
4. 64 bits worth of nanoseconds should allow you to count until the end of the universe.
An example of using an elapsed time query is shown in Example G.6.
Example G.6 Using an Elapsed Time Query
GLuint timer_query;
GLuint nanoseconds;
// Create the timer query
glCreateQueries(GL_TIME_ELAPSED, 1, &timer_query);
// Set up some state... (not relevant to the timer query)
glEnable(GL_DEPTH_TEST);
glDepthFunc(GL_LEQUAL);
glEnable(GL_BLEND);
glBlendFunc(GL_SRC_ALPHA, GL_ONE_MINUS_SRC_ALPHA);
glBindVertexArray(vao);
// Begin the query
glBeginQuery(GL_TIME_ELAPSED, timer_query);
// Draw some geometry
glDrawArraysInstanced(GL_TRIANGLES, 0, 1337, 1234);
// End the query
glEndQuery(GL_TIME_ELAPSED);
// Go do something time-consuming so as to not stall the OpenGL pipeline
do_something_that_takes_ages();
// Now retrieve the timer result
glGetQueryObjectuiv(timer_query, GL_QUERY_RESULT, &nanoseconds);
Instantaneous Timer Queries
Instantaneous timer queries also use the query object mechanism to retrieve times measured in nanoseconds from the GPU. However, as they are essentially snapshots of the GPU clock, they don’t have a duration and are never “current,” and so they cannot be used with glBeginQuery() or glEndQuery(). Instead, you use the glQueryCounter() function to issue a time-stamp query.
When glQueryCounter() is called, OpenGL inserts a command into the GPU’s queue to record its current time into the query object as soon as it comes across it. It may still take some time to get to the time-stamp query, so your application should perform meaningful work before retrieving the result of the query. Again, to get the result of the query object, call glGetQueryObjectuiv(). Once you have instantaneous time stamps taken at various parts of your scene, you can take deltas between them to determine how long each part of the scene took, in GPU time, and have some idea what is making the application expensive to execute and where you should focus your energy as you try to make it run faster.