
27
Photovoltaic System Conversion
Electrical Engineering Department, The Petroleum Institute, P. O. Box 2533, Abu Dhabi, UAE
27.1 Introduction
27.2 Solar Cell Characteristics
27.3 Photovoltaic Technology Operation
27.4 Maximum Power Point Tracking Components
27.4.1 Voltage Feedback Control
27.4.2 Power Feedback Control
27.5 MPPT Controlling Algorithms
27.5.1 Perturb and Observe (PAO)
27.5.2 Incremental Conductance Technique (ICT)
27.5.3 Constant Reference
27.5.4 Current-Based Maximum Power Point Tracker
27.5.5 Voltage-Based Maximum Power Point Tracker
27.5.6 Other Methods
27.6 Photovoltaic Systems’ Components
27.7 Factors Affecting PV Output
27.8 PV System Design
27.8.1 Criteria for a Quality PV System
27.8.2 Design Procedures
27.8.3 Power-Conditioning Unit
27.8.4 Battery Sizing
27.9 Summary
27.1 Introduction
For many years, fossil fuels have been the primary source of energy. However, due to the limited supply, the rate of deployment of fossil fuels is more rapid than their rate of production, and hence, fossil fuels will eventually run out. Moreover, the threat of global climate change caused by carbon dioxide (CO2) emissions from fossil fuels is one of the main reasons for the increasing consensus to reduce the consumption of such fuels. This reduction can be achieved by switching to renewable energy for many energy-requiring applications, since it is “clean” and “green.” Today, the global trend is to use nondepletable clean source of energy for a healthier and greener environment to save the future generation. The most efficient and harmless energy source is probably solar energy, which is so technically straightforward to use in many applications. Almost, all renewable energy sources, except nuclear and geothermal, are the energy forms originating from the solar energy.
Solar energy is considered one of the most promising energy sources due to its infinite power. Thus, modern solar technologies have been penetrating the market at faster rates, and photovoltaic (PV) technology that has the greatest impact, not because of the amount of electricity it produces but because photovoltaic cells –working silently, not polluting –can generate electricity wherever sun shines, even in places where no other form of electricity can be obtained [1]. PV is a combination of the Greek word for light and the name of the physicist Alessandro Volta [2]. PV is the direct conversion of sunlight into electricity by means of solar cells.
This chapter will highlight in brief how solar cells produce electricity and will discuss in detail the various techniques available to track the sun in order to maximize the output power generated by the PV array. Moreover, the various components required to operate PV systems efficiently will be described.
27.2 Solar Cell Characteristics
Solar cells are composed of various semiconductor materials that become electrically conductive when supplied with heat or light. The majority of the first-generation solar cells produced are composed of silicon (Si), which exists in sufficient quantities. However, more than 95% of these cells have power conversion efficiency about 17% [4], whereas solar cells developed over the last decade in laboratory environment have efficiency as high as 31% [5]. All technologies related to capturing solar energy to be used as direct electricity generator are described as photovoltaic technology, which is subdivided into crystalline, thin film, and nanotechnology.
Doping technique is used to obtain excess of positive charge carriers (p-type) or a surplus of negative charge carriers (n-type). When two layers of different doping are in contact, then a p-n junction is formed on the boundary.
An internal electric field is built up causing the separation of charge carriers released by light, freeing electrons within the electric field proximity, which then pull the electrons from the p-side to the n-side (Fig. 27.1). The primary solar cell equivalent circuit (Fig. 27.2) contains a current source with a parallel diode, in addition to parasitic series (Rs; normally small) [6] and shunt (Rsh) resistances (relatively large) [7]. Rs is mainly affected by the factors such as the bulk resistance of the semiconductor material, metallic contacts, and interconnections, whereas Rsh is affected mainly by the p-n junction nonidealities and impurities near the junction [8].
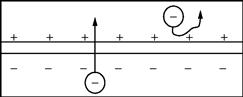
FIGURE 27.1 Effect of the Electric Field in a PV Cell [3].
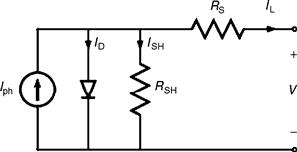
FIGURE 27.2 Solar cell equivalent circuit [8].
A simplified equivalent circuit is shown in Fig. 27.3.
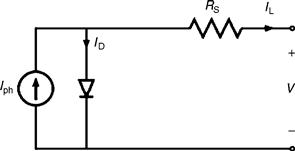
FIGURE 27.3 Model for a PV cell [9].
The diode current is given by the Shockley equation:
![]() (27.1)
(27.1)
where I0 is the reverse saturation current, q is the charge carrier, k is the Boltzman constant, T is the cell temperature, and n is the ideality factor.
The PV module has two limiting components (Fig. 27.3): open-circuit voltage (Voc) and short-circuit current (Isc). To determine Isc, set V = 0 and Isc = Iph Eq. (27.4), and this value changes proportionally to the cell irradiance. To determine Voc, set the cell current Il = 0, hence Eq. (27.3) leads to
![]() (27.2)
(27.2)
The PV module can also be characterized by the maximum point when the product (Vmp (voltage, where power is maximum) ×Imp (current, where power is maximum)) is at its maximum value. The maximum power output is derived by
![]() (27.3)
(27.3)
and
![]() (27.4)
(27.4)
A PV module is normally rated using its Wp, which is normally 1 kW/m2 under standard test conditions (STC), which defines the PV performance at an incident sunlight of 1000 W/m2, a cell temperature of 25°C (77°F), and an air mass (AM) of 1.5. The product (Vmp × Imp) is related to the product generated by (VOC × ISC) by a fill factor (FF) that is a measure of the junction quality and series resistance, and it is given by
![]() (27.5)
(27.5)
The closer the FF is to unity, the higher the quality of the PV module.
Finally, the last and most important factor of merit for a PV module is its efficiency (η), which is defined as
![]() (27.6)
(27.6)
Pin represents the incident power depending on the light spectrum incident on the PV cell.
To achieve the desired voltage and current levels, solar cells are connected in series (Ns) and parallel (Np) combinations forming a PV module. The PV parameters are then affected as shown below [9]:
![]() (27.7)
(27.7)
This model is shown in Figure 27.4.
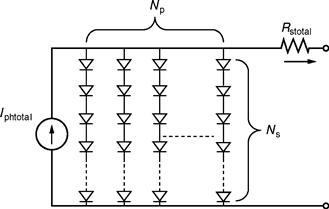
FIGURE 27.4 PV module circuit model.
In order to obtain the appropriate voltages and outputs for different applications, single solar cells are interconnected in series (for larger voltage) and in parallel (for larger current) to form the photovoltaic module. Then, several of these modules are connected to each other to form the photovoltaic array. This array is then fitted with aluminum or stainless steel frame and covered with transparent glass on the front side (Fig. 27.5).
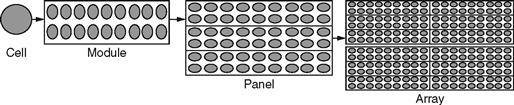
FIGURE 27.5 Photovoltaic cells, modules, panels, and array [10].
The voltage generated by the array depends primarily on the design and materials of the cell, whereas the electric current depends primarily on the incident solar irradiance and the cell area. This current fluctuates since the path of the sun varies dramatically over the year, with winter and summer seasons being the two extreme excursions. The elevation angle of the sun (θelevationsun) is expressed in degrees above the horizon. Azimuth angle (ϕazimuthsun) of the sun is expressed in degrees from true north. Zenith angle (θzenithsun) of the sun equals 90 degrees less than the elevation angle of the sun, or
![]() (27.11)
(27.11)
Azimuth, zenith, and elevation angles are illustrated in Fig. 27.6
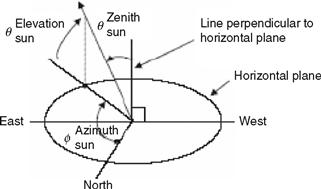
FIGURE 27.6 Azimuth, zenith, and elevation angles of a vector pointed toward the sun [11].
The output from a typical solar cell that is exposed to the sun, therefore, increases from zero at sunrise to a maximum at midday, and then falls again to zero at dusk. The radiation of the sun varies when reaching the surface of the earth due to absorption and scattering effect in the earth's atmosphere. PV system designers require the estimate of the insolation expected to fall on a randomly tilted surface, hence need a good evaluation of global radiation on a horizontal surface, horizontal direct and diffuse components, in order to estimate the amount of irradiation striking a tilted plane.
27.3 Photovoltaic Technology Operation
Photovoltaic technology is used to produce electricity in areas where power lines do not reach. In developing countries, it helps improving living conditions in rural areas, especially in health care, education, and agriculture. In industrialized countries, such technology has been used extensively and integrated with the utility grid.
Photovoltaic arrays are usually mounted in a fixed position and tilted toward the south to optimize the noontime and the daily energy production. The orientation of fixed panel should be carefully chosen to capture the most energy for the season, or for a year. Photovoltaic arrays have an optimum operating point called the maximum power point (MPP) as shown in Fig. 27.7 [12].
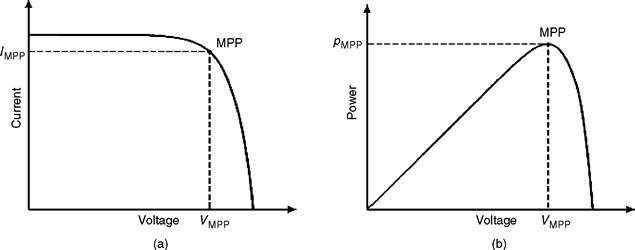
FIGURE 27.7 (a) I—V characteristic of a solar cell showing maximum power point (MPP); (b) P—V characteristic of a solar cell showing MPP.
It is noted that power increases as voltage increases, reaching a peak value and decreases as the resistance increases to a point where current drops off. According to the maximum power transfer theory, this is the point where the load is matched to the solar panel's resistance at a certain level of temperature and insolation. The I—V curve changes as the temperature and insolation levels change as shown in Fig. 27.8 and thus the MPP will vary accordingly [13].
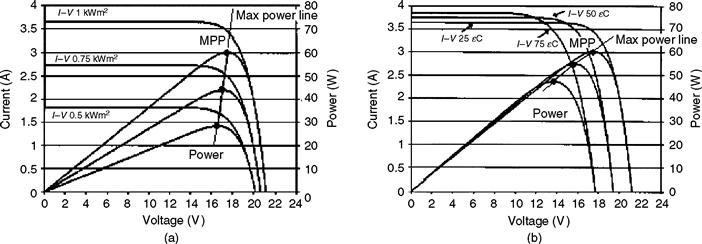
FIGURE 27.8 (a) PV panel insolation characteristics; (b) PV panel temperature characteristics [13].
It is shown that the open-circuit voltage increases logarithmically while the short-circuit current increases linearly as the insolation level increases [14]. Moreover, increasing the temperature of the cell decreases the open-circuit voltage and increases slightly the short-circuit current, causing reduction in the efficiency of the cell.
The PV panels, usually mounted on the roof or at a near open area, are fixed to face the sun at an angle matching the country's latitude. If possible, seasonal adjustment of the module's direction toward the sun is done manually. Since solar power technology is relatively expensive, it is important to operate panels at their maximum power conditions. However, to collect as much solar radiation as possible, it is more convenient and efficient to use a sun tracking mechanism causing the module's surface to track the sun throughout the day.
The tracking can be along either one axis or two axes, whereby double axes tracking provides higher power output. The energy yield can be thus increased by about 20% to 30% depending on the seasonal climate and geographical location [15–17]. Although some claim that a fixed system costs less and requires almost no maintenance [18], different tracking mechanisms utilized to control the orientation of the PV panels have proved their superiority over fixed systems in terms of converted power efficiency.
To get maximum power from the PV panel at the prevailing temperature and insolation conditions, either the operating voltage or current should be controlled by a maximum power point tracker (MPPT) that should meet the following conditions [19]:
27.4 Maximum Power Point Tracking Components
The MPPT increases the energy that can be transferred from the array to an electrical system. The main function is to adjust the panel's output voltage to supply the maximum energy to the load. Most current designs consist of three basic components: switch-mode dc-dc converter, control system, and tracking component.
The switch-mode converter is the core of the entire supply because the energy drawn, stored as magnetic energy, is released at different potential levels. By setting up the switch-mode section in various topologies such as buck or boost converter, voltage converters are designed providing a fixed input voltage or current, which correspond to the maximum power point, allowing the output resistance to match the battery. To achieve the above-stated mechanism, a controller is essential to continuously monitor the PV system and ensure its operation at the PV maximum power point by tracking this MPP. The controller's aim is to continuously measure the voltage and current values generated from the PV, and compare them to certain treshhold values in order to apply either voltage controlled method or power feedback control [20].
27.4.1 Voltage Feedback Control
With the PV array terminal voltage being the controlled variable, voltage feedback controller forces the PV array to operate at its MPP by changing the array terminal voltage and neglecting the variation in the temperature and insolation level [20, 21].
27.4.2 Power Feedback Control
In this method, power delivered to the load is the controlled variable. To achieve maximum power, dp/dv should be zero. This control scheme is not affected by the characteristics of the PV array, yet it increases power to the load and not power from the PV array [20, 21]. Factors such as fast shadows may cause trackers to lose the MPP momentarily. It is very critical to ensure that the time lost in seeking MPP again, which equates the energy lost while the array is off power point, is very short. On the other hand, if lighting conditions do change, the tracker needs to respond within a short amount of time to the change avoiding energy loss. Therefore, the controller's most important feature is its capability to quickly adjust the system to operate back at the MPPT.
27.5 MPPT Controlling Algorithms
Several proposed algorithms to accomplish MPPT are described in the following sections.
27.5.1 Perturb and Observe (PAO)
The PAO method has a simple feedback structure and few measured parameters. It operates by periodically perturbing (i.e. incrementing or decrementing) the duty cycle while controlling the array current as shown in Fig. 27.9 and comparing the PV output power with that of the previous perturbation cycle. It measures the derivative of power Δp and the derivative of voltage Δν to determine the movement of the operating point. If the perturbation leads to an increase (or decrease) in array power, the subsequent perturbation is made in the same (or opposite) direction. This cost-effective technique can be easily implemented and is characterized by continuously tracking and very efficiently extracting the maximum power from PV. However, such method may fail under rapidly changing atmospheric conditions due to its slow tracking speed.
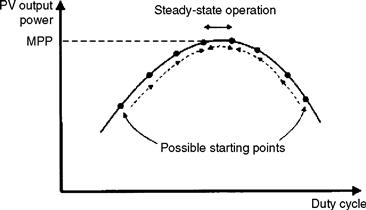
FIGURE 27.9 PAO technique [19].
27.5.2 Incremental Conductance Technique (ICT)
The ICT process based on the fact that the derivative of the power with respect to the voltage (dp/dv) vanishes at the MPP because it is the maximum point on the curve as shown in Fig. 27.10.
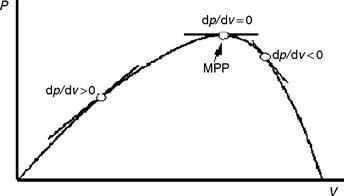
FIGURE 27.10 The slope “conductance” of the P-V curve [22].
The ICT algorithm detects the MPP by comparing di/dv against ![]() till it attains the voltage operating point at which the incremental conductance is equal to the source conductance [23, 24]. The Reference [23] describes in detail the ICT algorithm used for maximum power point tracking. The algorithm starts by measuring the present values of the I and V, then uses the corresponding stored value (Ib, and Vb) measured during the preceding cycle to calculate the incremental changes as: dI = I –Ib, and dV = V –Vb. Based on the result obtained, the control reference signal Vref will be adjusted in order to move the array voltage toward the MPP voltage. At the MPP,
till it attains the voltage operating point at which the incremental conductance is equal to the source conductance [23, 24]. The Reference [23] describes in detail the ICT algorithm used for maximum power point tracking. The algorithm starts by measuring the present values of the I and V, then uses the corresponding stored value (Ib, and Vb) measured during the preceding cycle to calculate the incremental changes as: dI = I –Ib, and dV = V –Vb. Based on the result obtained, the control reference signal Vref will be adjusted in order to move the array voltage toward the MPP voltage. At the MPP, ![]() , no control action is needed; therefore, the adjustment stage will be bypassed and the algorithm will update the stored parameters at the end of the cycle. In order to detect any changes in weather conditions, the algorithm detects whether a control action took place when the array was operating at the previous cycle MPP (dv = 0). This technique is accurate and well suited for rapid changes in atmospheric conditions; however, because the increment size approach is used to determine how fast the system is responding, ICT requires precise calculations of both instantaneous and increasing conductance.
, no control action is needed; therefore, the adjustment stage will be bypassed and the algorithm will update the stored parameters at the end of the cycle. In order to detect any changes in weather conditions, the algorithm detects whether a control action took place when the array was operating at the previous cycle MPP (dv = 0). This technique is accurate and well suited for rapid changes in atmospheric conditions; however, because the increment size approach is used to determine how fast the system is responding, ICT requires precise calculations of both instantaneous and increasing conductance.
27.5.3 Constant Reference
One very common MPPT technique is to compare the PV array voltage (or current) with a constant reference voltage (or current), which corresponds to the PV voltage (or current) at the maximum power point, under specific atmospheric conditions. The resulting difference signal (error signal) is used to drive a power conditioner, which interfaces the PV array to the load. Although the implementation of this method is simple, the method itself is not very accurate because it does not consider the effects of temperature and irradiation variations in addition to the difficulty in choosing the optimum point [19].
27.5.4 Current-Based Maximum Power Point Tracker
Current-based maximum power point tracker (CMPPT) is another MPPT technique that exists [22]. Employed numerical methods show a linear dependence between the “cell currents corresponding to maximum power” and the “cell short-circuit currents.” The current IMPP operating at the MPP is calculated using the following equation:
![]() (27.12)
(27.12)
where MC is the “current factor” that differs from one panel to another and is affected by the panel surface conditions, especially if partial shading covers the panel [25]. Although this method is easy to implement, additional switch is added to the power converter to periodically short the PV array, increase the cost, and reduce the output power. This method also suffers from a major drawback due to periodic tuning requirement.
27.5.5 Voltage-Based Maximum Power Point Tracker
Similar to the above-mentioned method, voltage-based maximum power tracking (VMPPT) technique can also be applied [22]. The MPP operating voltage is calculated directly from VOc
![]() (27.13)
(27.13)
where MV is the “ voltage factor.” The open-circuit voltage Voc is sampled by an analogue sampler, and then VMPP is calculated by Eq. (27.13). This operating Vmpp voltage is the reference voltage for the voltage control loop as shown in Fig. 27.11. This method always “results in a considerable power error because the output voltage of the PV module only follows the unchanged reference voltage during one sampling period” [9]. Albeit the implementation of this procedure is simple, it endures several disadvantages such as momentarily power converter shutdown causing power loss. Furthermore, such process depends greatly on the I–V characteristics and requires periodic tuning.
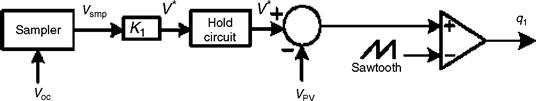
FIGURE 27.11 The conventional MPPT controller using open-circuit voltage VOC [26].
Other researchers argue that these two practices are considered to be “fast, practical, and powerful methods for MPP estimation of PV generators under all insolation and temperature conditions” [27].
27.5.6 Other Methods
Automated techniques such as Fibonacci line search, ripple correlation control method, neural network, and fuzzy logic have also been introduced for MPPT. In order to generate a clear understanding in determining the advantages and disadvantages of each algorithm, a comprehensive experimental comparison between different MPPT algorithms was made and run for the same PV setup at South Dakota State University [28], and results showed that the ICT method has the highest efficiency of 98% in terms of power extracted from the PV array, the PAO technique has the efficiency of 96.5%, and finally, the constant voltage method has the efficiency of 88%.
The ICT method provided good performance under rapidly changing weather conditions and provided the highest tracking efficiency, although four sensors were required to perform the measurements for computations and decision making [23]. If the system required more conversion time in tracking the MPP, a large amount of power loss would occur [20]. On the contrary, under perturb and observe method, losses are reduced if the sampling and execution speed were increased. The main benefit of this procedure is that only two sensors are required, which resulted in the reduction of hardware requirements and cost.
27.6 Photovoltaic Systems’ Components
Once the PV array is controlled to perform efficiently, a number of other components are required to control, convert, distribute, and store the energy produced by the array. Such components may vary depending on the functional and operational requirements of the system. They may require battery banks and controller, dc–ac inverters, in addition to other components such as overcurrent, surge protection and, other processing equipment. Fig. 27.12 shows a basic diagram of a photovoltaic system and the relationship with each component.
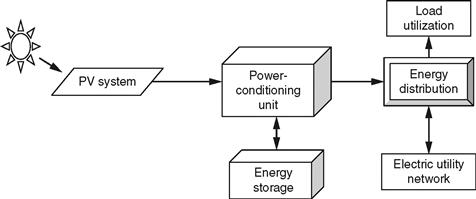
FIGURE 27.12 Major photovoltaic system components [8].
Photovoltaic systems are classified into two major classes: grid-connected photovoltaic systems and stand-alone photovoltaic systems.
27.6.1 Grid-Connected Photovoltaic System
Grid-connected photovoltaic systems are composed of PV arrays connected to the grid through a power conditioning unit and are designed to operate in parallel with the electric utility grid as shown in Fig. 27.13. The power conditioning unit may include the MPPT, the inverter, the grid interface as well as the control system needed for efficient system performance [29] There are two general types of electrical designs for PV power systems: systems that interact with the utility power grid as shown in Fig. 27.13a and have no battery backup capability, and systems that interact and include battery backup as well as shown in Fig. 27.13b. The latter type of system incorporates energy storage in the form of a battery to keep “critical load” circuits operating during utility outage. When an outage occurs, the unit disconnects from the utility and powers specific circuits of the load. If the outage occurs in daylight, the PV array is able to assist the load in supplying the loads.
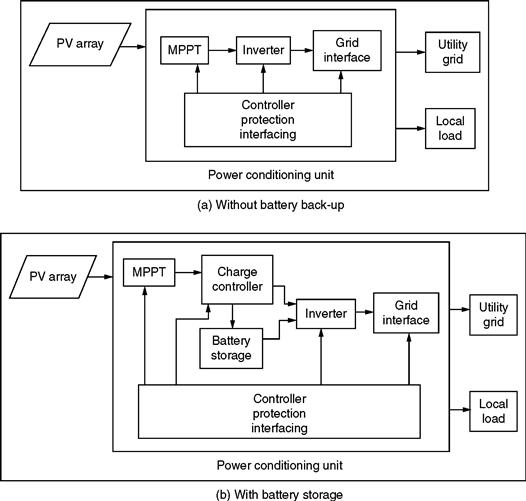
FIGURE 27.13 Grid-Connected PV system.
The major component in both systems is the DC-AC inverter or also called the power conditioning unit (PCU). The inverter is the key to the successful operation of the system, but it is also the most complex hardware. The inverter requirements include operation over a wide range of voltages and currents and regulated output voltage and frequency while providing AC power with good power quality which includes low total harmonic distortion and high power factor, in addition to highest possible efficiency for all solar irradiance levels. Several interconnection circuits have been described in [30, 31]. Inverters can be used in a centralized connection (Fig 27.14a for the whole array of PV or each PV module string is connected to a single inverter (Fig. 27.14b [29]. The second proposed procedure is more efficient since it minimizes the losses due to voltage/current mismatching as well as it enhances it modularity capability. Moreover, the inverter may contain protective devices that monitor the grid and islands the grid from the PV system in case of fault occurrence [32].
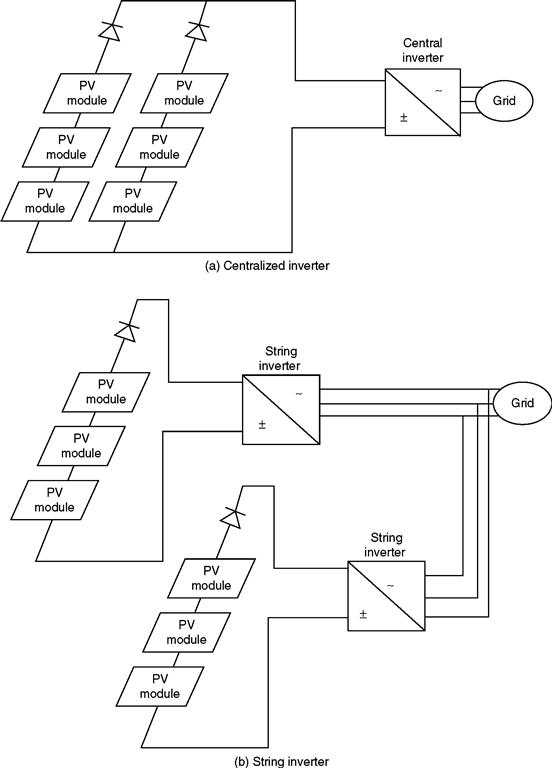
FIGURE 27.14 Grid-Connected PV system.
For the last twenty years, researchers have been working on developing different inverter topologies that satisfy the above listed requirements. The evolution of solid state devices such as Metal Oxide semiconductor Field Effect Transistors (MOSFETs), Insulated Gate Bipolar Transistors (IGBTs), microprocessors, PWM integrated circuits have allowed improvements on the inverter. However, more research is being carried to ensure quality control, reliability and lower cost since inverters are the key for a sustainable photovoltaic market.
The main advantage of PV systems is their flexibility to be implemented in remote locations where grid connection is either impossible or very expensive to execute. Such systems are called stand-alone PV systems and are described in the following section.
27.6.2 Stand-Alone Photovoltaic Systems
Stand-alone photovoltaic systems are usually a utility power alternate. They generally include solar charging modules, storage batteries, and controls or regulators as shown in Fig. 27.15. Ground or roof-mounted systems will require a mounting structure, and if ac power is desired, an inverter is also required. In many stand-alone PV systems, batteries are used for energy storage as they may account for up to 40% of the overall stand-alone PV system cost over its lifetime [33].
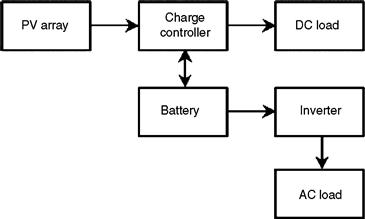
FIGURE 27.15 Diagram of stand-alone PV system with battery storage power DC and AC loads [8].
These batteries cause losses in the PV system due to limited availability of time and energy to recharge the battery in addition to the insufficient battery maintenance. Hence, a charge controller is then used to control the system and prevent the battery from overcharging and overdischarging. Overcharging shortens the battery life and may cause gassing while undercharging may lead to sulphation and stratification, which result in the reduction in battery effectiveness and lifetime [34–37].
Batteries are often used in PV systems for storing energy produced by the PV array during daytime and supplying it to electrical loads as needed (during nighttime or cloudy weather). Moreover, batteries are also needed in the tracker systems to operate at MPP in order to provide electrical loads with stable voltages. Nearly, most of the batteries used in PV systems are deep cycle lead-acid batteries [38]. These batteries have thicker lead plates that make them tolerate deep discharges. The thicker the lead plates, the longer the life span of the batteries. The heavier the battery for a given group size, the thicker the plates and the better the battery will tolerate deep discharges [39].
All deep cycle batteries are rated in ampere-hour (AH) capacity, a quantity of the amount of usable energy it can store at nominal voltage [40]. A good charge rate is approximately 10% of the total capacity of the battery per hour. This will reduce the electrolyte losses and the damage to the plates [38]. A PV system may have to be sized to store a sufficient amount of power in the batteries to meet power demand during several days of cloudy weather, known as “days of autonomy.” The Institute of Electrical and Electronics Engineers (IEEE) has set several guidelines and standards for sizing lead-acid batteries (IEEE Std 1013–1990) [41], for selecting, charging, and testing in stand-alone PV systems (IEEE Std 1361–2003) [42], and for installing and maintaining them (IEEE Std 937–2007) [43].
Nickel-cadmium batteries are also used for PV stand-alone systems but are often expensive and “may have voltage compatibility issues with certain inverters and charge controls” [44]. However, their main advantage is they are not affected by temperature as other battery types, hence mostly recommended for industrial or commercial applications in cold locations. IEEE has also drafted some guidelines for installation and maintenance (IEEE Std 1145–1999) [45].
To extend battery's lifetime and for efficient system's operation, a charge controller is needed to regulate the flow of electricity from the PV modules to the battery and the load. The controller keeps the battery fully charged without overcharging it. Many controllers have the ability to sense the excess of electricity drawn from batteries to the load and stop the flow until sufficient charge is restored to the batteries. The latter can greatly extend the battery's lifetime. However, controllers in stand-alone photovoltaic system are more complex devices that depend on battery state of charge, which in turn depends on many factors and is difficult to measure. The controller must be sized to handle the maximum current produced. Several characteristics should be considered before selecting a controller such as adjustable set-points including high-voltage and low-voltage disconnects, temperature compensation, low-voltage warning, and reverse current protection. Moreover, the controller should ensure that no current flows from the battery to the array at night.
27.7 Factors Affecting PV Output
PV systems produce power in proportion to the intensity of sunlight striking the solar array surface. Thus, there are some factors that affect the overall output of the PV system and are discussed below.
27.7.1 Temperature
Output power of a PV system decreases as the module temperature increases. For crystalline modules, a representative temperature reduction factor suggested by the California Energy Commission (CEC) is 89% in the middle of spring or in a fall day, under full-light conditions.
27.7.2 Dirt and Dust
Dirt and dust can accumulate on the solar module surface, blocking some of the sunlight and reducing the output. A typical annual dust reduction factor to use is 93%. Sand and dust can cause erosion of the PV surface, which affects the system's running performance by decreasing the output power to more than 10% [46–49].
27.7.3 DC–AC Conversion
Because the power from the PV array is converted back to ac as shown earlier, some power is being lost in the conversion process, in addition to losses in the wiring. Common inverters used have peak efficiencies of about 88–90%.
27.8 PV System Design
The goal for a solar direct electricity generation system or photovoltaic system is to provide high-quality, reliable, and green electrical power.
27.8.1 Criteria for a Quality PV System
The criteria for quality PV system are as follows:
27.8.2 Design Procedures
The first task in designing a PV system is to estimate the system's load. This is achieved by defining the power demand of all loads, the number of hours used per day, and the operating voltage [50]. From the load ampere-hours and the given operating voltage for each load, the power demand is calculated. For a stand-alone system, the system voltage is the potential required by the largest load. When ac loads dominate, the dc system voltage should be chosen to be compatible with the inverter input.
27.8.3 Power-Conditioning Unit
The choice of the PCU has a great impact on the performance and economics of the system. It depends on the type of waveform produced, which in turn depends on the method used for conversion, as well as the filtering techniques of unwanted frequencies. Several factors must be considered when selecting or designing the inverter:
27.8.4 Battery Sizing
The amount of battery storage needed depends on the load energy demand and on weather patterns at the site. There is always a trade-off between keeping cost low and meeting energy demand.
27.9 Summary
This chapter discussed the conversion of solar energy into electricity using photovoltaic system. There are two types of PV systems: the grid-connected PV system and the stand-alone PV system. All major components for such systems have been discussed. Maximum power point tracking is the most important factor in PV systems to provide the maximum power. For this reason, several tracking systems have been described and compared. Factors affecting the output of such systems have been defined and steps for a good and reliable design have been considered.
REFERENCES
2. Photovoltaics. Solar Electricity and Solar Cells in Theory and Practice. www.solarserver.de/wissen/photovoltaic-e.html.
3. Toothman J, Alsous S. How Solar Cells Work. http://science.howstuffworks.com/environmental/energy/solar-cell.htm . [accessed October 2010].
4. Moller H. Semiconductors for Solar Cells. London: Artech House, Inc; 1993.
5. Berkeley Lab. http://www.lbl.gov/msd/pis/walukiewicz/0202_08_full_solar_spectrum.html .
6. Dezso Sera, Remus Teodorescu, Pedro Rodriguez. PV panel model based on datasheet values. IEEE International Symposium volume. 2007; 2392–2396.
7. Chu C, Chen C. Robust maximum power point tracking method for photovoltaic cells: a sliding mode control approach. Solar Energy. 2009; 83.8:1370–1378.
8. EE362L, Power Electronics, Solar Power, I–V Characteristics, Version October 14, 2005. http://www.ece.utexas.edu/~grady/EE362L_Solar.pdf.
9. Lee D, Noh H, Hyun D, Choy I. An Improved MPPT Converter Using Current Compensation Method for Small Scaled PV-Applications. Applied Power Electronics Conference and Exposition (APEC’03). February 2003; vol. 1:540–545.
10. Photovoltaic Fundamentals http://www.fsec.ucf.edu/PVT/pvbasics/index.htm.
11. The Solar Sprint PV Panel http://chuck-wright.com/SolarSprintPV/SolarSprintPV.html.
12. M. A. Serhan, “Maximum Power Point Tracking system: an Adaptive Algorithm for Solar Panels,” Thesis, American University of Beirut, January 2005.
13. Enslin JHR, Wolf MS, Snyman DB, Swiegers W. Integrated Photovoltaic Maximum Power Point Tracking Converter. IEEE Transactions on Industrial Electronics. December 1997; vol. 44.
14. Hansen Anca D et al. Models for a Stand Alone PV System. Technical Report Riso National Laboratory. December 2000; http://www.risoe.dk/solenergu/rapporter/pdf/sec-r-12.pdf .
15. Karimov KS, Chattha JA, Ahmed MM et al. Journal of References. Academy of Sciences of Tajikistan. 2002; vol. XLV(no. 9):75–83.
16. Khalil AA, El-Singaby M. Position control of sun tracking system; Circuits and Systems. Proceedings of the 46th IEEE International Midwest Symposium. December 27–30, 2003; vol. 3:1134–1137.
17. Dankoff W. Glossary of Solar Water Pumping Terms and Related Components. [available at] www.conergy.us/Desktopdefault.aspx/tabid-332/449_read-3816/ .
18. Bentley RA. Global Oil Depletion–Methodologies and Results. Proc. 3rd Int. Workshop on Oil and Gas Depletion. 2004; 25–26 [published by the Australian Association for the Study of Peak Oil and Gas (ASPO].
19. Kroutoulis E, Kalaitzakis K, Voulgaris NC. Development of a Microcontroller-Based, Photovoltaic Maximum Power Tracking Control System. IEEE Transactions on Power Electronics. January 2001; vol. 16.
20. Hua C, Shen C. Comparative study of Peak Power tracking Techniques for Solar Storage System. IEEE Applied Power Electronics Conference and Exposition. February 1998; vol. 2:679–685.
21. Hua C, Lin J. DSP-Based Controller in Battery Storage of Photovoltaic System. Control and Instrumentation. 1996; vol. 3:1705–1710.
22. Shengyi Liu. Maximum Power Point Tracker Model. [Control model, University of South Carolina, May 2000, Available from:] http://vtb.engr.sc.edu/modellibrary_old .
23. Hussein KH, Mutta I, Hoshino T, Osakada M. Maximum photovoltaic power tracking: an algorithm for rapidly changing atmospheric conditions. IEE Proceedings, Generation, Transmission and Distribution. January 1995; vol. 142.
24. Tse KK, Chung Henry SH, Hui SYR, Ho MT. Novel Maximum Power Point Tracking Technique for PV Panels. IEEE Power Electronics Specialists Conference. June 2001; vol. 4:1970–1975.
25. Noguchi T, Togashi S, Nakamoto R. Short-Current Pulse-Based Maximum Power Point Tracking Method for Multiple Photovoltaic-and-Converter Module System. IRRR Transactions on Industrial Electronics. February 2002; vol. 49.
26. HowStuffworks http://science.howstuffworks.com/solar-cell5.html.
27. Masoum M, Dehbonei H, Fuschs E. Theoretical and Experimental Analyses of Photovoltaic Systems with Voltage-and Current-Based Maximum Power Point Tracking. IEEE Transactions Conversion. December 2002; vol. 17.
28. Hohm D, Ropp M. Comparative Study of Maximum Power Point Tracking Algorithms Using an Experimental, Programmable, Maximum Point Test Bed. IEEE Photovoltaic Specialists Conference. September 2000; 1699–1702.
29. Chicco G, Napoli R, Spertino F. Experimental Evaluation of the performance of Grid-Connected Photovoltaic Systems. IEEE Melecon. 2004; 1011–1016.
30. Mohan N, Undeland T, Robbins W. Power Electronics: Converter, Applications and Design. 3rd ed. John Wiley and Sons 2003.
31. Rashid MH. Power Electronics: Circuits, Devices, and Applications. Prentice Hall 2004.
32. Carbone R. Grid-Connected Photovoltaic Systems with Energy Storage. International Conference on Clean Electrical Power. 2009; 760–767.
33. Duryea S, Islam S, Lawrance W. A battery management system for stand-alone photovoltaic energy systems. IEEE Industry Applications Magazine. 1999; vol. 7(no. 3):67–72.
34. Lorenzo E, Narvarte L, Preiser K, Zilles R. A field experience with automotive batteries in shs’s. Proceeding of the 2nd World Conference and Exhibition on Photovoltaic Solar Energy Conversion. 1998; 3266–3268.
35. Diaz P, Egido MA. Experimental analysis of battery charge regulation in photovoltaic systems. Progress in Photovoltaics: Research and Applications. November 2003; vol. 11(no. 7):481–493.
36. Yang H, Wang H, Chen G, Wu G. Influence of the charge regulator strategy on state of charge and lifetime of VRLA battery in household photovoltaic systems. Solar Energy. March 2006; vol. 80:281–287.
37. Garche J, Jossen A, Doring H. The influence of different operating conditions, especially over-discharge, on the lifetime and performance of lead acid batteries for photovoltaic systems. Journal of Power Sources. August 1997; vol. 67:201–212.
38. Enslin J, Snyman D. Combined Low Cost, High Efficient Inverter, Peak Power Tracker and Regulator for PV Applications. IEEE Transactions on Power Electronics. January 1991; vol. 6.
39. Linden D. Handbook of Batteries. New York: McGraw Hill; 1995.
40. Jian W, Jianzheng L, Zhengming Z. Optimal Control of Solar Energy Combined with MPPT and Battery Charging. Proceedings of IEEE International Conference on Electrical Machines and Systems. November 2003; vol. 1:285–288.
41. IEEE Recommended Practice for Sizing Lead-Acid Batteries for Stand-Alone Photovoltaic (PV) systems, E-ISBN: 0-7381-2990-9, ISBN 1-55937-068-8 http://ieeexplore.ieee.org/stamp/stamp.jsp?tp=&arnumber=210970.
42. IEEE Guide for Selection, Charging, Test, and Evaluation of Lead-Acid Batteries Used in Stand-Alone Photovoltaic (PV) Systems, E-ISBN: 0-7381-3581-X, PDF: ISBN 0-7381-3581-X SS95086, http://ieeexplore.ieee.org/stamp/stamp.jsp?tp=&arnumber=1263341.
43. IEEE Recommended Practice for Installation and Maintenance of Lead-Acid Batteries for Photovoltaic (PV) Systems, E-ISBN: 978-0-7381-5592-0, ISBN: 978-0-7381-5591-3, http://ieeexplore.ieee.org/stamp/stamp.jsp?tp=&arnumber=4238866.
44. Solar Energy International. Photovoltaics Design and Installations. New Society Publishers 2008.
45. EEE Recommended Practice for Installation and Maintenance of Nickel-Cadmium Batteries for Photovoltaic (PV) System, E-ISBN: 0-7381-1088-4, ISBN 1-55937-072-6, http://ieeexplore.ieee.org/stamp/stamp.jsp?tp=&arnumber=89824.
46. Thornton John P. The Effect of Sand-Storm on Photovoltaic Array and Components. Solar energy Conference. 1992.
47. Chaar L, Jamaleddine A, Ajmal F, Khan H. Effect of Wind Blown Sand and Dust on PV Arrays Especially in UAE. Power Systems Conference (PSC). March 2008.
48. Mohandes B, El-Chaar L, Lamont L. Application Study of 500W Photovoltaic (PV) System in the UAE. Applied Solar Energy Journal. December, 2009; vol. 45(no. 4):242–247.
49. Al Hanai T, Bani Hashim R, El-Chaar L, Lamont L. Study of a 900 W, Thin-film, Amorphous Silicon PV System in a Dusty Environment. International Conference on Renewable Energy: Generation and Applications - ICREGA’10. March 2010.
50. Sandia National Laboratories. Stand Alone Photovoltaic Systems. A Handbook of Recommended Design Practices. National Technical Information Service, VA: Springfield; 1988.