Tracing is a powerful debugging technique that records detailed execution information for you to examine. OllyDbg supports a variety of tracing features, including the standard back trace, call stack trace, and run trace.
Any time you are moving through the disassembler window with the Step Into and Step Over options, OllyDbg is recording that movement. You can use the minus (–) key on your keyboard to move back in time and see the instructions you previously executed. The plus (+) key will take you forward. If you used Step Into, you can trace each step taken. If you used Step Over, you can step in only the areas that you stepped on before; you can’t go back and then decide to step into another area.
You can use OllyDbg to view the execution path to a given function via a call stack trace. To view a call stack, select View ▶ Call Stack from the main menu. You will see a window displaying the sequence of calls taken to reach your current location.
To walk the call stack, click the Address or Called From sections of the Call Stack window. The registers and stack will not show what was going on when you were at that location, unless you are performing a run trace.
A run trace allows you to execute code and have OllyDbg save every executed instruction and all changes made to the registers and flags.
There are several ways to activate run tracing:
Highlight the code you wish to trace in the disassembler window, right-click it, and select Run Trace ▶ Add Selection. After execution of that code, select View ▶ Run Trace to see the instructions that were executed. Use the – and + keys on your keyboard to navigate the code (as discussed in Standard Back Trace). With this method, you’ll see the changes that occurred to every register for each instruction as you navigate.
Use the Trace Into and Trace Over options. These options may be easier to use than Add Selection, because you don’t need to select the code you wish to trace. Trace Into will step into and record all instructions that execute until a breakpoint is hit. Trace Over will record only the instructions that occur in the current function you are executing.
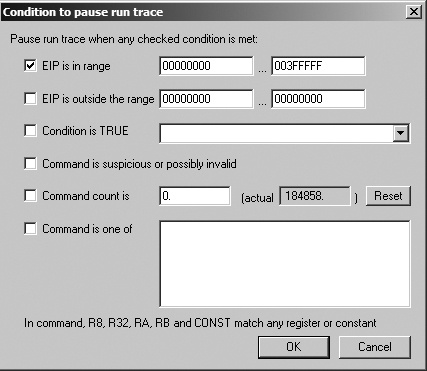
Select Debug ▶ Set Condition. You can trace until a condition hits, causing the program to pause. This is useful when you want to stop tracing when a condition occurs, and back trace from that location to see how or why it occurred. You’ll see an example of this usage in the next section.
Recall from our earlier discussion that the Poison Ivy backdoor often allocates memory for shellcode that it receives from its command-and-control server. Poison Ivy downloads the shellcode, copies it to the dynamically allocated location, and executes it. In some cases, you can use tracing to catch that shellcode execution when EIP is in the heap. The trace can show you how the shellcode started.
Figure 9-11 shows the condition we set to catch Poison Ivy’s heap execution. We set OllyDbg to pause when EIP is less than the typical image location (0x400000, below which the stack, heap, and other dynamically allocated memory are typically located in simple programs). EIP should not be in these locations in a normal program. Next, we select Trace Into, and the entire program should be traced until the shellcode is about to be executed.
In this case, the program pauses when EIP is 0x142A88, the start of the shellcode. We can use the - key to navigate backward and see how the shellcode was executed.