OllyDbg provides many mechanisms to help with analysis, including the following:
Logging. OllyDbg keeps a log of events constantly available. To access them, select View ▶ Log. This log shows which executable modules were loaded, which breakpoints were hit, and other information. The log can be useful during your analysis to figure out which steps you took to get to a certain state.
Watches window. OllyDbg supports the use of a Watches window, which allows you to watch the value of an expression that you generate. This expression is constantly updated in this window, which can be accessed by selecting View ▶ Watches. You can set an expression in the Watches window by pressing the spacebar.
Help. The OllyDbg Help ▶ Contents option provides a detailed set of instructions for writing expressions under Evaluation of Expressions. This is useful if you need to monitor a specific piece of data or complicated function. For example, if you wanted to monitor the memory location of EAX+ESP+4, you would enter the expression
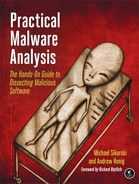
[EAX+ESP+4].Labeling. As with IDA Pro, you can label subroutines and loops in OllyDbg. A label in OllyDbg is simply a symbolic name that is assigned to an address of the debugged program. To set a label in the disassembler window, right-click an address and select Label. This will pop up a window, prompting you for a label name. All references to this location will now use this label instead of the address. Figure 9-15 shows an example of adding the label
password_loop. Notice how the name reference at 0x401141 changes to reflect the new name.
