
Debugging in the kernel is more complicated than debugging a user-space program because when the kernel is being debugged, the OS is frozen, and it’s impossible to run a debugger. Therefore, the most common way to debug the kernel is with VMware.
Unlike user-mode debugging, kernel debugging requires a certain amount of initial setup. You will need to set up the virtual machine to enable kernel debugging, configure VMware to enable a virtual serial port between the virtual machine and the host, and configure WinDbg on the host machine.
You will need to set up the virtual machine by editing the normally hidden C:boot.ini file. (Be sure that your folder options are set to show hidden files.) Before you start editing the boot.ini file, take a snapshot of your virtual machine. If you make a mistake and corrupt the file, you can revert to the snapshot.
Example 10-1 shows a Windows boot.ini with a line added to enable kernel debugging.
Example 10-1. Sample boot.ini file modified to enable kernel debugging
  [boot loader]
  timeout=30
  default=multi(0)disk(0)rdisk(0)partition(1)WINDOWS
  [operating systems]
❶ multi(0)disk(0)rdisk(0)partition(1)WINDOWS="Microsoft Windows XP Professional"
  /noexecute=optin /fastdetect
❷ multi(0)disk(0)rdisk(0)partition(1)WINDOWS="Microsoft Windows XP Professional with Kernel
  Debugging" /noexecute=optin /fastdetect /debug /debugport=COM1 /baudrate=115200
The line at ❶ specifies the OS to load—Windows XP in this case. The line at ❷ is added to enable kernel debugging. Your version of boot.ini will likely contain only a line similar to ❶.
Copy the last line of your boot.ini file and add another entry. The line
should be the same except that you should add the options /debug
/debugport=COM1 /baudrate=115200. (Don’t worry about the other elements on the line
such as multi(0)disk(0); simply copy the line exactly and add the
extra options.) The /debug flag enables kernel debugging, the
/debugport=COM1 tells the OS which port will connect the debugged
machine to the debugging machine, and the baudrate=115200
specifies the speed of the connection. In our case, we’ll be using a virtual COM port created
by VMware. You should also change the name of Windows in the second entry so that you can recognize
the option later. In our case, we have named the second entry Microsoft
Windows XP Professional with Kernel Debugging.
The next time you boot your virtual machine, you should be given the option to boot the debugger-enabled version of the OS. The boot loader will give you 30 seconds to decide whether you want to boot up with debugging enabled. Each time you boot, you must choose the debugger-enabled version if you want to be able to connect a kernel debugger.
Note
Simply because you start the OS with the debugger enabled does not mean that you are required to attach a debugger. The OS should run fine without a debugger attached.
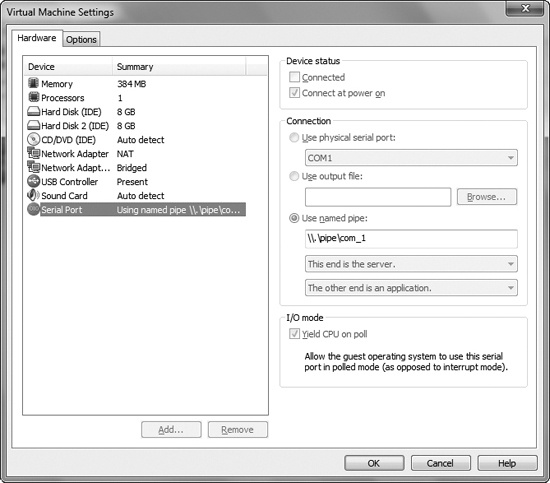
Next, we configure VMware to create a virtual connection between the virtual machine and the host OS. To do so, we’ll use a serial port on a named pipe on the host by adding a new device. Follow these steps to add a new device:
Click VM ▶ Settings to open the VMWare Settings dialog.
In the Settings dialog, click the Add button on the lower right, and then select Serial Port in the window containing the types of devices.
In the dialog requesting the type of serial port, select Output to Named Pipe.
At the next window, enter
\.pipecom_1for the name of the socket and select This end is the server and The other end is an application. Once you’ve finished adding the serial port, the virtual machine settings should show a serial port device configured as shown in Figure 10-2.Check the box labeled Yield CPU on poll.
Note
The exact sequence of windows and dialog boxes differs between versions of VMware. The instructions here are specific to VMware Workstation 7. The settings should be the same for other versions, but the windows and dialogs to configure the settings will differ slightly.
After you’ve configured the virtual machine, start it. Use the following steps on the host machine to use WinDbg to connect to the virtual machine and start debugging the kernel.
Launch WinDbg.
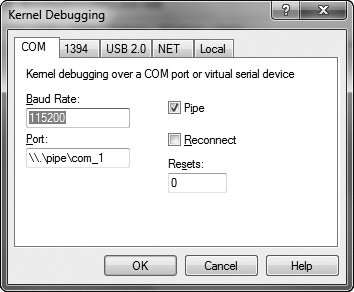
Select File ▶ Kernel Debug, click the COM tab, and enter the filename and baud rate that you set before in the boot.ini file—
115200in our case. Make sure the Pipe checkbox is checked before selecting OK. Your window should look like Figure 10-3.
If the virtual machine is running, the debugger should connect within a few seconds. If it is not running, the debugger will wait until the OS boots, and then connect during the boot process. Once the debugger connects, consider enabling verbose output while kernel debugging, so that you’ll get a more complete picture of what is happening. With verbose output, you will be notified each time a driver is loaded or unloaded. This can help you identify a malicious driver in some cases.