
7
Design for Reliability
7.1 Introduction
The reliability of a product is strongly influenced by decisions made during the design process. Deficiencies in design affect all items produced and are progressively more expensive to correct as development proceeds. The cost of errors and design changes increases drastically over the course of the product development cycle, Figure 7.1. It can be as high as a 10-fold increase in cost from one phase to another. It is therefore essential that design disciplines are used which minimize the possibility of failure and which allow design deficiencies to be detected and corrected as early as possible. In Chapter 5 the basic requirements for failure-free design were laid down, that is adequate safety margins, protection against extreme load events and protection against strength degradation. The design must also take account of all other factors that can affect reliability, such as production methods, use and maintenance, and failures not caused by load.
The design process must therefore be organized to ensure that failure-free design principles are used and that any deviations from the principles are detected and corrected. The designers must aim to create designs which will not fail if manufactured and used as specified.
The old design concept of ‘test-analyze-and-fix’ (TAAF), in which reliance is placed on the test programme to show up reliability problems, no longer has a place in modern design and manufacturing due to shorter design cycles, relentless cost reduction, warranty cost concerns, and many other considerations. Therefore the reliability should be ‘designed-in’ to the product using the best available science-based methods. This process, called Design for Reliability (DfR) begins from the first stages of product development and should be well integrated through all its phases.
The DfR process also changes the engineers’ roles in the design process. The role of the reliability engineer is changing into the mentor (Silverman, 2010), who is now responsible for finding the best design methods and techniques for reliability and then for training the designers on how to use them. As a result of this process the designers take ownership of the reliability of the product, while the reliability organization serves as a steering committee. Needless to say in order to achieve this, the reliability engineer should be integrated with the design team from the very first step of the DfR process. Therefore, the DfR process ensures that pursuit of reliability is an enterprise-wide activity.
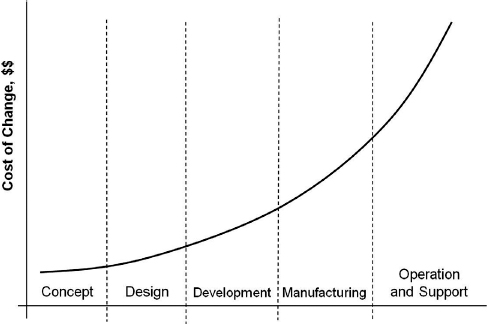
Figure 7.1 Cost of design change.
There have been tendencies to parallel DfR with Design for Six Sigma (DFSS) (for more on DFSS see Creveling et al. 2003). The two processes have similarities and share some of the methods and techniques. However, there are clear distinctions between the two. DFSS aims at reducing variations throughout the design process largely in order to avoid manufacturing problems, while DfR focuses on designing reliability into the product. For more on the distinctions between DFSS and DfR see ReliaSoft (2008) and Mettas (2010).
7.2 Design for Reliability Process
The DfR process encompasses various tools and practices and describes the order of their deployment that an organization needs to drive reliability into the products. Even though most DfR tools have been in use for many years, DfR as a technical discipline and an engineering process is still in the stage of development. There has been some work done on defining this process (see Crowe and Feinberg (2001), ReliaSoft (2007), Mettas (2010), Silverman (2010) and other references at the end of this chapter); however researchers and practitioners are still in the process of reaching a consensus on the specific steps and activities which comprise the DfR process. A structured approach to DfR was suggested later in ReliaSoft (2008) and Mettas (2010), where the process was outlined as an iterative progression of the key design activities along with the appropriate reliability analysis tools.
Depending on the industry, type of product, development cycle and other product specific factors, the DfR process can certainly vary, however in a generic form, it can be depicted as a flow diagram (Figure 7.2).
This flow shows the sequence of engineering activities necessary to achieve a failure-free design. This flow also aligns well with the general product development process of Concept-Design-Development-Manufacturing-Operation/Support. Each stage of the DfR process in Figure 7.2 employs the analysis methods and tools best suited for the required tasks.
Implementing DfR practices and tools is sometimes considered tedious and expensive. In most cases the analysis will show that nearly all aspects of the design are satisfactory, and much more effort will have been expended in showing this than in highlighting a few deficiencies. However, the discovery of even a few deficiencies at an appropriately early stage can save far more than the costs that might be incurred by having to modify the design at a later stage, or by having to live with the consequences of the defect. Therefore, the DfR process if implemented correctly is extremely cost-effective. The tedium and expense can be greatly reduced by good planning and preparation and by the use of appropriate software. In this chapter, we will outline DfR as a step-by-step process and describe the DfR methods and techniques. Some have been discussed in the previous chapters and some will be explained later in the book.

Figure 7.2 Design for reliability (DfR) activities flow.
7.3 Identify
The important groundwork for the project design is done at this stage, which begins with understanding of the system requirements. For example, if the specification is 10 years of operation and/or 200 000 km how does that translate into the reliability terms? System reliability requirements can be set by the customer, by the design team, or by following the accepted industry practices. During system design, the top-level reliability requirements are then allocated to subsystems by design engineers and reliability engineers working together (see Chapter 6 for more on reliability apportionment and Chapter 14 on reliability metrics).
This is the time to start collecting data and/or gaining better understanding about the product's usage environments. For example, what kind of temperature profile will be experienced by an electronic controller mounted under the hood of a vehicle? The analysis techniques and design activities appropriate at this stage also include Quality Function Deployment (QFD), benchmarking against the competition, product usage analysis, reliability cost estimate, environments assessment, risk assessment and reliability apportionment. It is also important that reliability engineers become integrated with design teams at the very early stages of this process, so potential reliability issues are addressed from the beginning. If the design involves new technology, this is the appropriate time to begin its reliability and risk assessment activities in addition to determining the technology limitations. For example, the design team can specify that batteries for hybrid vehicles cannot operate below certain temperatures, CD player optics devices cannot withstand high vibration levels, and so on. Activities at this stage may also help to determine the future cost of testing and validating the product.
7.3.1 Benchmarking
Benchmarking is an important activity in process improvement, which goes beyond product reliability. According to the Automotive Industry Action Group, AIAG, 2004 ‘Benchmarking is the process of improving product and process performance by continuously identifying, understanding and adapting outstanding practices, processes, features and performance levels of world-class products and processes.’ Therefore reliability requirements should be benchmarked against the competition in order to achieve or exceed ‘best in class’ characteristics. Benchmarking should begin with identifying the parameters and measures to benchmark and the companies and organizations which are considered to be ‘best in class’. These identified best practices then should be studied through internet or library research, questionnaires, interviews, measurements and other legal means. The concluding step in the benchmarking process should include publishing recommendations and ultimately adapting the best tools and practices to achieve the established goals.
7.3.2 Environments
Determining the usage and environmental conditions is a very important step in the design process. Designers need to know the types of stresses their products will experience in the field. The environments in which the product will be expected to be stored, operated and maintained must be carefully assessed, as well as the expected severity and durations. The assessment must include all aspects that could affect the product's operation, safety and reliability. Physical factors include temperature, vibration, shock, humidity, pressure, and so on. Extreme values and, where relevant, rates of change must be considered. Other environmental conditions, such as corrosive atmospheres, electrical interference, power supply variation, and so on, must also be taken into account. Where appropriate, combined environmental conditions, such as temperature/corrosive atmosphere and vibration/contamination, should be assessed. An aspect of the environment often neglected is the treatment of the product by people, in storage, handling, operation and maintenance.
Environmental aspects should be reviewed systematically, and the review should be properly documented. The protective measures to be taken must be identified, as appropriate to storage, transport, handling, operation and maintenance. Protective measures include packaging, provision of warning labels and instructions, protective treatment of surfaces, and design features. Detailed design aspects are covered in Chapters 8 and 9.
7.3.3 Environment Distribution
In many cases the designed product will be used differently by different users and often in different regions of the world. For example, some people listen continuously to their CD players or iPods, while others may turn them on only once a week. The concept of loads and stresses distributed statistically was introduced in Chapter 5. Statistical representation of usage or environmental data is often referred as distribution environment, usage distribution, or user severity.
Example 7.1
An automotive supplier needs to determine the driving distances for passenger cars in Europe. The analysis of vehicle repair data from several European car dealerships produced the data sample containing number of kilometres driven by each vehicle from the sales date to repair. This data was converted into a data sample of the yearly driving distances for each vehicle. Best fit analysis for this data sample showed that the yearly distances driven by passenger cars can be modelled by a lognormal distribution with μ = 3.867 and σ = 0.603, Figure 7.3. From this distribution the manufacturer learned that the average driving distance is 20 600 km per year, the median (50 percentile) vehicle would be driven 17 200 km and the 95 percentile 46 000 km. Based on this analysis the manufacturer developed the engine reliability specifications for the Tier 2 supplier based on 46 000 km/year.
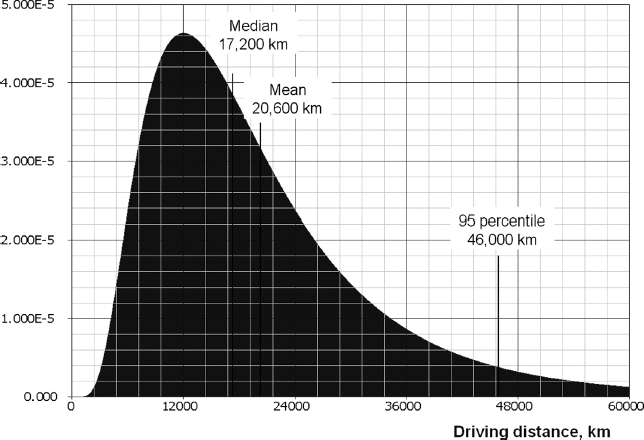
Figure 7.3 Statistical distribution of the annual driving distances (per passenger car in Europe).
Depending on the industry or type of the product, the design may be intended for the 50, 90, 95 or even the 99.9 percentile user. Similar types of user profiles in statistical or non-statistical formats can be obtained for various applications, such as mobile phone usage, on/off machine cycles, times at extreme temperatures, laptop power-on times, expected vibration levels, and so on. This type of information can be critical in developing the realistic requirements to manufacture products which can provide reliable operation in the field.
7.3.4 Quality Function Deployment (QFD)
Quality Function Deployment (QFD) is a technique to identify all of the factors which might affect the ability of a design or product to satisfy the customer, and the methods and responsibilities necessary to ensure control. QFD goes beyond reliability, as it covers aspects such as customer preferences for feel, appearance, and so on, but it is a useful and systematic way to highlight design and process activities and controls necessary to ensure reliability.
QFD begins by a team consisting of the key marketing, design, production, reliability and quality staff working their way through the project plan or specification, and identifying the features that will require to be controlled, the control methods applicable, and the responsible people. Constraints and risks are also identified, as well as resources necessary. At this stage no analysis or detailed planning is performed, but the methods likely to be applied are identified. These methods are described later in this chapter and in others.
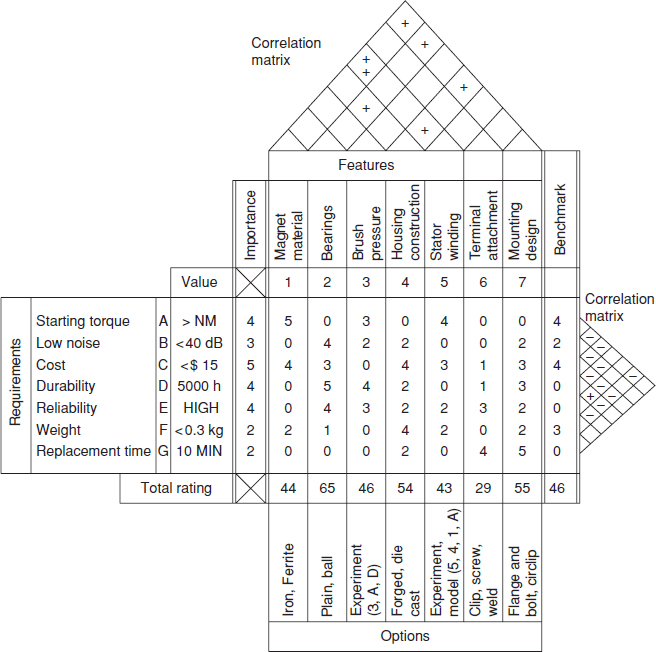
Figure 7.4 Quality function deployment for electric motor design.
QFD makes use of charts which enable the requirements to be listed, and controls responsibilities, constraints, and so on, to be tabulated, as they relate to design, analysis, test, production, and so on. An example is shown in Figure 7.4.
This shows requirements rated on an importance scale (1–5), and the design features that can affect them. Each feature is in turn rated against its contribution to each requirement, and a total rating of each feature is derived by multiplying each rating by the importance value, and adding these values. Thus the bearing selection, housing construction, and mounting design come out as the most critical design features.
The ‘benchmark’ column is used to rate each requirement, as perceived by potential customers, against those of competitive products. Only one benchmark is shown here; more can be added for other competitors. Benchmarking is a useful method for putting requirements into a sound marketing perspective.
The correlation matrices indicate the extent to which requirements and features interact: plus sign(s) indicate positive correlation, and minus negative correlation. For example, magnet material and stator winding design might interact strongly. The minus signs in the requirements matrix indicate conflicting requirements.
The options available are shown. In some cases further modelling or experiments are required, and this part of the chart can be used to indicate the variables that need to be included in such work.
The shape of the QFD chart has led to its being called the ‘house of quality’. Of course quality here is used in the widest sense, to include all aspects of the product that will affect its reputation and cost. Figure 7.4 is a top level chart: lower level charts are used to analyse more detailed aspects, for example, more detailed design and component characteristics, and production processes and tolerances, always against the same set of requirements. Thus every aspect of design and production, including analysis, test, production process control, final inspection, packaging, maintenance, and so on, is systematically evaluated and planned for, always in relation to the most important product requirements. Requirements and features that are not important are shown up as such, and this can be a very important contribution to cost reduction and reliability improvement.
Like other conceptual analysis methods, there is no single standard approach, and users should be encouraged to develop formats and methods appropriate to their products and problems. QFD software is available.
The method is described in more detail in Akao (1990) and many other printed and web sources.
7.3.5 Programme Risk Assessment
Product development has an evolutionary nature; therefore in most cases a new product is a further step in development of the existing programme. Thus at the IDENTIFY stage it is important to understand how much change is introduced to the new product compared to the old one. Therefore the following questions should be answered:
- Will this product contain any new technology with unproven reliability record?
- Is this a revolutionary design as opposed to evolutionary?
- Will this design be significantly different from the old one (e.g. more that 30% of the content is new)?
- Will this product be used at a different geographic region or be exposed to more extreme environments?
- Does this product have any new requirements (e.g. 15 years life instead of 10 years)?
- Will this product have new applications (e.g. consumer electronics product will be installed on a passenger car)?
- Any new materials used in the design?
- Any changes in the supply chain?
- Will the product be made at a different manufacturing location?
- Will this product be supplied to a new customer?
- Are there any other changes, which can affect reliability?
The more ‘yes’ answers the higher is the reliability risk for this program. The higher is the risk the more attention should be paid to reliability and therefore more DfR activities should be included in the programme.
7.4 Design
This is the stage where specific design activities begin, such as circuit layout, mechanical drawing, component/supplier selection, and so on. Therefore, a more detailed design picture begins to emerge.
At the DESIGN stage the suppliers are identified and preliminary bill of materials becomes available, therefore initial reliability prediction activities can begin (Chapter 6). Other activities at this stage may include Design Failure Modes Effects and Criticality Analysis (FMECA), analysis of the existing product issues (lessons learned), fault tree analysis (Chapter 6), critical items list, human factors, hazard and operability study (HAZOPS), and design reviews. Also load protection and non-material failure modes should be considered as part of FMECA process or as separate activities.
7.4.1 Computer-Aided Engineering
Computer-aided engineering (CAE) methods are used to perform a wide variety of design tasks. CAE also makes possible the creation of designs which would otherwise be very difficult or uneconomic, for example complex electronic circuits. (CAE for electronic design is often referred to as electronic design automation (EDA)). CAE provides enormous improvements in engineering productivity. Properly used, it can lead to the creation of more reliable designs.
The designer can, in principle, design the system, then ‘build’ it and ‘test’ it, all on the computer screen. The effects of parameter changes or failure modes can be quickly evaluated, and dynamic as well as static operating conditions can be tested.
Specialist CAE software is also available for design and analysis of systems and products incorporating other technologies, such as hydraulics, magnetics and microwave electronics. Multi-technology capability is now also available, so that mixed technology designs can be modelled and analysed.
CAE provides the capability for rapid assessment of different design options, and for analysing the effects of tolerances, variation and failure modes. Therefore, if used in a systematic, disciplined way, with adequate documentation of the options studied and assessments performed, designs can be optimized for costs, producibility and reliability.
However, there are important limitations inherent in most CAE tools. The software models can never be totally accurate representations of all aspects of the design and of its operating environment. For example, electronic circuit simulation programs generally ignore the effects of electromagnetic interference between components, and drafting systems will ignore distortion due to stress or temperature. Therefore it is essential that engineers using CAE are aware of the limitations, and how these could affect their designs.
7.4.2 Failure Modes, Effects and Criticality Analysis (FMECA)
Failure modes effects and criticality analysis (FMECA) (or failure modes and effects analysis (FMEA)), is probably the most widely used and most effective design reliability analysis method. The principle of FMECA is to consider each mode of failure of every component of a system and to ascertain the effects on system operation of each failure mode in turn. Failure effects may be considered at more than one level, for example, at subsystem and at overall system level. Failure modes are classified in relation to the severity of their effects.
An FMECA may be based on a hardware or a functional approach. In the hardware approach actual hardware failure modes are considered (e.g. resistor open circuit, bearing seizure). The functional approach is used when hardware items cannot be uniquely identified or in early design stages when hardware is not fully defined. In this approach function failures are considered (e.g. no feedback, memory lost). Note that a functional failure mode can become a hardware failure effect in a hardware-approach FMECA. An FMECA can also be performed using a combination of hardware and functional approaches.
Figure 7.5 shows a typical worksheet in AIAG-3 format (AIAG, 2003), which serves to highlight failure modes whose effects would be considered important in relation to severity, detectability, probability of occurrence, maintainability or safety. Figure 7.5 includes the Risk Priority Number (RPN) to assess risk. The RPN procedure includes the following steps: rating of the severity of each effect of failure, rating the likelihood of occurrence for each cause of failure and rating the likelihood of prior detection for each cause of failure (i.e. the likelihood of detecting the problem before it reaches the end user or customer). Rating scales usually range from 1 to 10, with the higher number representing the higher severity or risk. For example, 10 points for severity indicates the worst possible consequence of the failure.
RPN is calculated as the product of the three ratings:
RPN = Severity × Occurrence × Detection
The RPN can then be used to compare issues within the analysis and to prioritize problems for corrective action.
Figure 7.6 show typical worksheets taken from US MIL-STD-1629 Method 102 (criticality analysis). This method includes consideration of failure rate or probability, failure mode ratio and a quantitative assessment of criticality, in order to provide a quantitative criticality rating for the component or function. The failure mode criticality number is
![]()
where: β = conditional probability of loss of function or mission.
α = failure mode ratio (for an item, Σα = 1).
λp = item failure or hazard rate (can be obtained from the standards-based or other reliability prediction method, Chapter 6).
t = operating or at-risk time of item.
λp t can be replaced by failure probability, 1 − exp (−αλpt).
The item criticality number is the sum of the failure mode criticality numbers for the item.
FMECA is widely used in many industries, particularly in those for which failures can have serious consequences, such as military, aerospace, automotive, medical equipment, and so on. There are other published standards besides AIAG-3 and MIL-STD-1629 containing FMECA forms and guidelines. Those standards include ISO/TS16949 (automotive quality management system), SAE J1739 for FMEA (published by Society of Automotive Engineers for the automotive industry), IEC 60812 (Procedure for Failure Mode and Effects Analysis), ARP5580 (Recommended Failure Modes and Effects Analysis Practices for Non-Automobile Applications), P-302-720 (NASA Flight Assurance Procedure) and others.
7.4.3 Steps in Performing an FMECA
An effective FMECA should be performed by a team of engineers having a thorough knowledge of the system's design and application. This team can be augmented by specialists from other functional areas, such as purchasing, tech support, testing, facilities, marketing, and so on. The first step therefore is to obtain all the information available on the design. This includes specifications, drawings, computer-aided engineering (CAE) data, stress analysis, test results, and so on, to the extent they are available at the time. For a criticality analysis, the reliability prediction information must also be available or it might be generated simultaneously.
A system functional block diagram and reliability block diagram (Chapter 6) should be prepared, if not already available, as these form the basis for preparing the FMECA and for understanding the completed analysis.

Figure 7.5 FMEA worksheet for AIAG-3 method.

Figure 7.6 MIL-STD-1629 Method 102 worksheet for criticality analysis.
If the system operates in more than one phase in which different functional relationships or item operating modes exist, these must be considered in the analysis. The effects of redundancy must also be considered by evaluating the effects of failure modes assuming that the redundant subsystem is or is not available.
An FMECA can be performed from different viewpoints, such as safety, mission success, availability, repair cost, failure mode or effect detectability, and so on. It is necessary to decide, and to state, the viewpoint or viewpoints being considered in the analysis. For example, a safety-related FMECA might give a low criticality number to an item whose reliability seriously affects availability, but which is not safety critical.
The FMECA is then prepared, using the appropriate worksheet, and working to the item or subassembly level considered appropriate, bearing in mind the design data available and the objectives of the analysis. For a new design, particularly when the effects of failures are serious (high warranty costs, reliability reputation, safety, etc.) the analysis should take account of all failure modes of all components. However, it might be appropriate to consider functional failure modes of subassemblies when these are based upon existing designs, for example, modular power supplies in electronic systems, particularly if the design details are not known.
The FMECA should be started as soon as initial design information is available. It should be performed iteratively as the design evolves, so that the analysis can be used to influence the design and to provide documentation of the eventually completed design. Design options should be analysed separately, so that reliability implications can be considered in deciding on which option to choose. Test results should be used to update the analysis.
FMECA is not a trivial task, and can involve many hours or weeks of work. It can also be difficult to trace the effects of low-level failures correctly through complex systems. The CAE/ EDA software can be used to assist in the analysis, thus aiding the task of working out the effects of component-level failures on the operation of complex systems. Even with aids such as these, FMECA can be an inappropriate method for some designs, such as digital electronic systems in which low-level failures (e.g. of transistors within integrated circuits) are very unlikely, and the effects are dynamic in the sense that they could differ widely depending upon the state of the system.
7.4.4 Uses for FMECA
FMECAs can be used very effectively for several purposes, in addition to the prime one of identifying safety or reliability critical failure modes and effects. These include:
- Identifying features to be included in the test programme (Chapters 12 and 13).
- Preparation of diagnostic routines such as flowcharts or fault-finding tables. The FMECA provides a convenient listing of the failure modes which produce particular failure effects or symptoms, and their relative likelihoods of occurrence.
- Preparation of preventive maintenance requirements. The effects and likelihood of failures can be considered in relation to the need for scheduled inspection, servicing or replacement. For example, if a failure mode has an insignificant effect on safety or operating success, the item could be replaced only on failure rather than at scheduled intervals, to reduce the probability of failure. See Chapter 16.
- Design of built-in test (BIT), failure indications and redundancy. The failure detectability viewpoint is an important one in FMECA of systems which include these features.
- For analysis of testability, particularly for electronic subassemblies and systems, to ensure that hardware can be economically tested and failures diagnosed, using automatic or manual test equipment.
- For development of software for automatic test and BIT.
- For retention as formal records of the safety and reliability analysis, to be used as evidence if required in reports to customers or in product safety litigation.
- To consider the possibility of production-induced failures, for example, wrong diode orientation. Such a process FMECA can be very useful in test planning and in design for ease of production.
It is important to coordinate these activities, so that the most effective use can be made of the FMECAs in all of them, and to ensure that FMECAs are available at the right time and to the right people.
7.4.5 FMECA Software Tools
Software has been developed for the performance of FMECA. Using software instead of FMECA worksheets allows FMECAs to be produced more quickly and accurately, and greatly increases the ease of editing and updating to take account of design changes, design options, different viewpoints, and different input assumptions. Like any other computer-aided design technique, computerized FMECA frees engineers to concentrate on engineering, rather than on tedious compilation, so that for the same total effort designs can be more thoroughly investigated, or less effort can be expended for the same depth of analysis.
The FMECA software enables more perceptive analysis to be performed. Failure effects can be ranked in criticality order, at different system levels, in different phases of system operation and from different viewpoints. Report preparation can be partly automated and sensitivity analyses quickly performed. Figure 7.7 shows part of a computerized FMECA, performed using the CARE¯ software package by BQR Reliability Engineering. It shows three levels of FMECA tree for the comparator U4. Figure 7.7 shows the potential failure mode for this component (on the right) and the RPN analysis (at the bottom). It is also possible, and effective, to use a spreadsheet to create an FMECA. This method has the advantage that the format and type of analysis can be designed to suit the particular design and methods of analysis.
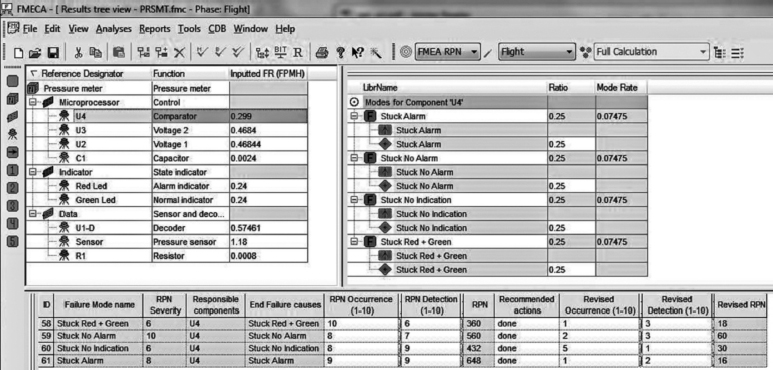
Figure 7.7 Part of output listing from CARE¯, the FMECA software (Reproduced by permission of BQR Reliability Engineering Ltd.).
7.4.6 Reliability Predictions for FMECA
Since FMECAs are performed primarily to identify critical failure modes and to evaluate design options, failure rate or reliability values which could be considered as realistic worst cases should be used as it was originally implemented in MIL-STD-1629. Standard methods sometimes stipulate the reliability prediction methods to be used with FMECA, for example, MIL-HDBK-217 for electronics or NSWC-06/LE10 for mechanical systems. However, it is very important to appreciate the large amount of uncertainty inherent in reliability prediction, particularly at the level of individual failure events (see Chapter 6). Therefore, worst-case or pessimistic reliability values should always be used as input assumptions for failure modes which are identified as critical, or which might be critical if the pessimistic assumption proved to be realistic. Alternatively, and preferably unless credible quantitative data are available, a value scale such as 0–1 should be used, with prearranged assignment (e.g. 1 = will definitely occur, 0.5 = will occur occasionally, 0.1 = will rarely occur, 0 = will never occur). Generally, the more critical the failure mode the more pessimistic should be the worst-case reliability assumptions.
7.4.7 Load-Strength Analysis
Load–Strength analysis (LSA) covered in Chapter 5 is a procedure to ensure that all load and strength aspects have been considered in deriving the design, and if necessary in planning of tests. Load-Strength analysis may begin at the early stages of the DESIGN phase and continue through most of the DfR process as more data about system characteristics become available. The LSA should include the following:
- Determine the most likely worst case values and patterns of variation of load and strength.
- Evaluate the safety margin for intrinsic reliability.
- Determine protection methods (load limit, derating, screening, other quality control methods).
- Identify and analyse strength degradation modes.
- Test to failure to corroborate, analyse results.
- Correct or control (redesign, safe life, quality control, maintenance, etc.).
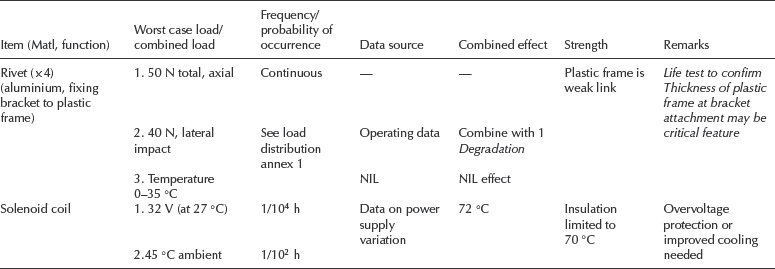
Table 7.1 is an example of a hypothetical load–strength analysis for a mechanical and electrical assembly. The example shows approaches that can be used for different aspects of the analysis. Event probabilities can be expressed as full distributions, or as the likelihood of a particular limiting case being exceeded. The former is more appropriate when the load(s) can cause degradation, or if a more detailed reliability assessment is required. Both examples show typical, though rather simple, cases where the effects of combined loads might have been overlooked but for the analysis. For example, the solenoid might be supplied with a manufacturer's rating of 28 V operating, ±2 V, and a maximum ambient temperature of 45 °C. A room temperature test of the solenoid might have confirmed its ability to function with a 32 V supply without overheating. However, the combined environment of +45 °C and 32 V supply, albeit an infrequent occurrence, could lead to failure.
The mechanical example is less easy to analyse and testing is likely to be the best way of providing assurance, if the assembly is critical enough to warrant it. Where the load–strength analysis indicates possible problems, further analysis should be undertaken, for example, use of probabilistic methods as described in Chapters 4 and 5, and CAE methods. Tests should be planned to confirm all design decisions.
7.4.8 Hazard and Operability Study (HAZOPS)
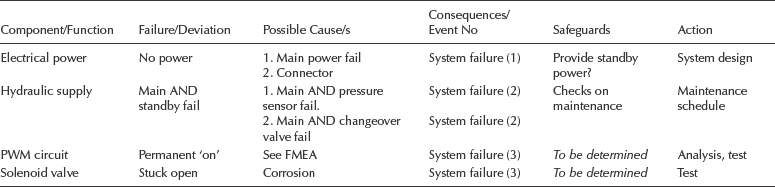
Hazard and operability study (HAZOPS) is a technique for the systematic determination of the potential hazards that could be generated by a system, and of the methods that should be applied to remove or minimize them. It is used in the development of systems such as petrochemical plants, railway systems, and so on and usually is part of the mandatory safety approval process. Table 7.2 shows an example of the format used.
Table 7.1 Load–strength analysis example.
For the failure/deviation column, a set of ‘guidewords’ is sometimes applied to help in the identification of things that could possibly go wrong. The usual guidewords are:
| —no/not | —part of |
| —more | —reverse |
| —less | —other than |
| —as well as |
HAZOPS should cover the whole range of potential failure causes, including natural hazards, human failures, and so on. HAZOP is also commonly used in risk assessments for industrial and environmental health and safety applications. Additional details on the HAZOP methodology can be found in the standard IEC 61 882, Hazard and Operability Studies (HAZOP) Application Guide.
7.4.9 Parts, Materials and Processes (PMP) Review
All new parts, materials and processes called up in the design should be identified. ‘New’ in this context means new to the particular design and production organization. The designer is likely to assume that a part or material will perform as specified in the brochure and that processes can be controlled to comply with the design. The reliability and quality assurance (QA) staff must ensure that this faith is well-founded. New parts, materials and processes must therefore be assessed or tested before being applied, so that adequate training for production people can be planned, quality control safeguards set up and alternative sources located. New parts, materials and processes must be formally approved for production and added to the approved lists.
Materials and processes must be assessed in relation to reliability. The main reliability considerations include:
- Cyclical loading. Whenever loading is cyclical, including frequent impact loads, fatigue must be considered.
- External environment. The environmental conditions of storage and operation must be considered in relation to factors such as corrosion and extreme temperature effects.
- Wear. The wear properties of materials must be considered for all moving parts in contact.
There is such a wide variation of material properties, even amongst categories such as steels, aluminium alloys, plastics and rubbers, that it is not practicable to generalize about how these should be considered in relation to reliability. Material selection will be based upon several factors; the design review procedure should ensure that the reliability implications receive the attention appropriate to the application. Chapter 8 covers mechanical design for reliability in more detail.
7.4.10 Non-Material Failure Modes
Most reliability engineering is concerned with material failure, such as caused by load–strength interference and strength degradation. However, there is a large class of failure modes which are not related to this type of material failure, but which can have consequences which are just as serious. Examples of these are:
- Fasteners which secure essential panels and which can be insecurely fastened due to wear or left unfastened without being detected.
Table 7.2 HAZOPS on motion system (partial).
- Wear in seals, causing leaks in hydraulic or pneumatic systems.
- Resistance increase of electrical contacts due to arcing and accretion of oxides.
- Failure of protective surfaces, such as paints, metal plating or anodized surfaces.
- Distortion of pins, or intermittent contact, on multipin electrical connectors.
- Drift in electronic component parameter values.
- Electromagnetic interference (EMI) and timing problems in electronic systems.
- Other personnel-induced failures such as faulty maintenance, handling or storage, for example, omitting to charge electrolytic capacitors kept in long-term storage, which can result in reduced charge capacity in use.
- Interface problems between sub-systems, due to tolerance mismatch.
All of these modes can lead to perceived failures. Failure reporting systems always include a proportion of such failures. However, there is usually more scope for subjective interpretation and for variability due to factors such as skill levels, personal attitudes and maintenance procedures, especially for complex equipment.
Non-material failures can be harder to assess at the design stage, and often do not show up during a test programme. Design reliability assessments should address these types of failure, even though it may be impracticable to attempt to predict the frequency of occurrence in some cases, particularly for personnel-induced failures.
7.4.11 Critical Items List
The critical items list is a summary of the items shown by the other analyses to be likely either to have an appreciable effect on the product's reliability or to involve uncertainty. Its purpose is to highlight these items and summarize the action being taken to reduce the risks. The initial list will be based upon the design analyses, but updates will take account of test results, design changes and service data as the project develops. The critical items list is a top document for management reporting and action as it is based upon the ‘management by exception’ principle and summarizes the important reliability problems. Therefore, it should not usually include more than ten items and these should be ranked in order of criticality, so that management attention can be focused upon the few most important problems. It could be supported by a Pareto chart (Chapter 13) to show the relative importance, when there are sufficient data. The critical items list should provide only identification of the problem and a very brief description and status report, with references to other relevant reports.
7.4.12 Load Protection
Protection against extreme loads is not always possible, but should be considered whenever practicable. In many cases the maximum load can be pre-determined, and no special protection is necessary. However, in many other loading situations extreme external loads can occur and can be protected against. Standard products are available to provide protection against, for example, overpressure in hydraulic or pneumatic systems, impact loads or electrical overload. When overload protection is provided, the reliability analysis is performed on the basis of the maximum load which can be anticipated, bearing in mind the tolerances of the protection system. In appropriate cases, loads which can occur when the protection system fails must also be considered.
However, in most practical cases it will be sufficient to design to withstand a predetermined load and to accept the fact that loads above this will cause failure. The probability of such loads occurring must be determined for a full reliability analysis to be performed. It may not always be practicable to determine the distribution of such extreme events, but data may be available either from failure records of similar items, or from test or other records.
Where credible data are not available, the worst design load case must be estimated. The important point is that the worst design case is estimated and specified. A common cause of failure is the use of safety factors related to average load conditions, without adequate consideration having been given to the extreme conditions which can occur during use of the product.
7.4.13 Protection against Strength Degradation
Strength degradation, in its many forms, can be one of the most difficult aspects to take into account in design reliability analysis. Strength degradation due to fatigue in metals is fairly well understood and documented, and therefore reliability analysis involving metal fatigue, including the effects of stress raisers such as notches, corners, holes and surface finish, can be performed satisfactorily, and parts can be designed to operate below the fatigue limit, or for a defined safe life.
However, other weakening mechanisms are often more complex. Combined stresses may accelerate damage or reduce the fatigue limit. Corrosion and wear are dependent upon environments and lubrication, the effects of which are therefore often difficult to forecast. If complete protection is not possible, the designer must specify maintenance procedures for inspection, lubrication or scheduled replacement.
Reliability analysis of designs with complex weakening processes is often impracticable. Tests should then be designed to provide the required data by generating failures under known loading conditions. Chapter 8 covers these aspects in more detail.
7.4.14 Design Reviews
The review techniques described must be made part of a disciplined design sequence, or they will merely generate work and not advance the objective of more reliable design. To be effective, they must be performed by the people who understand the design. This does not necessarily mean the designers, for two reasons. First, the analyses are an audit of their work and therefore an independent assessment is generally more likely to highlight aspects requiring further work than would be the case if the designers were reviewing their own work. Second, the analyses are not original work in the same sense as is the design. The designers are paid to be creative and time spent on reassessing this effort is non-productive in this sense. The designers may, however, be the best qualified to perform much of the analysis, since they know the problems, assessed the options, carried out all the design calculations and created the solutions. On the other hand, the creative talent may not be the best at patiently performing the rather tedious review methods.
The best solution to this situation is the peer review format, where the engineers performing the reviews work closely with the designers and act as their ‘Devil's advocate’ during the creative process. In this way, designers and the reviewers work as a team, and problem areas are highlighted as early as possible. The organization of reliability engineering staff to provide this service is covered in Chapter 17. The reviewer should ideally be a reliability engineer who can be respected by the designer as a competent member of a team whose joint objective is the excellence of the design. Since the reliability engineer is unlikely to spend as much time on one design as the designer, one reliability engineer can usually cover the work of several designers. The ratio obviously depends upon the reliability effort considered necessary on the project and on the design disciplines involved.
By working as a team, the design and reliability staff can resolve many problems before the formal analysis reports are produced, and agreement can be reached on recommendations, such as the tests to be performed. Since the reliability engineer should plan and supervise the tests, the link is maintained. Also, the team approach makes it possible for designs to be adequately reviewed and analysed before drawings are signed off, beyond which stage it is always more difficult and more expensive to incorporate changes.
Unfortunately, this team approach is frequently not applied, and design and reliability staff work separately in preparing analyses and criticizing one another's work at a distance, either by email, teleconferencing, or over the conference table. Design review techniques then lose credibility, as do reliability staff. The main victim is the design itself, since the protagonists usually prosper within their separate organizations.
To be of continuing value, the design analyses must be updated continually as design and development proceed. Each formal review must be based upon analyses of the design as it stands and supported by test data, parts assessments, and so on. The analyses should be scheduled as part of the design programme, with design reviews scheduled at suitable intervals. The reviews should be planned well in advance, and the designers must be fully aware of the procedure. All people attending must also be briefed in advance, so they do not waste review time by trying to understand basic features. To this end, all attendees must be provided with a copy of all formal analysis reports (reliability prediction, load–strength analysis, PMP review, maintainability analysis, critical items list, FMECA, FTA) and a description of the item, with appropriate design data such as drawings. The designer should give a short presentation of the design and clear up any general queries. Each analysis report should then form a separate agenda item, with the queries and recommendations as the subjects for discussion and decision. If experience has generated a checklist appropriate to the design, this could also be run through, but see the comments that follow.
With this procedure, nearly all aspects requiring further study or decision will have been discussed before, during the continuous, informal process of the team approach to preparing the analyses. The formal review then becomes a decision-making forum, and it is not bogged down with discussion of trivial points. This contrasts markedly with the type of design review meeting which is based largely upon the use of checklists, with little preparatory work. Such reviews become a stolid march through the checklist, many of whose questions might be irrelevant to the design. They can become a substitute for thinking.
Three golden rules for the use of checklists should be:
- Use them in the design office, not during the formal design review meetings.
- Ensure that they are relevant and up to date.
- Avoid vague questions such as ‘Has maintenance been considered?’, or even ‘Are the grease points accessible?’ ‘What access is provided for lubrication?’ would be a better question, since it calls for detailed response, not a simple affirmative.
The design review team should consist of staff from sales, production, QA and specialists in key design areas. The people on the spot are the designers and the reliability engineering team member (who may belong to the QA department). The chairman should be the project manager or another person who can make decisions affecting the design, for example, the chief designer. Sometimes design reviews are chaired by the procuring agency, or it may require the option of attending. A design review which is advisory and has no authority is unlikely to be effective, and therefore all those attending must be concerned with the project (apart from specialists called in as advisers).
Formal design review meetings should be scheduled to take place when sufficient information is available to make the meeting worthwhile and in time to influence future work with the minimum of interference with project schedules and budgets. Formal and informal design reviews should begin at the IDENTIFY stage of the DfR process and continue virtually through all of its phases, although with different intensity. Three formal reviews are typical, based upon initial designs, completion of development testing and production standard drawings. Each review authorizes transition to the next phase, with such provisos deemed to be necessary, for example, design changes, additional tests. The design reviews should be major milestones in a project's evolution. They are not concerned solely with reliability, of course, but reliability engineers have considerably influenced the ways that modern design reviews are conducted, and design reviews are key events in reliability programmes.
7.4.15 Design Review Based on Failure Modes (DRBFM)
When the design is evolutionary and does not involve many changes, a technique called Design Review Based on Failure Modes (DRBFM) can be applied. This tool was originally developed by Toyota engineers on the premise that reliability problems occur when changes are made to existing designs that have already been proven successful. DRBFM can be considered as a narrowed down FMECA with the attention focusing on the new points and changed points from the existing design. DRBFM encourages design teams to discuss the potential design problems or weaknesses from a cross functional multi-perspective approach, and to develop corrective actions.
DRBFM is performed based on FMECA while focusing specifically on product changes, both intentional and incidental. Therefore DRBFM activities are similar to FMECA and use similar format worksheets. The DRBFM worksheet can vary but usually requires the information about the following: component, its function, change point(s), reasons for change, potential failure modes, condition of their precipitation, effect on the customer, design steps to prevent that failure, recommended actions (result of DRBFM) and action results (conclusion of DRBFM). The Society of Automotive Engineers (SAE) has published standard J2886 containing an explanation of what the DRBFM process is, the recommended steps and examples of how to conduct this process.
7.4.16 Human Reliability
The term ‘human reliability’ is used to cover the situations in which people, as operators or maintainers, can affect the correct or safe operation of systems. In these circumstances people are fallible, and can cause component or system failure in many ways.
Human reliability must be considered in any design in which human fallibility might affect reliability or safety. Design analyses such as FMECA and FTA should include specific consideration of human factors, such as the possibility of incorrect operation or maintenance, ability to detect and respond to failure conditions, and ergonomic or other factors that might influence them. Also, where human operation is involved, product design should be made in full consideration of physiological and psychological factors in order to minimize the probability of human error in system operation.
Attempts have been made to quantify various human error probabilities, but such data should be treated with caution, as human performance is too variable to be credibly forecast from past records. Human error probability can be minimized by training, supervision and motivation, so these must be considered in the analysis. Of course in many cases the design organization has little or no control over these factors, but the analyses can be used to highlight the need for specific training, independent checks, or operator and maintainer instructions and warnings. More on human factors in engineering can be found in Wickens et al. (2003).
7.5 Analyse
It is important at this phase to further address all the potential sources of product failure. Various types of analysis can be done after the first draft of design is created, including physics of failure, finite element analysis (FEA), warranty data analysis, continued DRBFM, reliability prediction (Chapter 6), study of the lessons learned on previous programmes, design of experiments (DOE) (Chapter 11), derating analysis (Chapter 9). When a mock up, proof of concept, or engineering development unit is built it will make it easier to verify the results of the analysis and improve on the design.
Finite element analysis (FEA) is one of the important tools for physics of failure (PoF) analysis discussed in Chapter 6. FEA can be utilized to calculate the stresses caused by thermal expansion, vibration, accidental drop, and other environments. It can also be used to estimate fatigue life for products subjected to thermal cycling or vibration. More on fatigue is covered in Chapter 8.
As shown in Figure 7.2, DfR flow has an iterative pattern, especially in the DESIGN-ANALYZE-VERIFY sequence, thus the same design tools can be used at the different phases.
7.5.1 Field Return and Warranty Data Analysis
Field return and warranty data analysis can be an invaluable source in identifying and addressing potential reliability problems. In the cases where the new product design is not significantly different from the existing one, failures experienced in the field can be relevant to the new design. Engineering feedback from the field is essential to successful product design and development. The new product development process needs to be attuned to the engineering analysis of returned parts to prevent old problems from recurring in new products.
Depending on the complexity of the returned parts, the engineering analysis tasks can be accomplished by failure analysis or structured problem solving, or by using a combination of existing continuous improvement tools.
Engineering analysis, for example, can determine that a failure occurred due to an assembly problem, end-user abuse, software malfunction, electronic or mechanical component failure, corrosion, overheating or vibration. The analysis should narrow down the design related failure and identify the problems which may repeat themselves in the new design. For example, if the same faulty parts will be used in the new product, or if the parts would go through the same soldering process at the same assembly plant, where the field return parts came from.
Additionally, warranty data are routinely used for reliability and warranty prediction in new product development. Field failure data of existing products can often be more accurate reliability predictors of future products than some of the traditional methods, such as reliability growth models (Chapter 14) or standards-based predictions.
7.6 Verify
At this stage hardware prototype is available and the design verification activities can begin. These activities include accelerated life testing (ALT) and highly accelerated life testing (HALT) (both Chapter 12); life data analysis (Chapter 3), degradation analysis, configuration control, sub-system level testing, reliability growth modelling (Chapter 14). After a problem is detected, root cause analysis and structured problem solving can be applied using tools like the Ishikawa diagram and other techniques covered in Chapter 15.
7.6.1 Degradation Analysis
Product verification often involves test to failure and life data analysis. However in many cases it may take too long for the product to fail operating under normal or even accelerated stress conditions. Degradation analysis is one way to shorten the test time and assess if the product is meeting reliability specifications. It can also be a way to assess the strength degradation covered in Section 7.4.9. Degradation analysis involves measurement of the degradation of a certain product characteristic over time (current reduction, wear, etc.), and extrapolation of this degradation data to estimate the eventual failure time for the product. More on degradation analysis will be covered in Chapter 14.
7.6.2 Configuration Control
Configuration control is the process whereby the exact design standard of a system is known. Configuration control applies to hardware and to software. Effective configuration control ensures that, for example, the specifications and sources of components, and the issue numbers of drawings, can be readily identified for a particular system. Configuration control is very important in the development and production of systems, and it is mandatory for projects such as in aerospace (civil and military) and defense. Formal control should start after the first design review.
Configuration control is important to reliability, since it allows failures to be traced back to the appropriate design standard. For example, failures might occur in a component machined to a particular tolerance; the configuration control system should enable this cause to be identified.
7.7 Validate
The term ‘validation’ might have different meanings depending on the engineering area it is applied in. For example in systems engineering ‘validation’ is defined as the process to ensure that the system meets all the customer requirements and specifications with the emphasis on the system's functionality. In reliability engineering validation usually deals with both functional and environmental specifications and it is also set up to ensure that all the reliability requirements of the system are met.
At the VALIDATE stage hardware design and verification are complete, software is debugged and the system is fully functional. The goal of validation is to successfully resolve design and manufacturing issues in case they had been overlooked at the previous design phases. Validation usually involves functional and environmental testing at a system level with the purpose of ensuring that the design is production-ready. These activities may include test to failure or test to success (Chapter 14) and are usually conducted at field stress levels or as accelerated life testing (ALT). It is also important at this stage to have the software tested, released, and be production-ready. Reliability requirements also need to be demonstrated at this stage.
Product validation is often done in two phases design validation (DV) and process validation (PV). DV activities usually include the environmental, durability, capability and functional tests and are executed on a prototype. The PV tasks are similar to DV but are executed on pilot or production parts, preferably manufactured at the intended production facilities. The intent is to validate that the production processes are fully capable of repeatedly producing products that meet specifications. More on reliability testing, reliability data analysis and reliability demonstration are covered in Chapters 12–14.
7.8 Control
The goal at this stage is to keep the manufacturing process under control and maintain low process variability (Chapter 15). The engineering tools applied at this stage include automatic inspections, control charts, audits, human factor, burn-in, analysis of the known production issues, environmental stress screening (ESS) (Chapter 15), highly accelerated stress screening (HASS) (Chapter 12), process FMEA, and other production-focused activities. Many of the activities discussed in this section should be started at the earlier phases of the design process (sometimes as early as DESIGN stage) and run in parallel to the other design activities, however since they directly affect production processes they are listed and explained in this section.
7.8.1 Design Analysis for Processes
The processes that will be used to manufacture and maintain the product must be understood and optimized. It is essential that all of the processes are capable of being performed correctly and efficiently, whether by people or by machines. Therefore the designers must know the methods that will be used and their capabilities and limitations, and must design both the product and the processes accordingly. The test programme must include tests of all of the processes that have been shown by the analyses to be critical or important.
The applicable analysis methods that can be used are described below.
7.8.2 Variation
As discussed in Chapter 2, all manufacturing processes are subject to variation, as are parameter values and dimensions of parts and subassemblies. Production people and processes inevitably vary in their performance in terms of accuracy and correctness. The design must take all of these into account, and must minimize the possibility of failure due to production-related causes.
The use of FMECA to help to identify such causes has been mentioned above. Techniques for evaluating the effects of variation in production processes are described later. These methods are sometimes referred to as process design, to distinguish them from those aspects of the design which address the product specification and its environment. Product and process design, using an integrated approach, including the test and analysis techniques described later, are sometimes referred to as off-line quality control. Process design leads to the setting of the correct controls on the production processes, for monitoring as part of on-line quality control, described in Chapter 15.
There are two possible approaches to designing for parameter variation and tolerances, the ‘worst case’ approach, and statistical methods. The traditional approach is to consider the worst case. For example, if a shaft must fit into a bore, the shaft and bore diameters and tolerances might be specified as: shaft, 20 ± 0.1 mm; bore, 20.2 ± 0.1 mm, in order to ensure that all shafts fit all bores. If the tolerance limits are based upon machining processes which produce parts with normally distributed diameters, of which 2.5% are oversize and 2.5% are undersize (2σ limits), the probability of a shaft and bore having an interference would be
0.025 × 0.025 = 0.000625
On the other hand, most combinations will result in a fairly loose fit. Figure 7.8 shows the situation graphically. 25% of combinations will have fits greater than 0.2 mm.
If, however, statistical tolerancing were used, we could design for much closer nominal diameters and still have an acceptably low probability of interference. If the shaft nominal diameter was set at 20.1 mm (dotted line on Figure 7.8), the interference probability PI can be calculated as:

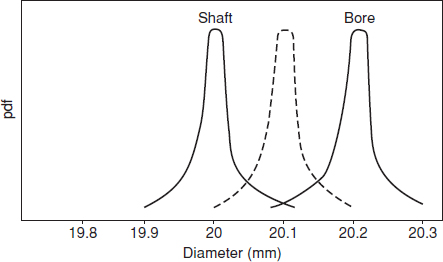
Figure 7.8 Shaft–bore interference.
In this case, if 2σ is 0.1 mm then σ is 0.05 mm. Therefore,

This is a very simple example to illustrate the principle. Ryan (2000) covers statistical tolerancing in more detail. For systems such as electronic circuits, where tolerances of many components must be considered, statistical analysis of parameter tolerances or drift can provide more economic designs, since the probability of several parts being near their specification limits is much lower than for one or two parts. Statistical tolerancing can also result in lower production costs, since part and subassembly test specifications do not need to be as tight and thus there will be fewer test rejects. However, statistical tolerancing must be based on the correct models, and it is not always safe to assume that variables are normally distributed. For example, many electronic parts are sorted, with parts whose values lie close to the nominal being sold as ‘precision’ parts. Thus the distribution of values of a lot from which such parts have been removed would be bimodal, with no parts being within the sorted range of the nominal value (see Chapters 2 and 9, Figure 9.11).
Methods for analysing multiple simultaneous variations are described in Chapter 11.
7.8.3 Process FMECA
A process FMECA (PFMECA) is performed as described above for FMECA, but instead of asking ‘how can the component or function fail?’ we ask ‘how can the process fail?’ Each process task is considered in turn, with the objective of identifying potential problems so that improved methods or controls can be set up. For an example of process FMECA see ReliaSoft (2003).
7.8.4 ‘Poka Yoke’
Poka Yoke is the Japanese expression for ‘mistake proofing’. It is a design approach that considers the ways in which processes might be incorrectly performed, and then making it difficult or impossible to do so. Examples are templates to ensure that directional components cannot be connected the wrong way round.
7.8.5 Testability Analysis
Electronic circuits and systems must be tested after assembly to ensure that they are correct, and to indicate the sources of failure. Testability and testability analysis are described in Chapter 9.
7.8.6 Test Yield Analysis
By using the Monte Carlo capabilities of design software (similar to the methods covered in Chapter 4) and knowledge of test or measurement criteria, yield prediction analyses can be performed on designs that are described in appropriate models.
7.8.7 Maintainability Analysis
Maintenance tasks that might be necessary, such as lubrication, cleaning, replenishment, calibration, failure diagnosis and repair, must all be analysed to ensure that they can be performed correctly by the people likely to be involved. Aspects that should be covered include physical accessibility, time to perform the tasks, skill levels, training requirements, special tools and equipment, and the need for special facilities. Maintenance and maintainability are covered in Chapter 16.
7.9 Assessing the DfR Capability of an Organization
In order to successfully implement the DfR process and deliver reliable products an organization should possess the required tool set, needed expertise, the resources, and the reliability-focused priorities. Therefore an organization needs to be able to evaluate itself and its suppliers on the basis of how capable it is to conduct DfR activities. The evaluation methods for organizational reliability processes are reliability capability and reliability maturity assessments. They will be covered in Chapter 17.
7.10 Summary
The methods comprising the DfR process can be expensive in engineering time, and this can be a constraint on their effective application. They all involve the detailed consideration of many aspects, such as product characteristics in QFD, system simulation, LSA, failure modes in FMECA, sneak analysis (Chapter 9) and FTA (Chapter 6), and process analysis. However, in addition to improving reliability, DfR can help to reduce overall project time and cost if it is applied effectively, particularly since the prime objective is always to identify and prevent or correct problems early. If product timescales are very tight, which is often the case, it is important that early decisions are made on which methods will be applied and how the results will be used. It might be appropriate to limit the scope of the analyses. For example, the QFD might be limited to a small number of critical design requirements, including variations if appropriate, and the LSA and FMECA to a few identified critical components rather than applied to all. Risk factors described in Section 7.3.5 should be used as guiding principles on how many DfR tools to use and to what extent. The higher the risk of a programme the closer the DfR process should be followed.
An important result of the development of modern engineering design and analysis software is the possibility of reducing the need for development testing. This can be a very worthwhile objective, since projects are nearly always under pressure to reduce development costs and time. However, no design analysis software can deal with the whole range of possible operating stresses, environments, variations and degradation mechanisms that can cause failures. All design analysis and simulation methods involve assumptions and simplifications that can, to varying degrees, generate erroneous or misleading results.
Whilst it is always possible in theory to analyse the effects of variation by performing analyses with parameter values set at, say, tolerance limits or over tolerance ranges, and most CAE software includes facilities for tolerance analysis, it is often difficult and time-consuming to perform such analyses effectively. In particular, analysis implies that distribution parameters and interaction effects are known. As explained in Chapter 2, these aspects are often very uncertain.
Ultimately, only the actual hardware embodies the whole truth of the design, particularly aspects which might have been neglected or misrepresented in the analysis. The need for testing is a direct consequence of the uncertainty gaps that arise as a result of the limitations inherent in all design analysis. Therefore the results of the analyses should be used to help to plan and prioritize the tests, and the engineers involved should be part of the test team. Test methods are described in Chapter 12, and we will discuss the management aspects of integrating the design and test activities in Chapter 17.
Questions
- Produce a failure mode and effect analysis (FMEA) for five components in one of the following systems: (i) a domestic washing machine; (ii) the braking system of an automobile; (iii) a simple camera; (iv) a portable transistor radio; or (v) any other system with which you are familiar (giving a brief explanation of its function). Your answer should be properly laid out as if it formed part of a complete FMEA on the system. Explain the additional considerations that would be included to convert your FMEA into a FMECA.
- Describe the main uses to which a completed FMECA can be applied.
- Describe three methods that can be used to analyse and improve the processes that will be used for the manufacture of a new product design.
- Explain briefly, using diagrams if appropriate, the following methods:
- Quality function deployment.
- Process FMEA.
- Hazard and operability study.
- Poka yoke.
- Critical items list.
- Comment on the values you would apply to the likelihood of failures if you are performing a FMECA for each of the following (consider the availability of data, its credibility and the purpose of the analysis):
- Operation of a car seat positioning system.
- Operation of a train braking system.
- Test coverage of an electronic circuit being used in a mobile telephone.
- Operation of the fuse of a hydrogen bomb.
- Give four questions that would be appropriate for the reliability aspects of a design review of either a high speed mechanism involving bearings, shafts and gears and high mechanical stress, or for design of a DC electrical power supply unit which uses a standard AC power input.
- Discuss the ways by which the design review process should be managed in order to provide the most effective assurance that new product designs are reliable, produceable and maintainable. Comment on the organizational and procedural aspects, as well as the actual conduct of the review.
- Discuss the factors you would consider in producing a Reliability Critical Items List for
- a modern electronically controlled washing machine.
- a fighter aircraft electronic box.
- Develop a QFD House of Quality for a common system such as a coffee maker, a hand calculator, a digital camera, a water heater, a lawnmower, a microwave oven, an electronic thermostat, a TV remote control, a vacuum cleaner or other everyday product. Use your own or commonly available technical knowledge about the device.
- Research the Internet on the subject of DFSS (Design for Six Sigma). Make a list of common features and the list of major differences between DFSS and DfR.
- What would you consider as the very first step in the FMECA process?
- Since the RPN index in FMECA is somewhat subjective, how would you determine the minimum RPN value for the critical items needing attention and corrective actions?
- Consider design situations where DRBFM would be beneficial and where it would not be beneficial. Give one example of each.
- Consider the DfR process flow Figure 7.2. Describe the cost factors for each of the DfR stages. What would be the contributing cost factors to correcting a design error at each of the six DfR stages?
- How would you consider the role of industry standards in successful implementation of the Design for Reliability process?
Bibliography
AIAG (2003) Potential Failure Mode & Effects Analysis: FMEA-3. Available at www.aiag.org.
Akao, Y. (1990) QFD: Quality Function Deployment - Integrating Customer Requirements into Product Design, Productivity Press.
Allan, L. (2008) Change Point Analysis and DRBFM: A Winning Combination. Reliability Edge (published by ReliaSoft), volume 9, issue 2. Available at http://www.reliasoft.com/newsletter/v9i2/drbfm.htm.
British Standard, BS 5760. Reliability of Systems, Equipment and Components. British Standards Institution, London.
Brombacher, A. (1999) Maturity Index on Reliability: Covering Non-technical Aspects of IEC61508. Reliability Certification Reliability Engineering & System Safety, 66(2), 109–120.
Clausing, D. (1994) Total Quality Development: a Step by Step Guide to World Class Concurrent Engineering, ASME Press.
Creveling C., Slutsky, J. and Antis, D. (2003) Design for Six Sigma in Technology and Product Development, Prentice Hall.
Crowe, D. and Feinberg, A. (2001) Design for Reliability (Electronics Handbook Series), CRC Press, Boca Raton.
Mettas, A. (2010) Design for Reliability: Overview of the Process and Applicable Techniques. International Journal of Performability Engineering (IJPE), 6(6), November 2010 - Paper 4 - 577–586.
ReliaSoft (2001) Using Degradation Data for Life Data Analyses, Reliability Edge, Volume 2, Issue 2. Available at: http://www.reliasoft.com/newsletter/2q2001/degradation.htm.
ReliaSoft (2003) Process FMEA sample (Front Door L.H), Available at http://www.weibull.com/basics/fmea_fig1.htm.
ReliaSoft (2007) Fundamentals of Design for Reliability: RS 560 Course Notes. Available at http://www.reliasoft.com/seminars/gencourses/rs560.htm.
ReliaSoft (2008) Design for Reliability: Overview of the Process and Applicable Techniques. Reliability Edge, Volume 8, Issue 2. http://www.reliasoft.com/newsletter/v8i2/reliability.htm.
Ryan, T. (2000) Statistical Methods for Quality Improvement, Wiley.
SAE J-1739, Potential Failure Mode and Effects Analysis. Society of Automotive Engineers, USA.
Silverman, M. (2010) How Reliable is Your Product? 50 Ways to Improve Product Reliability, Super Star Press, Silicon Valley, California.
Stamatis, D. (2003) Failure Mode and Effect Analysis: FMEA from Theory to Execution, 2nd edn, American Society for Quality (ASQ) Press.
US MIL STD1629A: Failure Mode and Effects Analysis. National Technical Information Service, Springfield, Virginia.
Wickens, C., Lee, J., Liu Y. and Gordon-Becker, S. (2003) Introduction to Human Factors Engineering, 2nd edn, Prentice Hall.