
Throughout this book, we’ve talked about logging and monitoring and their value in troubleshooting your applications and services. In the first section of this chapter, we’re going to look at how logs work on the Linux operating system and how to make use of that data. We’ll look at how to store, aggregate, analyze, send alerts on, and rotate log entries and logs. We’ll also look at some tools to make it easier to interact with your logs.
In the second section of this chapter, we’ll show how you can use an open source tool called Nagios to monitor the applications and services we’ve introduced. Nagios allows you to define your hosts and the services that run on them. You can then ensure these hosts are up and that your services are functioning correctly. If they are not functioning, your monitoring system can then notify you about what has gone wrong. This process can greatly speed up the time it takes to identify and fix issues.
Logging
You’ve seen throughout the book that many applications and tools log data about their actions and status. You have seen that we can use the journalctl command to view logs and also that logs can end up in the /var/log directory in a variety of files. Logging is, usually, done by two daemons: the journald daemon and the rsyslogd daemon. We will look at each of these now.
journald
As part of systemd, a new logging capability was introduced. Journald creates binary structured log files and can be used instead of, or with, traditional (r)syslog logging. These are some of the features of the Journald log file:
Log tampering can be detected and cannot easily be manually edited.
Logs are indexes, making faster searching.
Logs are in a structured format with well-defined fields.
journald collects extra log metadata for each log message.
Journald supports export formats (such as JSON).
The logs are by default stored in system memory or a ring buffer and are not stored permanently. Because of the extra metadata, the log events are larger in size than normal logs and take more space. You can persist them to disk, and we will show you how to do that a little later in the chapter.
We access the journal files with the journalctl command that we have already used several times. If you execute the journalctl command without any arguments or filters, you will see something like Listing 18-1.
Listing 18-1. The journalctl Command
$ sudo journalctl-- Logs begin at Fri 2016-11-25 22:16:00 AEDT, end at Mon 2016-11-28 21:07:54 AEDT. --Nov 25 22:16:00 au-mel-centos-1 systemd-journal[89]: Runtime journal is using 8.0M...current limit 92.0M).Nov 25 22:16:00 au-mel-centos-1 systemd-journal[89]: Runtime journal is using 8.0M...current limit 92.0M).Nov 25 22:16:00 au-mel-centos-1 kernel: Initializing cgroup subsys cpusetNov 25 22:16:00 au-mel-centos-1 kernel: Initializing cgroup subsys cpuNov 25 22:16:00 au-mel-centos-1 kernel: Initializing cgroup subsys cpuacctNov 25 22:16:00 au-mel-centos-1 kernel: Linux version 3.10.0-327.4.5.el7.x86_64 ...CentOS 4.8.3-9) (GCC)...Nov 25 22:16:00 au-mel-centos-1 kernel: Command line: BOOT_IMAGE=/vmlinuz-3.10.0-327.4.5.el7.x86_64...Nov 25 22:16:00 au-mel-centos-1 kernel: e820: BIOS-provided physical RAM map:
The output of journalctl will show our logs from when we booted our host, and we have truncated some long lines for clarity. You first see the journal starting, and then you see the initialization of cgroups, followed by the Linux kernel version and how it was built. Then we see the kernel-loading command followed by low-level memory initialization.
The first line in Listing 18-1 shows us the date of the first entry and the date of the last entry. You can see that each log here consists of four things.
A timestamp
The hostname
The service emitting the log
The log message
Looking further at the journalctl command, we will explore some of the options available with it. For instance, to view the last ten lines of the journal, we will issue the following:
$ sudo journalctl –n 10-- Logs begin at Fri 2016-11-25 22:16:00 AEDT, end at Mon 2016-11-28 21:24:54 AEDT. --Nov 28 21:01:01 backup run-parts(/etc/cron.hourly)[9627]: starting 0yum-hourly.cron...Nov 28 21:24:54 backup sudo[9647]: bsingh : TTY=pts/0 ; PWD=/home/bsingh ; USER=root ; COMMAND=/bin/journalctl -n 10
Here we see the last ten lines (eight lines are omitted), with the last log entry being the sudo command we just entered. What we are seeing here is the simplified view of the log made up of the four fields we just talked about. There is a lot of data about the logs we don’t see. Let’s take a look at the last entry more closely with the verbose output (see Listing 18-2).
Listing 18-2. Journal Metadata
$ sudo journalctl -n 1 -o verbose-- Logs begin at Fri 2016-11-25 22:16:00 AEDT, end at Mon 2016-11-28 21:29:46 AEDT. --Mon 2016-11-28 21:29:46.407435 AEDT [s=1798dd89d9ff412b8edcc9e7b5cb8484;i=1c0b;b=11ffa7916baa42a89cbbc756af6d26bc;m=2486cb476a;t=54259f362b5ab;x=68026ef74697a39]_BOOT_ID=11ffa7916baa42a89cbbc756af6d26bc_MACHINE_ID=e3c7fd86ed8b4ef69e569a93e30db6abPRIORITY=5_CAP_EFFECTIVE=1fffffffff_HOSTNAME=backup_TRANSPORT=rsyslogSYSLOG_FACILITY=10_AUDIT_LOGINUID=1000_SYSTEMD_OWNER_UID=1000_SYSTEMD_SLICE=user-1000.sliceSYSLOG_IDENTIFIER=sudo_COMM=sudo_EXE=/usr/bin/sudo_SELINUX_CONTEXT=unconfined_u:unconfined_r:unconfined_t:s0-s0:c0.c1023_AUDIT_SESSION=40_SYSTEMD_CGROUP=/user.slice/user-1000.slice/session-40.scope_SYSTEMD_SESSION=40_SYSTEMD_UNIT=session-40.scope_UID=1005_GID=1006MESSAGE= bsingh : TTY=pts/0 ; PWD=/home/bsingh ; USER=root ; COMMAND=/bin/journalctl -n 1 -o verbose_PID=9653_CMDLINE=sudo journalctl -n 1 -o verbose_SOURCE_REALTIME_TIMESTAMP=1480328986407435
You can see that each log contains a wealth of associated metadata. The first line after the log date range information is the cursor position information, or the entry’s position in the journal. The rest are key/value pairs with a wealth of filterable data. Let’s now look at some common filters.
journalctl Filters
The great thing about the journal logging facility is that it is structured, meaning that we can filter information we are interested in easily. Anyone with Linux experience will tell you their favorite incantations to investigate logs. With filters we no longer need to rely on piping logs through commands such as grep and awk so much.
We will start with filtering the journalctl output by just kernel messages by using the –k option.
$ sudo journalctl –k-- Logs begin at Fri 2016-11-25 22:16:00 AEDT, end at Mon 2016-11-28 22:06:08 AEDT. --Nov 25 22:16:00 au-mel-centos-1 kernel: Initializing cgroup subsys cpusetNov 25 22:16:00 au-mel-centos-1 kernel: Initializing cgroup subsys cpu...Nov 28 21:01:01 backup kernel: SELinux: initialized (dev tmpfs, type tmpfs), uses transition SIDsNov 28 22:01:01 backup kernel: SELinux: initialized (dev tmpfs, type tmpfs), uses transition SIDs
Now let’s reduce that long list to only those kernel log messages that are of an ERROR priority (-p).
$ sudo journalctl -p err -k-- Logs begin at Fri 2016-11-25 22:16:00 AEDT, end at Mon 2016-11-28 22:10:14 AEDT. --Nov 25 22:16:13 backup kernel: CIFS VFS: Send error in SessSetup = -127Nov 25 22:16:13 backup kernel: CIFS VFS: cifs_mount failed w/return code = -127Nov 25 22:17:13 backup kernel: CIFS VFS: Send error in SessSetup = -13
Here we have listed all the kernel logs that are in error. There are seven priorities available to use; either the word or the number will do.
emerg(0)— emergency
alert(1)
crit(2)— critical
err(3)— error
warning(4)
notice(5)
info(6)—information
debug(7)
The –k option is the same as using the dmesg command to view logs, but as you can see, journalctl is easier to read and filter.
We can combine filters. We can see messages since the last system boot with the –b option.
$ sudo journalctl –p info –bThis can often still be a lot of messages, so we can further refine this with more specific time filters.
$ sudo journalctl -p info --since "2016-11-28 22:44:00" --until "2016-11-28 22:54:00"Here we are displaying the logs at priority info for the last ten minutes. The times are in local time. If you want to see UTC times, you can issue the following:
$ sudo journalctl --utcIn Listing 18-2 we saw the full list of fields that are included in our logs. We can use this metadata as filters too. One of the fields from Listing 18-2 is _COMM, which records the command that was used in generating the log. We can list all the different values for that field with the following:
$ sudo journalctl –F _COMMunix_chkpwdrequest-keyfreshclam-sleeprun-partspickupusermod...
Let’s say we want to search for any usermod changes that have happened since the last boot.
$ sudo journalctl _COMM=usermod -b-- Logs begin at Fri 2016-11-25 22:16:00 AEDT, end at Mon 2016-11-28 23:09:04 AEDT. --Nov 25 22:48:41 backup usermod[4844]: add 'jsmith' to group 'sales'Nov 25 22:48:41 backup usermod[4844]: add 'jsmith' to shadow group 'sales'
We can also combine any of these fields with the --since and --until time filters to get a more narrow view. Having two fields listed (separated by a space) provides a logical AND listing (_COMM=usermod _COMM=useradd). Using a + will give you a logical OR listing (_COMM=usermod + _HOSTNAME=backup), which will provide a listing with usermod and any listing with the hostname backup.
Tip
Typing journalctl and pressing the Tab key twice will give you a list of available fields.
We can also list logs by their systemd unit names. Here we are going to follow (like the tail command) the httpd log using the following:
$ sudo journalctl -f -u httpd.service-- Logs begin at Fri 2016-11-25 22:16:00 AEDT. --Nov 28 23:27:11 backup systemd[1]: Starting The Apache HTTP Server...Nov 28 23:27:11 backup systemd[1]: Started The Apache HTTP Server.
Here you can see the output of the Apache service as it starts up.
Securing Journald with FSS
We said earlier that we can detect whether journal logs have been tampered with. This is done with a feature called Forward Secure Sealing (FSS), which signs the logs with one of a generated key pair. A sealing keywill seal the logs at a specified interval, and the verify keycan be used to detect tampering. The logs are singed, or sealed, at regular configurable intervals. This provides some level of security for your logs.
However, it does not stop people who attack your system from covering their tracks, and they can get around this by either deleting the logs or editing between the sealing time interval. It does not provide any extra information in the event of someone tampering with your logs but will give you a timeframe in which such an event happened. It can be seen as one small piece of your overall system security.
To use FSS, you first need to enable the persistent storage of your journal log files. This is easily done by issuing the following:
$ sudo mkdir /var/log/journal$ sudo systemctl restart systemd-journald
Then to generate the key pair, we will issue the command in Figure 18-1.
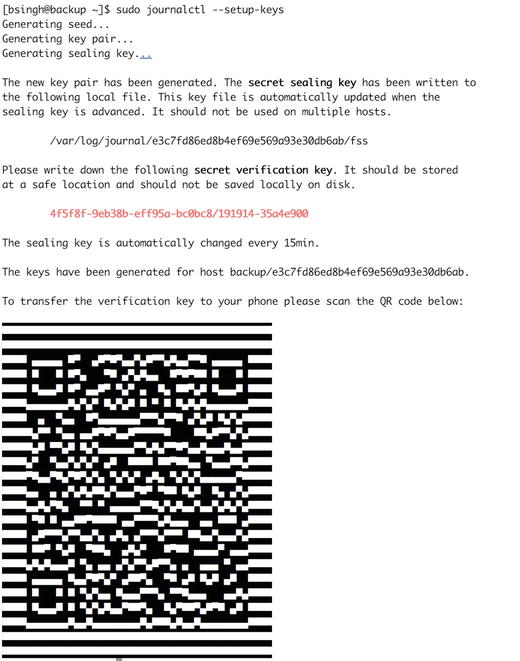
Figure 18-1. FSS key generation and QR code
As the text in Figure 18-1 says, we should store the secret verification key in a safe place, and it gives us the handy ability to use the QR code to store it on our phone. The signing key has been place in the fss file in the /var/log/journal/ e3c7f…db6ab/ directory. That will be rotated every 15 minutes.
Let’s verify the logs with our key to make sure they haven’t been tampered with.
$ sudo journalctl --verify-key 4f5f8f-9eb38b-eff95a-bc0bc8/191914-35a4e900PASS: /var/log/journal/e3c7fd86ed8b4ef69e569a93e30db6ab/system.journalPASS: /var/log/journal/e3c7fd86ed8b4ef69e569a93e30db6ab/user-1005.journal
Journal-Remote
Another way to secure our logs from loss or tampering is to send them to a centralized logging host as quickly as we can. Systemd Journal provides a systemd-journal-remote service that can receive journal messages from other hosts and provide a centralized logging service. This is quite new, and it currently has a few detractors since the TLS service isn’t really secure (doesn’t enforce client certificate verification), but it shows great promise as it matures.
The service can act either passively (wait for journal messages) or actively (pull messages from a remote host). It can be configured to listen over HTTP or HTTPS. We are going to set up one host, gateway.example.com, that will upload logs to our main backup.example.com server.
We are going to use https:// transport for our logs, and we will assume that we have already created the TLS keys required with our CA. We are also using two CentOS hosts in this example, but the configuration should be the same for both CentOS and Ubuntu.
First with CentOS you will need to install the systemd-journal-gateway package. On Ubuntu it is the systemd-journal-remote package. Both packages provide the systemd-journal-gateway, systemd-journal-upload, and systemd-journal-remote services.
The gateway service is an HTTP server that can be used to query journal logs. The remote service is used to receive logs from other servers. The upload, of course, is used to upload logs to a remote server. We are only going to show the upload and remote services here.
We will first set up the remote service that will listen for log messages. To do this, we need to edit the following:
$ sudo vi /etc/systemd/journal-remote.conf[Remote]ServerKeyFile=/etc/pki/tls/private/backup.example.com.keyServerCertificateFile=/etc/pki/tls/certs/backup.example.com.certTrustedCertificateFile=/etc/pki/tls/certs/cacert.pem
This provides the details of the TLS keys and certs we need. The systemd-journal-remote user will need to be able to read the private key file. Next we need to make some additional filesystem changes.
$ sudo mkdir –p /var/log/journal/remote && sudo chown systemd-journal-remote /var/log/journal/remoteBy default the remote journal service will listen on port 19532. We will need to add this to our allowed rules in our firewall.
$ sudo firewall-cmd --permanent --zone public --add-port=19532/tcp$ sudo firewall-cmd --reload
By default the service is configured to listen with https://. This is configurable in the /usr/lib/systemd/system/systemd-journal-remote.service file. Now we can start the remote journal service with the following:
$ sudo systemctl enable systemd-journal-remote$ sudo systemctl start systemd-journal-remote$ sudo systemctl status systemd-journal-remote
We check the status before proceeding to make sure our service has started successfully. The next service we need to configure is on the gateway host. We need to edit the following file:
$ sudo vi /etc/systemd/journal-upload.conf[Upload]URL=https://backup.example.com:19532ServerKeyFile=/etc/pki/tls/private/gateway.example.com.keyServerCertificateFile=/etc/pki/tls/certs/gateway.example.com.certTrustedCertificateFile=/etc/pki/tls/certs/cacert.pem
This is similar to the remote service file with only one significant difference, as you can no doubt see. The URL option points to the backup.example.com host on port 19532. Again, the private key must be readable by the systemd-journal-upload user. We need now to make some similar filesystem changes like we did for the remote service.
First we need to give access to the state file that keeps track of what journals we have sent and give access to the journal logs that are stored in /run/log/journal.
$ sudo chown systemd-journal-upload /var/lib/systemd/journal-upload$ sudo usermod –aG systemd-journal systemd-journal-upload
We are now ready to start our journal uploader.
$ sudo systemctl enable systemd-journal-upload$ sudo systemctl start systemd-journal-upload
We should, very shortly, start seeing logs coming into the /var/log/journal/remote directory on the backup.example.com host.
[jsmith@backup ∼]$ sudo ls -l /var/log/journal/remote/total 16388-rw-r-----. 1 systemd-journal-remote systemd-journal 8388608 Nov 29 22:58 remote-gateway@3a016bda55334bcd88d8a6fa52b1dc61-0000000000000001-0005426ea713ed3c.journal
Now we have our remote host sending logs to our backup server. In the next section we will further explore how to get the journal logs into rsyslog as an alternative.
rsyslogd
Applications output data to the rsyslog daemon with log entries in a special format that the daemon can parse. The daemon then takes the log entries and can perform a variety of actions with them, including writing them out to a file.
You’ve seen a few syslog entries earlier in this book. Let’s look at a few rsyslog lines now:
Nov 30 00:54:25 backup systemd: Stopping System Logging Service...Nov 30 00:54:25 backup systemd: Starting System Logging Service...Nov 30 00:54:28 backup systemd: Started System Logging Service.
An rsyslog entry is constructed of a date, the name of the host that logged the entry (usually the service that emitted it), and the log data itself. Here we’ve shown a restart of the rsyslog service that is first stopped and started and then confirm it is started.
syslog, the predecessor to rsyslog, has been the ubiquitous Unix format for logging. It has been present on all flavors of Linux and indeed on almost all flavors of Unix. You could add it using third-party tools to Windows systems, and most network devices such as firewalls, routers, and switches are capable of generating syslogmessages. This resulted in the syslog format being the closest thing to a universal logging standard that exists. rsyslog is an advancement on syslog, which provides things like TCP (SSL/TLS), extra modules, and reliable event logging protocol (RELP).
Tip
RFC 5424 documents the core rsyslog functionality, and you can read it at https://tools.ietf.org/html/rfc5424 .
The syslog format is used by a variety of tools that vary in function and complexity and are generally all collectively called syslog daemons. These daemons include the basic syslog tool as well as more advanced variants such as syslog-NG (the NG means “next generation”) and rsyslog. rsyslog has benefitted greatly from the work done on syslog and syslog-NG.
We will cover the basic rsyslog tool because it is the default on both CentOS and Ubuntu. It also lays down the groundwork for understanding how logging works on Linux systems.
The rsyslog utility is designed to generate, process, and store meaningful event notification messages that provide the information required for administrators to manage their systems. syslog is both a series of programs and libraries, including rsyslogd, the rsyslog daemon, and a communications protocol.
The most frequently used component of rsyslog is the rsyslogd daemon. This daemon runs on your system from startup and listens for messages from your operating system and applications. It is important to note that the rsyslogd daemon is a passive tool. It merely waits for input from devices or programs. It does not go out and actively gather messages.
The next major feature of the rsyslog tools is the RELP communications protocol. With this protocol it is possible to send your log data across a network to a remote system where another rsyslog daemon can collect and centralize your logs.
Tip
rsyslog traffic is usually transmitted via TCP on port 514.
Configuring rsyslog
The rsyslog daemon is controlled by a configuration file located in /etc called rsyslog.conf. This file contains the information about what devices and programs rsyslogd is listening for, where that information is to be stored, and what actions are to be taken when that information is received.
You can see the default rsyslog.conf configuration file from Ubuntu here:
##################### MODULES #####################module(load="imuxsock") # provides support for local system loggingmodule(load="imklog") # provides kernel logging support#module(load="immark") # provides --MARK-- message capability# provides UDP syslog reception#module(load="imudp")#input(type="imudp" port="514")# provides TCP syslog reception#module(load="imtcp")#input(type="imtcp" port="514")# Enable non-kernel facility klog messages$KLogPermitNonKernelFacility on############################### GLOBAL DIRECTIVES ################################# Use traditional timestamp format.# To enable high precision timestamps , comment out the following line.#$ActionFileDefaultTemplate RSYSLOG_TraditionalFileFormat# Filter duplicated messages$RepeatedMsgReduction on## Set the default permissions for all log files.#$FileOwner syslog$FileGroup adm$FileCreateMode 0640$DirCreateMode 0755$Umask 0022$PrivDropToUser syslog$PrivDropToGroup syslog## Where to place spool and state files#$WorkDirectory /var/spool/rsyslog## Include all config files in /etc/rsyslog.d/#$IncludeConfig /etc/rsyslog.d/*.conf
The first section, as you can see, loads the base modules. We load the imuxsock module (module(load="imuxsock")), which is needed to deliver syslog system calls to rsyslog, and the imklog (module(load="imklog")), which allows for kernel logging. There are many modules that can be loaded, and you can find a list of those that are bundled with rsyslog in the man rsyslog.conf page. You can also install other modules; those will be provided by related packages like rsyslog-mysql, which provides logging support for MySQL .
The Modules section is followed by the Global Directives section. This defines the user, file, and directory modes and other housekeeping. These are rarely edited. In the bottom of the file you will find the IncludeConfig statement that will tell rsyslog to load any file it finds in the rsyslog.d directory that ends with a *.conf.
In the rsyslog.d directory on Ubuntu there is a file that contains some defaults called 50-default.conf; the file contains extra directives. The CentOS rsyslog.conf file is a combination of these two files and is mostly similar.
## First some standard log files. Log by facility.#auth,authpriv.* /var/log/auth.log*.*;auth,authpriv.none -/var/log/syslog#cron.* /var/log/cron.log#daemon.* -/var/log/daemon.logkern.* -/var/log/kern.log#lpr.* -/var/log/lpr.logmail.* -/var/log/mail.log#user.* -/var/log/user.log## Logging for the mail system. Split it up so that# it is easy to write scripts to parse these files.##mail.info -/var/log/mail.info#mail.warn -/var/log/mail.warnmail.err /var/log/mail.err## Logging for INN news system.#news.crit /var/log/news/news.critnews.err /var/log/news/news.errnews.notice -/var/log/news/news.notice## Some "catch-all" log files.##*.=debug;# auth,authpriv.none;# news.none;mail.none -/var/log/debug#*.=info;*.=notice;*.=warn;# auth,authpriv.none;# cron,daemon.none;# mail,news.none -/var/log/messages## Emergencies are sent to everybody logged in.#*.emerg :omusrmsg:*## I like to have messages displayed on the console, but only on a virtual# console I usually leave idle.##daemon,mail.*;# news.=crit;news.=err;news.=notice;# *.=debug;*.=info;# *.=notice;*.=warn /dev/tty8# The named pipe /dev/xconsole is for the `xconsole' utility. To use it,# you must invoke `xconsole' with the `-file' option:## $ xconsole -file /dev/xconsole [...]## NOTE: adjust the list below, or you'll go crazy if you have a reasonably# busy site..#daemon.*;mail.*;news.err;*.=debug;*.=info;*.=notice;*.=warn |/dev/xconsole
As you’ve discovered, both CentOS and Ubuntu store their log files in the /var/log directory but use different file names to store different types of log entries; for example, you saw in Chapter 12 (and you can see in the preceding 50-default.conf configuration file) that Ubuntu stores mail-related rsyslog entries in the mail.log file. On CentOS, however, mail-related rsyslog entries are written to the maillog file. You can check your host’s rsyslog.conf configuration file to determine where the information you want will be written.
Each line in the rsyslog.conf file is structured into two fields: a selector field and an action field. These fields are separated by spaces or a tab. You can see an example of a line in Listing 18-3.
Listing 18-3. rsyslog.conf Syntax
mail.* -/var/log/mail.logThis example shows a selector, mail.*, together with the action /var/log/mail.log. The selector specifies a facility and a priority, separated by a period. Facilities tell you the source of log messages; for example, the mail facility is used for log messages related to mail services such as Postfix. A number of facilities are available, and we’ll look at each in the next section. Each application specifies the facility it will use for its log entries.
The priority (.*) tells rsyslog the importance of the message being sent. A range of priorities are available, and we’ll explain each shortly. Again, applications choose the priority of each message when they send them to rsyslog.
The action tells rsyslogwhat to do with the message; generally this means writing it to a file. In Listing 18-3, all messages from the mail facility with the any priority will be written to the file /var/log/mail.log.
Facilities
The facility identifies the source of the rsyslog message. Some operating system daemons and other common application daemons have standard facilities attached to them. The mail and kern facilities are two good examples, being mail-related event notification messages and all kernel-related messages, respectively.
Other processes and daemons that do not have a specified facility can use the local facilities, which range from local0 to local7. Table 18-1 lists all rsyslog facilities.
Table 18-1. syslog Facilities on Linux
Facility | Purpose |
|---|---|
auth | Security-related messages |
auth-priv | Access control messages |
cron | cron-related messages |
daemon | Daemons and process messages |
kern | Kernel messages |
local0–local7 | Reserved for locally defined messages |
lpr | Spooling (printing) subsystem messages |
Mail-related messages | |
mark | Time-stamped messages generated by rsyslogd (internal use only) |
news | Network news–related messages (for example, Usenet) |
syslog | syslog-related messages |
user | The default facility when no facility is specified |
uucp | UUCP-related messages |
Tip
On CentOS systems, local7 is, by default, used for boot messages, and these are directed to /var/log/boot.log.
Note
The mark facility is a special case. It is used by the time-stamped messages that rsyslogd generates when you use the -m (minutes) flag.
There are also two special facilities: *, a wildcard that indicates all facilities , and none, which negates a facility selection.
You can see the wildcard selector in Listing 18-4.
Listing 18-4. rsyslog.conf * Wildcard Selector
*.emerg :omusrmsg:*This will send all messages of the emerg priority, regardless of facility, to everyone who is logged in.
Tip
The om in omusrmsg stands for output module. These are used for processing messages and transmitting them to different targets; you can see more of them here: www.rsyslog.com/doc/v8-stable/configuration/modules/idx_output.html .
You can use the none wildcard selector to not select messages from a particular facility. The example shown in Listing 18-5 will tell rsyslog to not log any kernel messages to the file/var/log/messages.
Listing 18-5. rsyslog.conf none Wildcard Selector
kern.none /var/log/messagesPriorities
Priorities are organized in an escalating scale of importance. They are debug, info, notice, warning, err, crit, alert, and emerg. Each priority selector applies to the priority stated and all higher priorities, so mail.err indicates all mail facility messages of err, crit, alert, and emerg priorities.
Like with facilities, you can use the wildcard selectors * and none. Additionally, you can use two other modifiers: = and !. The = modifier indicates that only one priority is selected; for example, cron.=crit indicates that only cron facility messages of crit priority are to be selected. The ! modifier has a negative effect; for example, cron.!crit selects all cron facility messages except those of crit or higher priority. You can also combine the two modifiers to create the opposite effect of the = modifier so that cron.!=crit selects all cron facility messages except those of critical priority. Only one priority and one priority wildcard can be listed per selector.
Actions
Actions tell rsyslogd what to do with the event notification messages it receives. Depending on the output modules loaded, rsyslog can perform several potential actions.
Logging to a file
Logging to a device
Logging to a named pipe
Logging to a specific user or the console
Sending logs to another host
Logging to a database table
Executing a command
Discarding
Listing 18-6 shows examples of the first four actions rsyslogd can take, including logging to a file, device file, named pipes, and the console or a user’s screen.
Listing 18-6. File, Device, and Named Pipe Actions
cron.err /var/log/cronauth.!=emerg /dev/lpr1news.=notice |/tmp/pipeauth-priv root,jsmith
In the first line, all cron messages of err priority and higher are logged to the file /var/log/cron.
Note
When logging to files, rsyslogd allows you to add a hyphen (-) to the front of the file name like this: -/var/log/auth. This tells rsyslog to not sync the file after writing to it. This is designed to speed up the process of writing to the log. But it can also mean that if your system crashes between write attempts, you will lose data.
The second line has all auth messages except those of emerg priority being sent to a local printer lpr1.
The third sends all news messages of notice or greater priority to a named pipe called /tmp/pipe.
Note
Sending to a named pipe allows you to send rsyslog data to other applications; for example, you use named pipes to collect log messages and pass them to a log correlation engine or a database.
The fourth and last line sends all auth-priv messages to the users root and jsmith if they are logged in.
There is one last action you can perform, sending logs to another host, as you can see in Listing 18-7.
Listing 18-7. Logging to a Remote System
mail @backup.example.comIn this example, all mail messages are sent to the host backup.example.com.
To send all logs, we’d use this syntax:
*.* @backup.example.comrsyslog uses UDP port 514 to transmit log messages . This assumes the rsyslog daemon on the remote host has been configured to receive logs and that you have suitable firewall rules in place to receive the log entries. Here’s an example:
$ sudo firewall-cmd --permanent --zone public --add-port=514/udpHere we’ve created a firewall rule that allows the host to receive rsyslog data from the host 192.168.0.254 on UDP port 514. However, since this is UDP, remembering that UDP is a fire-and-forget protocol, there is no guarantee that the server at the other end will receive it.
To get around this and prevent possible message loss, we would use RELP, which is the reliable event logging protocol (see www.rsyslog.com/doc/v8-stable/configuration/modules/omrelp.html ).
*.* :omrelp:backup.example.com:2514Of course, we need to load the module in the module section of our rsyslog.conf file, and we will show how to configure RELP shortly.
Combining Multiple Selectors
You can also combine multiple selectors in your rsyslog.conf file, allowing for more sophisticated selections and filtering. For example, you can list multiple facilities separated by commas in a selector (see Listing 18-8).
Listing 18-8. Multiple Facilities
auth,auth-priv.crit /var/log/authThis sends all auth messages and all auth-priv messages with a priority of crit or higher to the file /var/log/auth.
You cannot do this with priorities, though. If you want to list multiple priorities, you need to list multiple selectors separated by semicolons, as shown in Listing 18-9.
Listing 18-9. Multiple Priorities
auth;auth-priv.debug;auth-priv.!=emerg /var/log/authThis example shows you how to send all auth messages and all auth-priv messages with a priority of debug or higher, excluding auth-priv messages of emerg priority to the file /var/log/auth.
Tip
Just remember with multiple selectors that filtering works from left to right; rsyslogd will process the line starting from the selectors on the left and moving to the right of each succeeding selector. With this in mind, place the broader filters at the left, and narrow the filtering criteria as you move to the right.
You can also use multiple lines to send messages to more than one location, as shown in Listing 18-10.
Listing 18-10. Logging to Multiple Places
auth /var/log/authauth.crit jsmithauth.emerg /dev/console
Here all auth messages are logged to /var/log/auth as previously, but auth messages of crit or higher priority are also sent to user jsmith, if he is logged in. Those of emerg priority are also sent to the console.
It is also common to use the omfwd output module, which allows you to send logs to a remote server via TCP or UDP. If we wanted to send log messages to a local file and to a remote server, we could use something like this:
mail.* action(type="omfile" sync="no" file="/var/log/maillog”)action(type="omfwd" Target="monitor.example.com" Port="10514" Protocol="tcp")
You can read more about this module at www.rsyslog.com/doc/v8-stable/configuration/modules/omfwd.html .
Configuring RELP
RELP allows us to set up central logging servers that can collect and store logs from any number of client servers. RELP is more mature than the remote logging of Journald and has been battle tested by thousands of installations. It is also fairly simple to configure, and the modules can be installed with package management.
$ sudo yum install –y rsyslog-relp rsyslog-gnutls$ sudo aptitude install –y rsyslog-relp rsyslog-gnutls
We will need to configure the client and server. RELP allows you to relay logs from clients to servers that can push logs onto other servers. We will use TLS to encrypt our log traffic and avoid rouge clients from connecting and potentially sending bogus log traffic or staging DoS attacks, which is possible with the plain UDP/TCP modules.
On Ubuntu the syslog user runs the rsyslogd service. Therefore, you will need to make sure that the syslog user can read the TLS private keys. You can use the setfacl command for this:
$ sudo setfacl -m u:syslog:rx /etc/ssl/private$ sudo setfacl -m u:syslog:r /etc/ssl/private/nfs.example.com.key
The root user runs the rsyslogd service on CentOS and does not need changing.
Configuring RELP Client
We will start with the RELP client configuration. We will assume that the hosts already have a TLS key and public certificate that has been signed by our private CA. We will again use the gateway host, and it will connect and send its logs to the backup.example.com host.
$ sudo vi /etc/rsyslog.d/relp.conf# make gtls driver the default$DefaultNetstreamDriver gtls# certificate files$DefaultNetstreamDriverCAFile /etc/pki/tls/certs/cacert.pem$DefaultNetstreamDriverCertFile /etc/pki/tls/certs/gateway.example.com.cert$DefaultNetstreamDriverKeyFile /etc/pki/tls/private/gateway.example.com.key$ActionSendStreamDriverAuthMode x509/name$ActionSendStreamDriverPermittedPeer backup.example.com$ActionSendStreamDriverMode 1*.* @@backup.example.com:6514
We have created a file called relp.conf and have configured it to use an encrypted transport between the client and the backup.example.com host. We do this via a NetStreamDriver called gtls, which implements our TLS transport (GnuTLS). A NetStreamDriver can provide sequenced delivery, authentication, and secure transport.
We need to provide our TLS certificate files, and they are described as shown previously. Remember that on Ubuntu the TLS files will have a different path.
We handle authentications via our certificate names (x509/name). That means we verify our connection to our peer by testing their common name in their TLS certificate. If it matches the peer backup.example.com, then we will permit the connection; if not, we will fail it. The mode 1 signifies that we will use TLS.
The last line says that we will ship all facilities and priorities (*.*) to backup.example.com on port 6514. You will now restart the rsyslog daemon .
$ sudo systemctl restart rsyslogConfiguring RELP Server
Now we can configure our RELP server. This is going to collect our logs from our network and store them. The configuration is similar to the client, and our backup host looks like this:
$ sudo vi /etc/rsyslog.d/relp.conf$ModLoad imtcp$DefaultNetstreamDriver gtls$DefaultNetstreamDriverCAFile /etc/pki/tls/certs/cacert.pem$DefaultNetstreamDriverCertFile /etc/pki/tls/certs/backup.example.com.cert$DefaultNetstreamDriverKeyFile /etc/pki/tls/private/backup.example.com.key$InputTCPServerStreamDriverAuthMode x509/name$InputTCPServerStreamDriverPermittedPeer *.example.com$InputTCPServerStreamDriverMode 1$InputTCPServerRun 6514
First we will need to load our imtcp module, which will provide TCP connections. Then we have the same configuration options as we had in the client for our TLS keys except we change the names. We accept all peers that are signed by our CA with example.com in their common name. The last line tells rsyslogd to run a TCP server on port 6514.
Now we will need to make sure that port 6514 is open on our backup server, which is a CentOS server, so we use the firewall-cmd command.
$ sudo firewall-cmd --permanent --zone public --add-port=6514/tcp$ sudo firewall-cmd --reload
Then we restart the rsyslog daemon on the backup server too.
$ sudo systemctl restart rsyslogOn the backup server we can now inspect our /var/log/messages file, and we should see logs similar to these:
Dec 1 12:01:17 gateway chronyd[608]: Selected source 27.124.125.250Dec 1 12:01:19 gateway chronyd[608]: Selected source 27.124.125.250Dec 1 12:01:21 backup systemd: Starting user-0.slice.Dec 1 12:01:01 backup systemd: Started Session 143 of user root.Dec 1 12:05:51 gateway chronyd[608]: Selected source 202.127.210.37Dec 1 12:08:22 dc1 systemd[1]: Started CUPS Scheduler.
The logs are coming in with the timestamp, hostname, service, and message being written. There we can see that the host gateway, the host dc1 and the backup server are all now logging to our backup server .
Starting and Stopping rsyslog
The rsyslogd daemon is usually started when your system boots up. You can manually start and stop the rsyslog daemon with the systemctl command.
$ sudo systemctl start rsyslog$ sudo systemctl stop rsyslog$ sudo systemctl status rsyslog
On both CentOS and Ubuntu, you can customize rsyslogd’s options using the /etc/sysconfig/rsyslog and /etc/default/rsyslogd files, respectively.
When setting up your host, it is important to note the following. If your logs are located in the root partition, your system can potentially crash. To reduce the risk of this potential crash, we recommend you store your logs on a nonroot (non-/) partition. This means that even if all the space on your disk is consumed, the system will not crash.
Testing Logging with logger
Present on both CentOS and Ubuntu, logger is a useful command-line tool to test your logging configuration.
$ logger -p mail.info "This is a test message for facility mail and priority info"This would write the message “This is a test message for facility mail and priority info” to your rsyslog daemon and into whatever destination you have configured for messages with a facility of mail and a priority of info.
As you can see, the -p parameter allows you to specify a facility and priority combination, and then the test message is contained in quotation marks.
We often use logger inside bash scripts to generate multiple messages for testing purposes. The script in Listing 18-11 generates an rsyslog message for every facility and priority combination.
Listing 18-11. Log Testing bash Script
#!/bin/bashfor f in{auth,authpriv,cron,daemon,kern,lpr,mail,mark,news,rsyslog,user,uucp,local0,local1,local2,local3,local4,local5,local6,local7}dofor p in {debug,info,notice,warning,err,crit,alert,emerg}dologger -p $f.$p "Test rsyslog messages from facility $f with priority $p"donedoneexit 0
You can also use logger to pipe a growing file into rsyslog.
$ tail -f /tmp/logfile | logger -p daemon.infoHere we’ve tailed the file /tmp/logfile into the logger command . Each line in the file would be written to the daemon facility with a priority of info.
Log Management and Rotation
An important part of managing your logging environment is controlling the volume of your log files and keeping your log files to a manageable size. To do this, you can rotate your logs.
Log rotationis the process of periodically copying the log file and usually adding a suffix like the date or an incrementing number. The rsyslog daemon then logs to a new file. You would usually keep rotated log files for a fixed period, for example, a week or a month.
Let’s look at an example. We’ve got the /var/log/mail.log file. We could rotate this file daily and keep the rotated files for seven days. The log rotation process would kick off at a time we specified, copy the existing mail.log file to mail.log.1, for example, and then create an empty mail.log file. The log rotation process would also increment; if a mail.log.1 file existed, this file would be renamed to mail.log.2, and so on. If there were a mail.log.7 file, this file would be deleted, and the mail.log.6 file incremented to mail.log.7.
Log rotation can be quite complicated to manually manage, so we recommend you use the logrotate tool. Both CentOS and Ubuntu come with the logrotate tool, and it is usually installed and configured for you already. The default configuration handles most typical log files from applications installed on the host.
The logrotate command is simple to configure and relies on crontab to run on a scheduled basis. The base logrotate configuration is located in /etc/logrotate.conf, and you can see a typical file in Listing 18-12.
Listing 18-12. logrotate.conf
weeklyrotate 4createdateextinclude /etc/logrotate.d/var/log/wtmp {monthlycreate 0664 root utmpminsize 1Mrotate 1}/var/log/btmp {missingokmonthlycreate 0600 root utmprotate 1}
This simple file contains the global options that logrotate uses to handle log files. In this example, we have removed empty lines and comments. All logs files rotate weekly, logs are rotated four times before they are deleted, new log files are created, rotated files have a date extension added to them, and the logrotate tool checks the logrotate.d directory for any new logrotate files. You can use other options, some of which are shown in Table 18-2. You can delve into the logrotate man file for other options.
Table 18-2. logrotate.conf Options
Option | Description |
|---|---|
daily | Logs are rotated on a daily basis. |
weekly | Logs are rotated on a weekly basis. |
monthly | Logs are rotated on a monthly basis. |
compress | Old log files are compressed with gzip. |
create mode owner group | New log files are created with a mode in octal form of 0700 and the owner and group (the opposite is nocreate). |
ifempty | The log file is rotated even if it is empty. |
include directory or filename | The contents of the listed file and directory to be processed by logrotate. |
are included. | |
mail address | When a log is rotated out of existence, it is mailed to address. |
nomail | The last log is not mailed to any address. |
missingok | If the log file is missing, it is skipped and logrotate moves on to the next without issuing an error message. |
nomissingok | If the log file is missing, an error message is issued (the default behavior). |
rotate count | The log files are rotated count times before they are removed. If count is 0, old log files are removed, not rotated. |
size size[M,k] | Log files are rotated when they get bigger than the maximum size; M indicates size in megabytes, and k indicates size in kilobytes. |
sharedscripts | Prescripts and postscripts can be run for each log file being rotated. If a log file definition consists of a collection of log files (for example, /var/ log/samba/*) and sharedscripts is set, then the pre-script/post-scripts are run only once. The opposite is nosharedscripts. |
Listing 18-12 shows the last command, include, which principally drives logrotate. The logrotate.d directory included in Listing 18-12 holds a collection of files that tell logrotate how to handle your various log files.
You can also define additional directories and files and include them in the logrotate.conf file to suit your environment. Most distributions, however, use the logrotate.d directory and come with a number of predefined files in this directory to handle common log rotations such as mail, cron, and rsyslog messages. We recommend you add any new log rotation files here.
Note
Many packages will also add log rotation files to this directory when installed.
Listing 18-13 shows you one of these files.
Listing 18-13. CentOS rsyslog logrotate File
/var/log/messages /var/log/secure /var/log/maillog /var/log/spooler/var/log/boot.log /var/log/cron{dailyrotate 7sharedscriptspostrotate/bin/kill -HUP 'cat /var/run/rsyslogd.pid 2> /dev/null' 2> /dev/null || trueendscript}
Inside these files you can override most of the global options in logrotate.conf to customize your log rotation for individual files or directories. Listing 18-13 first lists all the files to be rotated. This could also include directories using the syntax /path/to/log/files/*.
Then enclosed in { } are any options for this particular set of files. In this example, we have overridden the global logging options to rotate these files on a daily basis and keep seven rotations of the log files.
Next, we run a script. You can run scripts using the prerotate command , which runs the script prior to rotating any logs, or using postrotate, which runs the script after rotating the log file (or log files).
Listing 18-13 shows a script that restarts the rsyslog daemon after the log file (or log files) has been rotated. As the option sharedscripts is enabled, the script will be run only once no matter how many individual log files are rotated. The script statement is terminated with the endscript option.
So, how does logrotate run? By default on both CentOS and Ubuntu, cron runs logrotate at scheduled times (through a script /etc/cron.daily; it is executed by Anacron). You can also manually run it on the command line.
If running on the command line, logrotate defaults to a configuration file of /etc/logrotate.conf. You can override this configuration file, as you can see on the following line:
$ sudo logrotate /etc/logrotate2.confThe logrotate command also has several command-line options to use, as shown in Table 18-3.
Table 18-3. logrotate Command-Line Options
Option | Description |
|---|---|
-d | Debug mode in which no changes will be made to log files; it will output the results of what it may have rotated. Implies verbose mode also. |
-v | Verbose mode. |
-f | Forces a log rotation even if not required. |
By default on most systems, logrotate is run on a daily basis by cron, and this is the model we recommend you use.
Log Analysis and Correlation
Now that you have all of these log files, what can you do with them? Well, logs are useful for two purposes.
To identify when something has gone wrong
To help diagnose the problem when something has gone wrong
To achieve the first objective, you need a tool that will identify particular log messages and alert you to their presence. This process is called log analysis and correlation, and it is often considered a black art. The good news is we’re going to introduce you to a tool called Logstash.
Logstash is going to feed all our logs into a distributed search and analytics tools called Elasticsearch . From there we can view the log data we collect with an interface called Kibana . This will help make log analysis and correlation a simple part of your daily monitoring routine.
The first thing to remember is that analysis and correlation are two very different things. Analysis is the study of constituent parts and their interrelationships in making up a whole. As a system administer, the best analysis tool available is you. System administrators learn the patterns of their hosts’ operations and can often detect a problem far sooner than automated monitoring or alerting systems have done on the same problem.
There are two problems with this model, though. The first is that you cannot be everywhere at once. The second is that the growing volume of the data collected by the systems can become overwhelming.
This is where correlation comes in. Correlationis best defined as the act of detecting relationships between data. You set up tools to collect your data, filter the “wheat from the chaff,” and then correlate that remaining data to put the right pieces of information in front of you so you can provide an accurate analysis.
Properly set up and managed tools can sort through the constant stream of data from the daily operations of your hosts. They can detect the relationships between that data and either put those pieces together into a coherent whole or provide you with the right pieces to allow you to put that analysis together for yourself.
But you have to ensure those tools are the right tools and are configured to look for the right things so you can rely on them to tell you that something is wrong and that you need to intervene.
The first stage of building such an automated log-monitoring system is to make sure you are collecting the right things and putting them in the right place. Make lists of all your applications, devices, and hosts and where they log. The second stage is bringing together all that information and working out what you really want to know. Make lists of the critical messages that are important to you and your hosts.
Group those lists into priority listings; some messages you may want to be paged for, others can go via e-mail, and some may trigger automated processes or generate attempts at self-recovery such as restarting a process.
The third stage is implementing your log correlation and analysis, including configuring your correlation tools and designing the required responses. Make sure you carefully document each message, the response to the message, and any special information that relates to this message.
Introducing Beats and Logstash
We looked at how the system write logs and manages them; now we want to take a look at the next level of logging, namely, shipping and transforming those logs into useful information. Logstash and Beats help us move the log information off our hosts and process them ready for storage so that we can use discovery tools to see analysis of what is happening on our systems. The storage and discovery are handled by Elasticsearch and Kibana, and we will look those in the next section.
Beats are lightweight forwarders of logs, metrics, network packets data, and Windows events. Lightweight means that they do nothing other than ship data to a remote location, keeping track of what they have shipped. We will look at Filebeat, which will ship our logs to Logstash.
Logstash is a tool that can transform logs (or other data such as metrics and so on) into data that can be indexed and tagged and then stored (or shipped again) to make discovery of that data easier. Logstash can ingest a wide variety of inputs and has a wide variety of outputs, one of those being the ability to write to Elasticsearch.
Logstash has a good selection of plug-ins that can help parse, filter, and transform your data, or you can write your own. Plug-ins are written in Ruby, and you can create input, codec, filter, and output plug-ins to suit your needs if you cannot find any existing plug-ins.
Input plug-ins , as the name suggests, handles the ingestion of data into Logstash. Codec plug-ins are used to change the data representation of an event or stream filter. Filters allow for processing of events before sending to the output (dropping events on certain conditions, anonymize data, and so on). Outputs write the outputs of the Logstash processing to a stash or some kind of storage like Elasticsearch. Other outputs could be S3 or Graphite. The combination of input, codec, filter, and output creates a pipeline.
For a deeper discussion into how Logstash works, see here:
Installing and Configuring Beats
Let’s take a look now at the first step of the path of our logs. With Beats, particularly Filebeat, we are going to gather data from our host and ship it to a Logstash server. In this scenario, the Filebeat will run on our gateway host and send its data to our monitor server. The monitor server we talked about in Chapter 17 had our Graphite service set up and was used to store the metrics we collected from our hosts via Collectd.
For simplicity we are going to run the Logstash service and Elasticsearch on our monitor host. In a real-world scenario you would have at least three Elasticsearch nodes in a cluster, depending on the amount of transforming and data collection, and you may have a few tiers of Logtash services that would run on one or two other separate nodes.
On the gateway node, we will install Filebeat. We can download Filebeat from https://www.elastic.co/downloads/beats/filebeat , and we can choose the most appropriate package format (RPM, DEB, tar.gz). The gateway host happens to be a CentOS host, so we will install an RPM version.
$ sudo yum install -y https://artifacts.elastic.co/downloads/beats/filebeat/filebeat-5.0.2-x86_64.rpmTip
You can also set up the APT or YUM repositories on your machines too; see here for details: https://www.elastic.co/guide/en/beats/libbeat/current/setup-repositories.html .
For both Ubuntu and CentOS, the configuration file for Filebeat is stored in /etc/filebeat/filebeat.yml. We are going to send all our logs from /var/log to our Logstash server that will be on the monitor server. We do that with the configuration shown in Listing 18-14.
Listing 18-14. Filebeat.yml
filebeat.prospectors:- input_type: logpaths:- /var/log/messages- /var/log/*.log- /var/log/audit/audit.logtags: ["security", "network"]fields:env: productionoutput.logstash:hosts: ["monitor.example.com:5044"]ssl.certificate_authorities: ["/etc/pki/tls/certs/cacert.pem"]ssl.certificate: "/etc/pki/tls/certs/gateway.example.com.cert"ssl.key: "/etc/pki/tls/private/gateway.example.com.key"
It is common to send data to a local Logstash service instead of a remote one as we have done here. This way you can locally transform the data prior to sending across the network. You may want to do this if you require only anonymized data to traverse the network, or you may want to use the distributed processing power of your hosts rather than relying on a centralized Logstash service to transform your data.
The format of Filebeat configuration file is YAML (see the “YAML Format” sidebar for more information). In Listing 18-14 the first line declares our filebeat.prospectors. You can have different types of input, and the prospectors file is where you declare them. In Listing 18-14 you can see we declare an input_type value of log. The other alternative is an input type of stdin. We can then list the paths that we want to ingest our logs from. Of course, we would like to gather logs from /var/log/messages. You can use globs to catch all logs (/var/log/*.log), or you can target specific logs (/var/log/audit/audit.log). Here we are capturing any in the /var/log directory (excluding any .gz or -20161131 rotated logs), and we are not capturing anything in /var/log/*/*.log except for those we have specified (audit.log).
If we wanted a different to capture our Apache logs, we would do that separately like this:
- input_type: logpaths:- /var/log/*.log- input_type: logpaths:- /var/log/apache/httpd-*.logdocument_type: apache
We don’t run an Apache server on our gateway, but here you can see that we would target the Apache logs as a different input type, and we would apply a document_type of apache. This changes the event type field, one of the metadata tags we apply to our logs, to apache instead of log. This helps us with transformations further down the processing chain.
In Listing 18-14 you will also see that there are global directives we apply to all our data. We tag our data with security and network, and we give it an environment tag of production. This again adds richness to the data we can later use to extract and transform and filter our data.
Our output is going to our Logstash server on the monitor.example.com host. We are going to use TLS-encrypted transport to send our data. We are not anonymizing our logs here, so anything that is sent to the monitoring host can be read in clear text, making us vulnerable to snooping. Encrypting the data prevents this.
There are more configuration options that you can use on your Filebeat prospectors. You can include or exclude specific lines, exclude files, add specific tags, add specific fields, and add multiline pattern matching. You can read more about these here:
We will not start our Filebeat service straightaway, but you can start and stop it using systemctl as you would normally.
$ sudo systemctl enable filebeat$ sudo systemctl start filebeat
Before we start our Filebeat service, we will configure our Logstash service to accept the logs.
Installing and Configuring Logstash
Logstash is a Java process that is used to transform data prior to “stashing” the output in some kind of storage for further analysis or viewing. It is very powerful, and you can do a lot with it. This chapter will not do it justice as we are only able to show the barest essentials of its power. In this section we are going to show you how to install and then do a basic configuration so that we can output our log data to Elasticsearch.
The current version of Logstash requires Java 8. We are going to be installing this service on our Ubuntu monitoring host via the APT repository provided at https://www.elastic.co , a company that helps design and support the open source projects of Kibana, Elasticsearch, Logstash, and Beats.
Let’s first add the APT repository by first adding the public GPG key, then adding the package apt-transport-https (if it is not already installed), and finally adding the actual repository to APT.
wget -qO - https://artifacts.elastic.co/GPG-KEY-elasticsearch | sudo apt-key add -sudo aptitude install –y apt-transport-httpsecho "deb https://artifacts.elastic.co/packages/5.x/apt stable main" | sudo tee -a /etc/apt/sources.list.d/elastic-5.x.listsudo aptitude update
Here we have used the aptitude package manager, which we have installed rather than apt-get, which you can also use. Now we can install Logstash.
$ sudo aptitude install –y logstashFor CentOS and the latest installation notes, you can see the instructions here:
The configuration files for Logstash are kept in /etc/logstash. Mostly you do not need to change any configuration on how the service starts, but if you want, you can do so with the /etc/logstash/startup.options file. That file contains the user that runs the service, the JAVA_OPTS you may like to include, and so on.
We are now going to create a pipeline for processing our logs. We can do this in two ways. We can edit and add to the /etc/logstash/logstash.yml file, which is the main pipeline configuration file, or we can create a file in /etc/logstash/conf.d/, which will be read in by the Logstash service. Let’s see how we can collect our log file from the gateway host and any other Beats service.
$ sudo vi /etc/logstash/conf.d/general.confinput {beats {port => 5044ssl => truessl_certificate => “/etc/ssl/certs/monitor.example.com.cert”ssl_key => “/etc/ssl/private/monitor.example.com.key”ssl_certificate_authorities [ “/etc/ssl/certs/cacert.pem” ]ssl_verify_mode => force_peer}}output {stdout { codec => rubydebug }}
Taking a look at this file, you can see that it is made of two sections: an input and an output. Typically you will see three sections including a filter section.
Input {...}filter {...}output {...}
Those of you familiar with Ruby will recognize this as Ruby hash syntax . JRuby, for Java Ruby, is used with Logstash, and the configuration files are in native Ruby syntax .
In our input section, we have included our beats plug-in, and the beats plug-in accepts the port and SSL configuration options like earlier. This should already be familiar to you, but the important thing to note is that here we are specifying a ssl_verify_mode value of force_peer. This means that if the client does not provide the server with a certificate, we will drop the connection immediately. This will make our system more secure and drop unauthorized connections early.
The output section describes where we will send the data after we have processed it. We can see that we will output the data to stdout, and to help us debug that output, we will use a codec called rubydebug. This is good for viewing what Logstash is doing while we begin our journey. We will also specify elasticsearch as an output, but we don’t want to do so at this stage.
We are ready to start our Logstash service and start seeing how it works. We do that via the following command:
$ sudo -u logstash /usr/share/logstash/bin/logstash -f /etc/logstash/conf.d/general.confWARNING: Could not find logstash.yml which is typically located in $LS_HOME/config or /etc/logstash. You can specify the path using --path.settings. Continuing using the defaultsCould not find log4j2 configuration at path /usr/share/logstash/config/log4j2.properties. Using default config which logs to console04:20:40.036 [[main]-pipeline-manager] INFO logstash.inputs.beats - Beats inputs: Starting input listener {:address=>"0.0.0.0:5044"}04:20:40.072 [[main]-pipeline-manager] INFO logstash.pipeline - Starting pipeline {"id"=>"main", "pipeline.workers"=>2, "pipeline.batch.size"=>125, "pipeline.batch.delay"=>5, "pipeline.max_inflight"=>250}04:20:40.075 [[main]-pipeline-manager] INFO logstash.pipeline - Pipeline main started04:20:40.087 [[main]<beats] INFO org.logstash.beats.Server - Starting server on port: 504404:20:40.134 [Api Webserver] INFO logstash.agent - Successfully started Logstash API endpoint {:port=>9600}
In the first section we will see the startup output giving us details on what is being started with what parameters. You will see that we are starting the Beats input on port 5044, the main pipeline, and a web API on port 9600.
Now, on the gateway host we can start our filebeat service. We do that with the systemctl command like so, and then we can tail the logs that are produced by the service.
$ sudo systemctl start filebeat && tail –f /var/log/filebeat/filebeatNow on the monitor host , we can start the logstash service, and we should see a rapid amount of data coming in from our Filebeat on the gateway server.
In Listing 18-15 we see the one of the captured log messages from the gateway host. Each Beat is given its own timestamp, and we are given a bunch of other related metadata like input_type, the host it can from, tags we have associated with the Beat, and so on. Each of these Beats will have a host, a source, and a message. The message will have the rsyslog format we have already seen.
Listing 18-15. Beat from Gateway Server Logs
{"@timestamp" => 2016-12-04T06:33:33.868Z,"offset" => 11979,"@version" => "1","input_type" => "log","beat" => {"hostname" => "gateway.example.com","name" => "gateway.example.com","version" => "5.0.2"},"host" => "gateway.example.com","source" => "/var/log/messages","message" => "Dec 4 06:33:24 gateway jsmith: tesing this is a test","fields" => {"env" => "production"},"type" => "log","tags" => [[0] "security",[1] "network",[2] "beats_input_codec_plain_applied"]}
Let’s briefly take a look at the audit log we are collecting too:
"host" => "gateway.example.com","source" => "/var/log/audit/audit.log","message" => "type=SERVICE_STOP msg=audit(1480834167.796:997): pid=1 uid=0 auid=4294967295 ses=4294967295 subj=system_u:system_r:init_t:s0 msg='unit=NetworkManager-dispatcher comm="systemd" exe="/usr/lib/systemd/systemd" hostname=? addr=? terminal=? res=success'","type" => "log",
Immediately you will notice that audit.log is not is the same format as your normal rsyslog. The auditd file is a set of key/value pairs (key=value). They can appear very different from what we see here, but basically they consist of a type and a message (which includes a timestamp and unique ID). Then, depending on the type, they can have any number of other keys and values. In this example we have stopped the openvpn service, and this is the resultant log notification.
This is not in the format that we would like and is not like an rsyslog message. Let’s change that so that we record this as a different type of event. To do that, we will edit the Filebeat configuration on the gateway host and change the following:
filebeat.prospectors:- input_type: logpaths:- /var/log/messages- /var/log/*.log- input_type: logpaths:- /var/log/audit/audit.logdocument_type: auditd
We have moved the audit.log into its own input_type section. To that section we have added the document_type option and set it to auditd. Now let’s show you what that does; go ahead and reload the Filebeat service .
"host" => "gateway.example.com","source" => "/var/log/audit/audit.log","message" => "type=SERVICE_STOP msg=...terminal=? res=success'","fields" => {"env" => "production"},"type" => "auditd",
Now when we get the same message from stopping the openvpn service on the gateway host, the type is set to auditd. We can now use this in our filter section to make the audit log easier to further process.
Logstash Filters
Logstash filters are a way of parsing and transforming data to make it easier to discover what’s in your logs. We are going to take our auditd log and extract information and add it to our event data.
When we look at a raw audit.log file, we see information like this:
type=SERVICE_STOP msg=audit(1480844911.323:1080): pid=1 uid=0 auid=4294967295 ses=4294967295 subj=system_u:system_r:init_t:s0 msg='unit=openvpn@gateway comm="systemd" exe="/usr/lib/systemd/systemd" hostname=? addr=? terminal=? res=success'These are key=value logs. You can see type=SERVICE_STOP, uid=0, and msg='...' are all key/value pairs. Logstash can understand how to deal with key=values. We do this by telling the filter to take each key and value and assign it. You can also see that there we have an audit(1480844911.323:1080), which is the timestamp (1480844911.323, in Unix epoch time) plus a unique ID (1080) that marks the event.
So, how do we tell Logstash to work on these events? In our Beat configuration we marked audit.logs with the document_type of auditd. We saw that the events coming into Logstash from the Filebeat now have the type auditd attached to them. We can now match this value and work on the logs that specifically have that data. We do that with a conditional if statement in our filter section.
filter {if [type] == "auditd" {# audit.log get matched and worked on here}}
Here we are using a conditional if { ... } statement that matches on the tag [type] if it equals the string "auditd". Now that we are working on the right logs coming through, we can now tell Logstash to create key/value pairs from what it sees. We do this with the following lines:
filter {if [type] =∼ "auditd" {kv { }}}
This simply will create more labels in our metadata on which we can further work on and use for discovery. Let’s take a look at what this does to our Logstash data:
{"msg" => [[0] "audit(1480844911.323:1080):",[1] "unit=openvpn@gateway comm="systemd" exe="/usr/lib/systemd/systemd" hostname=? addr=? terminal=? res=success"],"uid" => "0","ses" => "4294967295","auid" => "4294967295","pid" => "1","source" => "/var/log/audit/audit.log","message" => "type=SERVICE_STOP msg=audit(1480844911.323:1080): pid=1 uid=0 auid=4294967295 ses=4294967295 subj=system_u:system_r:init_t:s0 msg='unit=openvpn@gateway comm="systemd" exe="/usr/lib/systemd/systemd" hostname=? addr=? terminal=? res=success'","type" => "SERVICE_STOP","subj" => "system_u:system_r:init_t:s0""tags" => [[0] "security",[1] "network",[2] "beats_input_codec_plain_applied"],"offset" => 5738705,"input_type" => "log","@timestamp" => 2016-12-04T09:48:31.650Z,"@version" => "1","beat" => {"hostname" => "gateway.example.com","name" => "gateway.example.com","version" => "5.0.2"},"host" => "gateway.example.com","fields" => {"env" => "production"},}
Now you can see that we are adding further texture to our data by labeling it with more usable data. We have ordered the output to be more human readable, but you can see that the first few lines of the output are the key/value pairs from the message contents. We can make it more readable too if we give greater detail to some of those labels. We do this with the mutate and rename functions .
filter {if [type] =∼ "auditd" {kv { }mutate {rename => {"type" => "audit_type""auid" => "audit_uid""fsuid" => "audit_fs_uid""suid" => "audit_set_uid"“subj” => “audit_subject”"ses" => "session_id"“hostname => “audit_hostname”}}}}
Now when we look at our Logstash data, it will look similar to this:
{..."audit_uid" => "4294967295","audit_subject" => "system_u:system_r:init_t:s0","audit_type" => "SERVICE_STOP""session_id" => "4294967295",...}
The mutate function has changed the state of the log information. It has allowed us to take certain fields in the log message and rename them to clearer labels.
Lastly, if we look at the timestamp in the log message it, it doesn’t get extracted. We are going to make sure that the data ends up as a label as well. To do that, we use a function called grok. A grok function is made up of two parts, the syntax and the semantic, and is written like this:
%{SYNTAX:SEMANTIC}The SYNTAX is a name of a pattern that matches your text. There are quite a few that come with Logstash, and you can view them all here:
The patterns are regular expressions that map to a name. The timestamp we are dealing with is in epoch or Unix epoch and is the number of seconds since 1970. Since it is a number, we can use the native Logstash NUMBER pattern to match it.
The SEMANTIC is just the identifier we will give it so that we add greater value to our metadata labels. We will give it audit_epoch.
As we have said, there are two parts to the timestamp audit(1480844911.323:1080): the time and the unique identifier. We will use grokto search for the string containing the epoch and the unique ID and extract them as labels for us.
grok {match => { "msg" => "audit(%{NUMBER:audit_epoch}:%{NUMBER:audit_counter}):" }}
Here we are telling grok to match the msg key and find the audit(<somenumber>:<somenumber): string. For the first match we will give it the name audit_epoch, and for the second we will give it audit_counter. Now when we run our Logstash service again, we will see the following appear:
{..."offset" => 5745528,"audit_epoch" => "1480846476.689","audit_counter" => "1106",...}
We now have our audit log being successfully transformed and adding extra labels to our Logstash data. We can now begin to add that into Elasticsearch.
Elasticsearch for Log Stashing
We have our logs being shipped from our Filebeat , we have the logs going into our Logstash service, and we are transforming some of our logs to be more discoverable after we store them. Let’s now take a look at where we will store our log data, namely, Elasticsearch.
Elasticsearch is an Apache Lucene–based full-text search and analytics engine. (Lucene is a code library and API: http://lucene.apache.org/core/ .) Elasticsearch is great at searching and making sense of text-based data. It has a RESTful API that allows you to query and store data. It is based on a distributed architecture and can store petabytes of searchable data.
Elasticsearch will store our log data from Logstash in an index. An index is a logical namespace for data. With Logstash, by default, we create an index for each day’s log data. An index is made up of documents, which are the equivalent of relational database rows. Each index has a mapping that defines the types in the index and other index settings and describe how the index can be searched. A type is the type of document, like a user or a log, and is used by the API as a filter. The document is a JSON object, and each has a type and an ID. The document is made up of one or more key/value pairs.
Each document is stored in one primary shard and can have zero or more replica shards, which are for redundancy and performance. Shards are distributed among the nodes in the Elasticsearch cluster. When a node goes down, replica shards can be promoted to primary shards, and shards can be redistributed across the cluster.
We are going to install it and configure it on our monitoring host, which is a single node. Depending on how much data you intend to have, you will obviously need to make some decisions about your deployment. For distributed systems, it is always good to deploy in odd numbers, as in 1, 3, 5, 7, and so on. This helps reduce the risk of split-brain events like those we talked about with GlusterFS in Chapter 13.
Elasticsearch Installation and Configuration
Elasticsearch installations require a minimum of 4GB of RAM to run the service and will fail to start without it. The installation is simple once we have the APT repository configured provided by Elastic Co. (the one we configured in the installation of Logstash).
Not surprisingly, the installation is simply using the aptitude package manager:
$ sudo aptitude install –y elasticsearchIn our one server scenario, we do not need much extra configuration. We can start the Elasticsearch service now, and we can start storing our logs in it. However, if we want to create an Elasticsearch cluster, we will need to edit the /etc/elasticsearch/elasticsearch.yml file.
To create an Elasticsearch cluster , you need to supply the cluster name and the node name. Let’s edit the file like so:
cluster.name: monitornode.name: monitor-node-1
Also within the elasticsearch.yml file, we can set the data path where we store data, the log directory, network options, and so on.
For service discovery, or how Elasticsearch finds other nodes in the cluster, Elasticsearch has a Zen Discovery module. The Zen Discovery module is used to discover other cluster nodes, perform master elections, detect faults, and notify of cluster updates. It does this by sending either network pings to nodes or unicast packets that participating hosts can react to.
Since we are not setting up a cluster, we can just start the service now without changing the configuration.
$ sudo systemctl start elasticsearchOf course, we can always use the status subcommand of systemctl to check the status of our Elasticsearch service, but we can also issue the following command from the command line:
$ curl http://localhost:9200{"name" : "7mf_JBi","cluster_name" : "elasticsearch","cluster_uuid" : "69nMGfoYRYiwatKO6Nj1BA","version" : {"number" : "5.0.2","build_hash" : "f6b4951","build_date" : "2016-11-24T10:07:18.101Z","build_snapshot" : false,"lucene_version" : "6.2.1"},"tagline" : "You Know, for Search"}
This curl command to port 9200 shows that our Elasticsearch server is responding. The response is in JSON format. We can query Elasticsearch further with something like this:
curl -H "Content-Type: application/json" "http://localhost:9200/logstash-*/_search" -d '{"query": {"match": {"event_type": "SERVICE_STOP"}},"sort": [ "_doc" ]}'
This curl command now queries the _search URI on Elasticsearch to check whether we have any matches for audit_type "SERVICE_STOP". The –d option for curl allows us to send a data POST, which we send as a JSON-formatted query.
The result of this query can look like this:
{"took":2,"timed_out":false,"_shards": {"total":5,"successful":5,"failed":0},"hits": {"total":74,"max_score":null,"hits":[...the events...]}}
The first section tells us how long it took to run the query and that we successfully queried five shards. In the hits section, we have a total of 74 hits for SERVICE_STOP audit_type. There will be list of events that match printed also. So, now we can see that our Logstash service is sending data in from our gateway server as we expected.
Rather than using curl commands to search your logs, there is another open source tool that can help visualize our logs, Kibana. We will now show you how to install and configure it.
Kibana Installation and Configuration
Kibana has been packaged by Elastic Co. as well and is available from their APT (and YUM) repository. This makes installation again easy for us. As you can guess, installation is as follows:
$ sudo aptitude install –y kibanaThe configuration of Kibana will by default look at localhost:9200 for an Elasticsearch service. The configuration file is located here: /etc/kibana/kibana.yml.
server.port: 5601server.host: "192.168.0.250"elasticsearch.url: "http://localhost:9200"
Here we are setting up our Kibana server with the following settings. We specify the port to listen on, the IP address to listen on, and where it can find the Elasticsearch service. Now we can start the Kibana service.
$ sudo systemctl start kibanaWe can now open a browser to http://192.168.0.250 , and we will be presented with the front page of Kibana.
In Figure 18-2 we are presented with the first page for Kibana. This allows us to configure our index pattern. The default, Logstash-*, makes sense in this instance since we are dealing with indexes with the naming format of Logstash-<date>. We can also set the timestamp field that tells Kibana which field represents the time, but we will leave it as the default. Click Create to continue.

Figure 18-2. Configuring index pattern
Figure 18-3 shows all the fields and their associated types in the Logstash-* index. To change these, you need to use the mappings API. We are not going to change anything here.
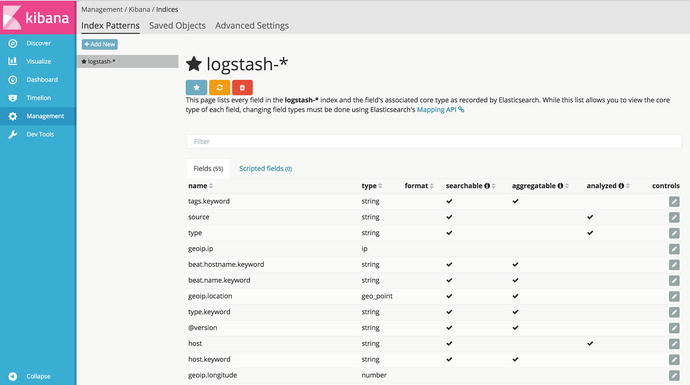
Figure 18-3. Index patterns
Figure 18-4 shows the Advanced Settings tab. We can change things such as the default index, date formats, and default columns. We do not need to change anything here.

Figure 18-4. Advanced Settings tab
The Saved Objects tab in Figure 18-5 shows nothing at the moment. As you create dashboards and visualizations, you will be able to manage them on this tab.

Figure 18-5. Saved Objects tab
Figure 18-6 shows the search interface of Kibana. The default view here is the last 15 minutes of our log events . In the top left we can see how many events we can search over (14,094 hits). Just below that is the search bar where we can enter our search queries. Currently, the * means we are searching (and displaying) all 14,094 events. There is a visual display showing how many events we have for a particular time period. We can change the time period by picking a time period from the drop-down in the top right.
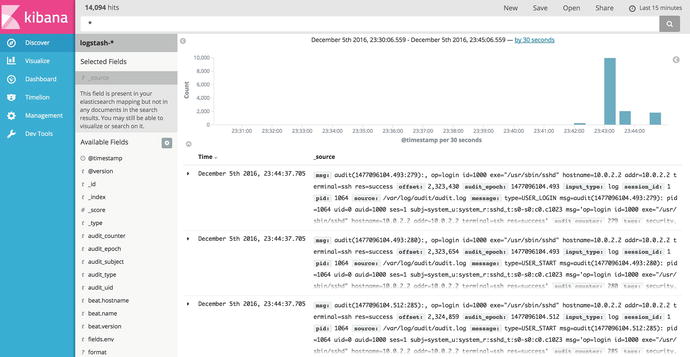
Figure 18-6. All logs for the last 15 minutes
In the middle we have the results that are displayed in date order of the time the event was created. To the left we have all the fields that are available to us to further refine our query and result list. Let’s see how we do that now.
Again, we are going to discover all the logs relating to the SERVICE_STOPaudit event. In Figure 18-7 we can see have used the audit_type field, which is how we labeled it in our Logstash filter. We then specify the value of the field we are looking for in SERVICE_STOP. In the last 30 minutes, we have 3 hits, and they appear in the central panel.
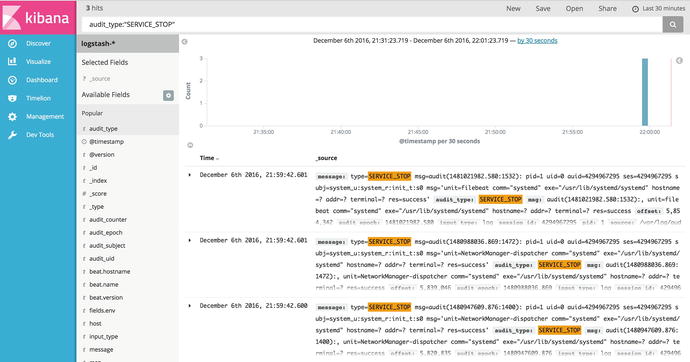
Figure 18-7. Searching for SERVICE_STOP
Further Information
For further information on Beats, Logstash, Elasticsearch, and Kibana, you can see the following:
Monitoring
Once you have all your applications and services running, you need to have some mechanism available to monitor them. This ensures your host lets you know when important events occur, such as when disk space runs out on a host or when a service unexpectedly stops.
In the IT world, this monitoring mechanism is called enterprise monitoring. Like the other applications and tools we’ve introduced you to in this book, a number of open source tools are available that can perform this monitoring.
Hyperic ( www.hyperic.com/ )
M/Monit ( http://mmonit.com/ )
Nagios ( www.nagios.org )
OpenNMS ( www.opennms.org/ )
Zenoss ( http://zenoss.com/ )
Zabbix ( www.zabbix.com/ )
Probably the most well-known of these is Nagios, which we’ll take a closer look at next.
Introducing Nagios-Core
Nagios-Core is a popular GPL-licensed monitoring tool that allows you to monitor infrastructure, applications, and even environmental characteristics such as power and air conditioning. It comes with a simple web console that gives you a visual view of the state of your hosts and services. You can see an example console screen in Figure 18-8.
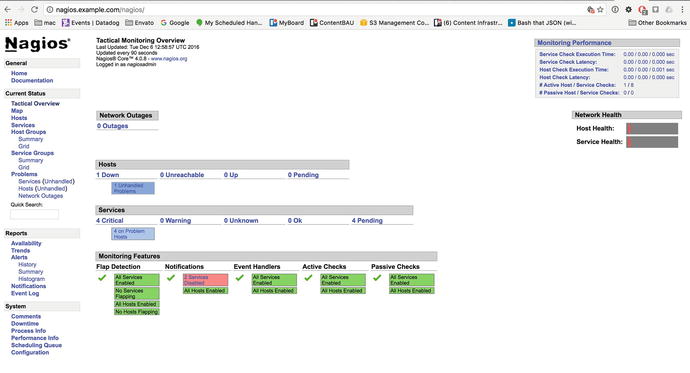
Figure 18-8. An example console
We’re going to introduce you to Nagios-Core and how to use it to monitor your hosts and services. Nagios-Core is an open source version of Nagios that has been around for many years. There is now a commercial version of Nagios available if you require extra features or support. We’re going to show you how to set up some basic monitoring for your host and for some of the services we’ve introduced you to earlier in the book.
For this book, we’ll look at the latest version, version 4, of Nagios—it is packed full of features and functions. Nagios, however, is too complex to explain completely in this single chapter. Luckily, Nagios is very well documented, and you can find the documentation for version 4 at https://assets.nagios.com/downloads/nagioscore/docs/nagioscore/4/en/ . CentOS has version 4 available from the EPEL repository. Ubuntu is still on version 3, but you can download the source code for version 4 from the Nagios web site and compile it.
Nagios is capable of monitoring a wide variety of hosts and services on a number of platforms including Linux, BSD, Solaris, and even Windows (see https://assets.nagios.com/downloads/nagioscore/docs/nagioscore/4/en/monitoring-windows.html for instructions on monitoring on Windows).
Nagios runs as a daemon and monitors the services on your hosts and their state. It can monitor to confirm both that a service is running and that it is performing appropriately. For example, if we were to monitor that a host is active using an ICMP ping (which we discussed in Chapter 7), we could configure it to alert if it can’t contact the host or if responses take longer than a specified time to return.
To do this monitoring, you tell Nagios about your hosts and services by defining them as objects in the Nagios configuration. Each host is defined to Nagios, and then the services that run on that host are defined.
You also tell Nagios how you are going to monitor each host and service by defining commands. Each service uses particular commands to check its status, and each command specifies the binary or script used to check the status of a service.
Note
You will also define commands to send notifications (for example, to generate an e-mail or send a page) when a service check fails.
To make creating commands easier, Nagios comes with a collection of plug-ins, which are binaries designed to check specific services; for example, Nagios has a plug-in called check_icmp that uses IMCP ping requests to confirm a host is active.
Nagios can query services on the localhost as well as remote hosts. This querying is done either directly to the host (for example, connecting to the SMTP server on port 25 and testing you can receive e-mail) or via an agent installed on the host, which returns results to the monitoring host.
In addition to monitoring hosts and services, Nagios has a variety of other useful functions , including the following:
An escalation model allows alerts to be escalated if a host or service does not recover or is not fixed (see https://assets.nagios.com/downloads/nagioscore/docs/nagioscore/4/en/escalations.html ).
You have the ability to specify event handlers that can be triggered when a host or service fails. Event handlers can perform tasks such as restarting services or deleting temporary files in an effort to automatically recover a host or service (see https://assets.nagios.com/downloads/nagioscore/docs/nagioscore/4/en/eventhandlers.html ).
You can specify parent-child relationships and dependencies between hosts and services; for example, if a router is down, you can indicate you don’t want Nagios to bother to check hosts behind that router because they won’t be contactable (see https://assets.nagios.com/downloads/nagioscore/docs/nagioscore/4/en/dependencies.html ).
You can design a distributed monitoring environment where there are redundant monitoring servers or where checks are distributed over multiple sites or locations (see https://assets.nagios.com/downloads/nagioscore/docs/nagioscore/4/en/distributed.html and https://assets.nagios.com/downloads/nagioscore/docs/nagioscore/4/en/redundancy.html ).
Installing Nagios
Nagios is easy to install, and packages are available for both CentOS and Ubuntu.
Installing Nagios on CentOS
On CentOS , we can install our Nagios package with the following:
$ sudo yum install nagios nagios-plugins nagios-plugins-ssh nagios-plugins-smtp nagios-plugins-baculanagios-plugins-disk nagios-plugins-fping nagios-plugins-http nagios-plugins-ldap nagios-plugins-mysql
We have chosen a selection of plug-ins to install as well. While we won’t show you how to use each plug-in, you can see that there are plug-ins available for most of the services we have shown in this book.
Installing Nagios on Ubuntu
On Ubuntu, the default version of Ubuntu is version 3. If we want to install version 4, we will have to install from source.
$ sudo apt-get install nagios3 nagios-pluginsThis will install Nagios version 3 and all the required supporting packages including the Nagios plug-ins.
If you want to install from source (for either CentOS or Ubuntu, but this is for Ubuntu), you need to do the following.
First we need to create users and groups to run and manage the Nagios service.
$ sudo useradd nagios &&sudo groupadd nagcmd &&sudo usermod -aG nagcmd www-data &&sudo usermod –aG nagcmd nagios
We have added the nagcmd group to the www-data and nagios users so that the web service can read the Nagios results. Now we need to download the source, untar it, and then enter the directory.
$ wget https://assets.nagios.com/downloads/nagioscore/releases/nagios-4.2.3.tar.gz &&tar zxf nagios-4.2.3.tar.gz &&cd nagios-4.2.3/
If you remember when we compiled Nginx in Chapter 8, we will do something similar now to Nagios. We first have to configure any special requirements for our installation, then compile any binaries, and finally install Nagios onto our system.
$ ./configure --with-httpd-conf=/etc/apache2/conf-available--with-nagios-user=nagios--with-nagios-group=nagcmd--sysconfdir=/etc/nagios
Here we have configured our Nagios service to place the Apache configuration into the appropriate place (you may like to choose /etc/apache2/sites-available instead here). We have declared the user and group, and we have placed our --sysconfdir (system configuration directory) in /etc/nagios, which is common in CentOS (in Ubuntu it is normally /etc/nagios<version number>, but we are not choosing that here).
Now we need to compile the source code and then install the various components.
$ sudo make all$ sudo bash -c 'make installmake install-initmake install-configmake install-commandmodemake install-webconf'
The configuration files are installed in /etc/nagios, and the Nagios binary is installed in /usr/local/nagios/bin/nagios. If you want to install the latest plug-ins, you can do so like this:
$ wget https://nagios-plugins.org/download/nagios-plugins-2.1.4.tar.gz &&tar zxf nagios-plugins-2.1.4.tar.gz &&cd nagios-plugins-2.1.4/ &&./configure --with-nagios-user=nagios --with-nagios-group=nagcmd &&make && sudo make install
This will install the plug-ins into the /usr/local/nagios/libexec/ directory. The last thing we need to do is make sure we have a systemd service file to start the service.
$ sudo vi /etc/systemd/system/nagios.service[Unit]Documentation=man:systemd-sysv-generator(8)SourcePath=/etc/init.d/nagiosDescription=LSB: nagios host/service/network monitoring and management systemBefore=multi-user.targetBefore=multi-user.targetBefore=multi-user.targetBefore=graphical.targetBefore=shutdown.targetAfter=local-fs.targetAfter=remote-fs.targetAfter=systemd-journald-dev-log.socketAfter=nss-lookup.targetAfter=network-online.targetAfter=time-sync.targetWants=network-online.targetConflicts=shutdown.target[Service]Type=forkingRestart=noTimeoutSec=5minIgnoreSIGPIPE=noKillMode=processGuessMainPID=noRemainAfterExit=yesExecStart=/etc/init.d/nagios startExecStop=/etc/init.d/nagios stopExecReload=/etc/init.d/nagios reload
Because there is no native systemd service file available for Ubuntu just yet, the Nagios installation will deploy the /etc/init.d/nagios file, and we just have to point this service file at it (we spoke about Ubuntu’s adoption of systemd in Chapter 6 and how it still uses some LSB init files to start services).
Starting Nagios
On both CentOS and Ubuntu, we start and stop Nagios with the systemctl command .
$ sudo systemctl start nagiosThe nagios daemon logs to the /var/log/nagios/nagios.log log file. You can confirm that the daemon has successfully started. If it has not, you will see errors in this file. Or course, you can also use the journalctl and systemctl status commands.
Nagios Configuration
We’re going to quickly walk you through how to configure Nagios. In simple terms, the steps for configuring Nagios are as follows:
Create definitions for the hosts you want to monitor.
Create definitions for the services you want to monitor on your hosts.
Create commands to monitor your services.
Tell Nagios when you want them monitored.
Tell Nagios who should be told if a check fails.
Tell Nagios how people should be informed if a check fails—e-mail, IM, SMS, pager, chatbot, and so on.
Nagios configuration is made up of objects. You define the host you want to monitor as a host object and each service you want to monitor as a service object. A variety of other object types also exist, such as time-period objects for monitoring periods and contact objects to tell Nagios whom to notify when something occurs.
We’re going to show you how to configure your hosts in Nagios and then how to configure a variety of types of services. Along the way, we’ll show you a variety of the other elements in the Nagios configuration.
The Nagios configuration is stored in /etc/nagios on CentOS and, depending how you configured your Ubuntu installation, in /etc/nagios as well. Nagios configuration files are suffixed with .cfg, and the main configuration file for Nagios is called nagios.cfg.
Both CentOS and Ubuntu come with some sample configuration to help you get started with Nagios. On both distributions, the /etc/nagios/objects/localhost.cfg configuration file contains some basic configurations for your localhost and some services on it. Also, in that same directory, you will see a few other configuration examples for printers, Windows hosts, time periods, templates, and switches.
Nagios also has a mode that enables you to check your configuration for errors prior to running the daemon. This is useful to confirm you don’t have any errors.
On CentOS, we would run the following:
$ sudo nagios -v /etc/nagios/nagios.cfgOn Ubuntu, depending if you chose Nagios version 3 or built version 4 like we did earlier, you will find it here:
$ sudo nagios3 -v /etc/nagios3/nagios.cfgor here:
$ sudo /usr/local/nagios/bin/nagios -v /etc/nagios/nagios.cfgThe -v option checks that all configuration is correct and, if so, outputs a statistical report showing the number of configuration objects defined.
Note
After changing Nagios configuration, you need to restart the daemon for the new configuration to be parsed.
The nagios.cfg File
The nagios.cfg configuration file contains the base configuration for your Nagios installation. Each option in this file is in the form of an option-value pair. For example, the location of the Nagios log file is specified using the log_file option; on CentOS, this would be done as follows:
log_file=/var/log/nagios/nagios.logThis is usually the first option in your nagios.cfg file followed by the cfg_file and cfg_dir options that specify the location of your object configuration files. The cfg_file option allows you to specify an individual file that contains the Nagios object configuration. Here’s an example:
# Definitions for monitoring the local (Linux) hostcfg_file=/etc/nagios/objects/localhost.cfg
You can specify multiple files; indeed, many people specify each object type in a separate file to organize them.
cfg_file=/etc/nagios/objects/commands.cfgcfg_file=/etc/nagios/objects/contacts.cfgcfg_file=/etc/nagios/objects/timeperiods.cfgcfg_file=/etc/nagios/objects/templates.cfg...
Note
It’s a good idea to put your files into a version control system (VCS) , like Subversion or Git. Such systems track your files and the changes to them. They are commonly used by programmers to track source code and used more and more by system administrators to track configuration files. In Chapter 3 we showed you how to install Git.
Further in the configuration file you will find the cfg_dir option, which specifies a directory. Nagios will load any file in this directory with a suffix of .cfg. Here’s an example:
cfg_dir=/etc/nagios/conf.dThe nagios.cfg file contains a number of other useful options, some of which you can see in Table 18-4.
Table 18-4. nagios.cfg Configuration File Options
Option | Description |
|---|---|
resource_file | A separate configuration file used to hold system variables such as paths and passwords. |
nagios_user | The user to run Nagios as. This defaults to nagios. |
nagios_group | The group to run Nagios as. This defaults to nagios. |
log_rotation_method | When to rotate logs. Values are n for no rotation, h for hourly, d for daily, w for weekly, and m for monthly. |
log_archive_path | The directory to store archived, rotated log files. |
use_syslog | Whether to log Nagios output to syslog (rsyslog). This defaults to 1 for syslog logging. Set to 0 for no syslog logging. |
You can also turn on and off checking of hosts and services and the sending of alerts at a global level on the nagios.cfg configuration file. For a full list of the available options, see https://assets.nagios.com/downloads/nagioscore/docs/nagioscore/4/en/configmain.html .
Host Configuration
Let’s start examining Nagios’s configuration by opening CentOS’s /etc/nagios/objects/localhost.cfg configuration file and looking at its contents, starting with a host object definition.
Note
We’ve included both the CentOS and Ubuntu sample configuration files with the source code for this chapter.
We’re going to start with the host object definition in the file that you can see in Listing 18-16.
Listing 18-16. A Host Object
define host {use linux-server ; Name of host template to use; This host definition will inherit all variables that are defined; in (or inherited by) the linux-server host template definition.host_name localhostalias localhostaddress 127.0.0.1}
You can see that an object definition starts with define, the type of object to define (in our case a host object), and the definition, which is enclosed in the { } curly braces. Inside the definition are the attributes of the object defined by a series of key/value statements, separated by spaces. Our host object definition has four attributes: use, host_name, alias, and address.
Tip
Some attributes are mandatory for certain object definitions, meaning you must specify the attribute and a value for them. In the Nagios documentation, these values are specified in red at https://assets.nagios.com/downloads/nagioscore/docs/nagioscore/4/en/objectdefinitions.html .
The use attribute tells our host object to refer to a template. A template is a technique Nagios uses to populate an object definition with values that might be the same across many objects. For example, host objects will share many of the same attributes and characteristics. Rather than specify every single attribute in each host object definition, you can instead refer to a template. Nagios then creates the host object with all the attributes in the host definition plus those attributes in the template. We’ll look at the additional attributes defined in the linux-server template in Listing 18-17 in a moment.
In this case, the rest of the attributes of our host object define its identity. The host_name attribute defines the name of the host object. This name must be unique. You can have only one host object called localhost or headoffice.example.com. Nagios also makes the host_name attribute available as a macro called $HOSTNAME$.
Note
Macros allow Nagios to embed information about hosts and services in other object definitions, most specifically the commands Nagios uses to check services and send notifications. You’ll see more macros later in this chapter; in the meantime, you can see a full list of these macros at https://assets.nagios.com/downloads/nagioscore/docs/nagioscore/4/en/macros.html .
The alias attribute is another name for the object; in this case, we’ve used an alias of localhost. This alias is usually used as a longer description of the host and is also available as a macro called $HOSTALIAS$.
The last attribute, address, provides the IP address of the host; in this case we’re monitoring our local host, 127.0.0.1. This IP address must be contactable by Nagios to allow monitoring to take place. It is also available as the macro $HOSTADDRESS$.
Note
You can also specify the fully qualified domain name of the host, but this requires that your DNS is working and can resolve the hostname. If your DNS fails, your Nagios checks may also fail. We recommend using the IP address as the value of this attribute where appropriate, especially on core services like switches and DNS servers.
Host Templates
Now let’s see what additional attributes are provided by our linux-server template. In Listing 18-17, you can see the linux-server host object template.
Listing 18-17. A Host Object Template
define host {name linux-serveruse generic-hostcheck_period 24x7check_interval 5retry_interval 1max_check_attempts 10check_command check-host-alivenotification_period workhoursnotification_interval 120notification_options d,u,rcontact_groups adminsregister 0}
You can see we’ve defined a lot more attributes in our template. First, we define what sort of object this is a template for, in our case a host object. Next, using the name attribute, we give our template a name that must be unique. You can’t have two templates named linux-server.
The next attribute is one you’ve seen before, use, and it allows us to specify a template that this template in turn inherits from. Confused? Simply put, Nagios allows you to chain templates together. This enables you to build quite complex template models that minimize the amount of typing needed to define your monitoring environment. We’ll also look at the generic-host template in a moment.
dns-servers <- critical-servers <- linux-servers <- generic-hostYou can define the defaults you want in the generic-host template, override or add to those in linux-servers, override or add to those in critical-servers, and finally override or add to those definitions in the dns-servers template. The host definition again can override or add to those definitions defined in the templates.
Tip
What if you define the same attribute in multiple templates—which attribute value is used? Nagios inherits downward: the last reference to an attribute is the one that is used. For example, if the attribute check_period is defined in the templates generic-host and linux-server and in the host object definition for localhost, its value in the localhost object is the value used.
The next five attributes in Listing 18-17, check_period, check_interval, retry_interval, max_check_attempts, and check_command, are all related.
Time Periods
The first attribute, check_period, tells Nagios when to check the host. In our case, we’ve specified a time period called 24x7. We also need to define this time period in our Nagios configuration.
define timeperiod{timeperiod_name 24x7alias 24 Hours A Day, 7 Days A WeekSunday 00:00-24:00monday 00:00-24:00tuesday 00:00-24:00wednesday 00:00-24:00Thursday 00:00-24:00friday 00:00-24:00saturday 00:00-24:00}
This is a simple time-period definition, which has a timeperiod_name, in our case 24x7, and an alias description. We’ve then defined each day of the week and the times during those days that we want the time period to cover. In this time-period definition, we’re defining every day of the week and 24 hours a day.
To not cover a particular day, you simply don’t specify it. The times are specified in 24-hour time, and you can specify multiple ranges. Here’s an example:
Sunday 00:00-02:00,17:00-19:00Here our time period is Sunday from midnight to 2 a.m. and from 5 p.m. to 7 p.m.
Time periods are used in number of places in Nagios , but most commonly they specify when hosts and services should be checked and when notifications (messages generated when hosts and services fail or vary from their required state) should be sent.
The next attribute, max_check_attempts, specifies the number of times Nagios checks a host or service before determining that there is a problem.
The check_interval specifies how long between checks, and if there is a failure, we can use retry_interval to check more or less frequently.
Commands
The last attribute, check_command, tells Nagios what command to use to check the host’s status, in this case check-host-alive.
This is one of the commands we discussed earlier. Let’s look at it now.
define command{command_name check-host-alivecommand_line $USER1$/check_ping -H $HOSTADDRESS$ -w 3000.0,80% -c 5000.0,100% -p 1}
Commands are defined just like other objects. They are named with the command_name attribute, and the actual command to be executed is specified via the command_line attribute. In this case, we’ve specified the following line:
$USER1$/check_ping -H $HOSTADDRESS$ -w 3000.0,80% -c 5000.0,100% -p 1The first part of the command, $USER1$, is another Nagios macro . The $USERx$ macros are configuration variables, usually configured in a file called resource.cfg (or another file specified in the nagios.cfg configuration file using the resource_file configuration option). In this example, the value of the $USER1$ macro is the directory that contains the Nagios plug-ins.
$USER1$=/usr/lib64/nagios/pluginsThe next part of the command is the Nagios plug-in the command will employ, check_ping, which uses ICMP pings to check the status of your host.
Note
This assumes your host’s firewall is configured to accept ICMP pings, as we discussed in Chapter 7.
In this command, you can see the use of one of Nagios’s macros , $HOSTADDRESS$, that you learned earlier contains the IP address of the host. Whenever a host executes the check command, its address replaces the macro. This allows the same command to be used by multiple host objects. The macro is specified as the value of the -H option, which specifies the host to ping.
Note
You can get the help text from most Nagios plug-ins by running the command with the --help option. You can also run most Nagios plug-ins on the command line to see how they work, their command-line options, and what results they return.
The next two options, -w and -c, specify the thresholds for this check. If these thresholds are broken, Nagios will update the status of the host or service.
Hosts and services have different statuses. A host can be in the UP, DOWN, or UNREACHABLE state, and a service can be in the UP, WARNING, CRITICAL, or UNKNOWN state.
Note
The UNREACHABLE status is used when dependencies and parent-child relationships have been configured and a host is not available because a parent or host it depends on is not available.
The plug-ins themselves, though, return only the WARNING, CRITICAL, and UNKNOWN states (the UNKNOWN state is generally set when a plug-in fails to run or an error is returned rather than a valid status). When these plug-ins are run for a host, Nagios interprets and converts these statuses into the appropriate UP and DOWN statuses, as you can see in Table 18-5.
Table 18-5. Nagios Plug-in Status Conversions
Plug-in Status | Host Status | Status Description |
|---|---|---|
OK | UP | The host is up. |
WARNING | UP or DOWN | The host could be up or down but by default is up. |
UNKNOWN | DOWN | The host is down. |
CRITICAL | DOWN | The host is down. |
Note
This host state is also available to Nagios as a macro called $HOSTSTATE$. Also, see further information about host checking options here: https://assets.nagios.com/downloads/nagioscore/docs/nagioscore/4/en/configmain.html .
The -w and -c options take two values: the round-trip time in milliseconds and the percentage of successful pings needed not to break the threshold. So, if the -w threshold is broken, the WARNING status is generated, and Nagios will mark the host as UP. However, if the -c threshold is broken, the CRITICAL status is generated, and Nagios will mark the host as DOWN. A notification will usually then be generated. The last option on our command line, -p, specifies the number of pings to send.
Note
In addition to the status returned by a plug-in, for example, WARNING or CRITICAL, you will also get some output describing that state, which you can use in notifications or display in the console. For example, the check_ping plug-in returns PING OK - Packet loss = 0%, RTA = 3.98 ms. This output is also available as a macro called $HOSTOUTPUT$ for hosts and $SERVICEOUTPUT$ for service checks.
Notification Period
The next attribute in Listing 18-17 is the notification_period attribute. This differs slightly from the check period. While checks occur during the check_period time, in our case the 24x7 period, notifications (the alerts that get generated when a status changes) will get sent only during the workhours time period.
define timeperiod{timeperiod_name workhoursalias "Normal" Working Hoursmonday 09:00-17:00tuesday 09:00-17:00wednesday 09:00-17:00thursday 09:00-17:00Friday 09:00-17:00}
You can see that the workhours time period is 9 a.m. to 5 p.m., rather than 24 hours every day of the week as specified by our 24x7 check period.
The next attribute in Listing 18-17, notification_interval, configures how often Nagios will resend notifications if the status of the host doesn’t change; here it’s every 120 minutes, or 2 hours.
The notification_options attribute specifies when Nagios should send a notification. Here it is set to d, u, and r, which means Nagios will send notifications when the host is DOWN (d) or UNREACHABLE (u). The last option, r, sends a notification if the host has recovered (i.e., gone from a DOWN or UNREACHABLE state to an UP state).
Contacts and Contact Groups
The next attribute, contact_groups, tells Nagios whom to notify when a notification is generated. In our case, the value of this is admins, which refers to a contactgroup object. Contact groups are collections of contacts, which are the people you want to notify, for example, yourself or another system administrator, when a notification is generated. A contactgroup object looks like this:
define contactgroup{contactgroup_name adminsalias Nagios Administratorsmembers nagios-admin}
A contact group has a name defined via the contactgroup_name attribute, a description provided by the alias attribute, and a list of the contacts in that group, specified using the members attribute. In this case, the only member of the contact group is nagios-admin, which you can see here:
define contact{contact_name nagios-adminalias Nagios Adminservice_notification_period 24x7host_notification_period 24x7service_notification_options w,u,c,rhost_notification_options d,rservice_notification_commands notify-by-emailhost_notification_commands host-notify-by-emailemail nagios-admin@localhost}
Contacts are simple to define. Each has a name provided via the contact_name attribute and an alias.
For each contact, we specify when they should receive notifications and what notifications they should receive.
For specifying when to receive notifications, we use service_notification_period and host_notification_period. In our case, the nagios-admin contact will receive notifications during the 24x7 time period you saw earlier, or in real terms 24 hours every day of the week, for both hosts and services.
For specifying which notifications, we use the service_notification_options and host_notification_options attributes. For services, the nagios-admin contact will receive WARNING, UNKNOWN, or CRITICAL as indicated by the w, u, and c options, respectively; the r option means it will also receive recovery notifications. For hosts, the contact will receive only DOWN (d) and recovery (r) notifications.
The service_notification_commands and host_notification_commands attributes specify the commands Nagios uses to send the notifications. You can specify multiple commands by separating each with a comma. These commands are defined just like the commands used to check your hosts and services. Let’s look at one of these commands, notify-by-email.
define command{command_name host-notify-by-emailcommand_line /usr/bin/printf "%b" "***** Nagios ***** Notification Type: $NOTIFICATIONTYPE$ Host: $HOSTNAME$ State: $HOSTSTATE$ Address: $HOSTADDRESS$ Info: $HOSTOUTPUT$ Date/Time: $LONGDATETIME$ " | /usr/bin/mail -s "** $NOTIFICATIONTYPE$ Host Alert: $HOSTNAME$ is $HOSTSTATE$ **" $CONTACTEMAIL$}
Like the previous command you saw, a name is provided with the command_name attribute , and the actual command to be executed by the command_line attribute. In this case, we’re printing some text including a number of macros to the /bin/mail binary.
This would send an e-mail to any required contacts notifying them of the change in status. For example, if Nagios was monitoring our gateway.example.com host and a check of this host failed, a notification much like this would be generated:
***** Nagios *****Notification Type: PROBLEMHost: gateway.example.comState: DOWNAddress: 192.168.0.254Info: PING CRITICAL - Packet loss = 100%Date/Time: Fri Feb 13 00:30:28 EST 2009
Tip
Nagios can issue alerts through more than just e-mail. Indeed, Nagios can issue alerts to anything you can build an alert command for, for example, via API webhooks, ChatBots (Hubot, HipChat, Slack), instant messaging like Jabber, a pager like PagerDuty, or even a ticketing system via their APIs.
Table 18-6 provides a list of the macros used in our notification command.
Table 18-6. Macros in the Notification Command
Macro | Description |
|---|---|
$NOTIFICATIONTYPE$ | The type of notification, for example, PROBLEM for an issue or RECOVERY sif the host has recovered |
$HOSTNAME$ | The name of the host you are being notified about |
$HOSTSTATE$ | The current host state, for example, UP or DOWN |
$HOSTADDRESS$ | The IP address of the host |
$HOSTOUTPUT$ | Text output from the command used to check the host’s status |
$LONGDATETIME$$ | The date and time in long format (e.g., Fri Feb 13 00:30:28 EST 2009) |
$CONTACTEMAIL$ | The e-mail address of the contact to be e-mailed |
Note
You can see a full list of macros and where you can use them at https://assets.nagios.com/downloads/nagioscore/docs/nagioscore/4/en/macrolist.html .
Let’s get back to our contact definition; you can see the last attribute, email, which specifies an e-mail address for notifications to be sent to, which you’ve seen is available as the $CONTACTEMAIL$ macro.
In our template, you can see the last attribute in our Listing 18-17 template is register. This attribute is what tells Nagios that this is a template rather than a real host definition; when register is set to 0, Nagios doesn’t try to create the host object. Instead, it ignores it. The default setting for register is 1, which means any object definition that doesn’t explicitly specify register 0 will be assumed to be a real host object and will be monitored by Nagios.
Now let’s take a quick look at the parent template, generic-host, shown in Listing 18-18.
Listing 18-18. The generic-host Template
define host{name generic-hostnotifications_enabled 1event_handler_enabled 1flap_detection_enabled 1failure_prediction_enabled 1process_perf_data 1retain_status_information 1retain_nonstatus_information 1notification_period 24x7register 0}
Note
We’re not going to explain these options in any detail here; you can see read about them at https://assets.nagios.com/downloads/nagioscore/docs/nagioscore/4/en/objectdefinitions.html - host.
Defining Our Host
We are going to define our own hosts. We inherit some of our definitions from the linux-server template, which in turn will inherit from the generic-host template in the same way as we’ve shown here. For example, our gateway.example.com host would be defined like so:
define host{use linux-serverhost_name gateway.example.comalias gateway.example.comaddress 192.168.0.254}
Tip
Don’t forget you need to restart Nagios after adding any new configuration.
Here we’ve defined a host object for gateway.example.com and specified we’re going to use the host templates we’ve just explored. We’ve specified its internal IP address, 192.168.0.254, and Nagios will use this address to try to monitor the host via ICMP . The firewall on our gateway.example.com host would have to allow ICMP packets to ensure monitoring is possible.
Note
There are several other object definitions related to host monitoring that we haven’t looked at that allow you to group hosts together, enable dependencies between hosts, and provide similar functionality. You can see a full list of object types and their attributes at https://assets.nagios.com/downloads/nagioscore/docs/nagioscore/4/en/objectinheritance.htmlxodtemplate.html .
Service Configuration
Now that you know something about host objects, we’re going to examine a service object. Services are defined using the service-type object and are linked to their underlying host. For example, based on our existing configuration examples, Listing 18-19 shows a service that checks the disk space of our root partition.
Listing 18-19. A Service Definition
define service{use local-servicehost_name localhostservice_description Root Partitioncheck_command check_local_disk!20%!10%!/}
Our service definition is simple. The use attribute specifies a template our service is going to use. The host_name attribute specifies what host the service runs on, in our case localhost. The service_description describes the service. Lastly, the check_commandattribute specifies the command that the service uses to check the status of whatever is being monitored. This check_command is slightly different; after the command we want to use, you can see a string.
!20%!10%!/This string consists of variables we’re passing to the command definition, with each variable value prefixed with an exclamation mark (!). So here we are passing the values 20%, 10%, and / to the command. This allows us to reuse a command for multiple services, as you’ll see in a moment.
Let’s take a quick look at the check_local_disk command:
define command{command_name check_local_diskcommand_line $USER1$/check_disk -w $ARG1$ -c $ARG2$ -p $ARG3$}
Like our previous command, with command_line we’ve specified the $USER1$ macro to give us the path to the plug-in being executed. That plug-in is check_disk, which checks the status of a local disk.
You can also see the -w and -c options—which we told you earlier set the threshold values for the WARNING and CRITICAL statuses. Lastly, we have the -p option, which specifies the disk partition we’re monitoring. In this command, however, the value of each option is $ARGx$: $ARG1$, $ARG2$, and $ARG3$, respectively. Each of these arguments represents one of the arguments we passed in our check_command attribute in Listing 18-19, so our command_line command in fact looks like the following:
command_line $USER1$/check_disk -w 20% -c 10% -p /This results in a WARNING status being generated when only 20 percent of disk space is available and a CRITICAL status being generated when 10 percent of disk space is free, with both statuses applying to the root filesystem, or /.
To create a service that monitors disks on another partition, for example, /var, we would create a service like the following:
define service{use local-servicehost_name localhostservice_description Var Partitioncheck_command check_local_disk!20%!10%!/var}
Before we discuss some other services, let’s take a quick look at the local-servicetemplate our service is using:
define service{name local-serviceuse generic-servicemax_check_attempts 4normal_check_interval 5retry_check_interval 1register 0}
The service template, local-service, is similar to previous templates you’ve seen but with some additional attributes. The first of these new attributes, normal_check_interval, specifies how often Nagios should check that the service is OK, in this case every 5 minutes. The second new attribute, retry_check_interval, is related. If, when checking the service, Nagios discovers that the service is not OK, it retries the check the number of times specified in the max_check_attempts attribute. This is done before it marks the service as not OK. During this retry period, instead of checking once every 5 minutes as specified in normal_check_interval, the check is made every 1 minute as specified in retry_check_interval.
Note
Nagios has the concepts of soft and hard states. When a check fails, we’ve discovered Nagios checks it the number of times specified by max_check_attempts. Until Nagios exhausts all its check attempts, the host or service is marked as a soft fail state . When the check attempts are exhausted and a notification is generated, the host or service is now in a hard fail state . This soft fail mode means that if a host or service has temporarily failed and then recovers, you don’t get a notification, thereby reducing the number of potential false positive alerts from your monitoring system. You can read more about this at https://assets.nagios.com/downloads/nagioscore/docs/nagioscore/4/en/statetypes.html .
Note that this template also has a parent template, generic-service, which we’re not going to discuss in detail. Suffice to say that options like notification_options, notification_period, contact_groups, and check_period are defined there and can be overridden in downstream templates. The options used in that template are explained at https://assets.nagios.com/downloads/nagioscore/docs/nagioscore/4/en/objectdefinitions.html - service.
Note
Nagios tries to be smart about monitoring and usually doesn’t check hosts for their status unless a service running on that host has an issue. If a service on a host fails, Nagios usually schedules a check of the underlying host, too. You can read more about this at https://assets.nagios.com/downloads/nagioscore/docs/nagioscore/4/en/hostchecks.html .
Let’s look at another service definition, this one to monitor a network-based service, in Listing 18-20.
Listing 18-20. A Network-Based Service Definition
define service{use local-service ; Name of service template to usehost_name gateway.example.comservice_description Check SMTPcheck_command check_smtp!25}
In Listing 18-20, we have a new service, called Check SMTP, that uses our local-service template and a check_command of check_smtp!25. This passes the value 25 to a command called check_smtp. Let’s look at that command now:
define command{command_name check_smtpcommand_line $USER1$/check_smtp -H $HOSTADDRESS$ -p $ARG1$}
Here we have a command that runs a plug-in called check_smtp. It accepts the $HOSTADDRESS$ macro, which is the IP address of the SMTP server we want to check. The -p option specifies the port (the plug-in defaults to port 25), and we pass in this value as the $ARG1$ macro.
You can see a service alert generated by this service from the nagios.log log file here:
[1481325559] SERVICE ALERT: gateway.example.com;Check SMTP;CRITICAL;HARD;4;CRITICAL - Socket timeout after 10 seconds
The nagios.log entry specifies the Unix epoch time (1481325559, or Fri Dec 9 23:19:19 UTC 2016), the type of alert, the host and service, and the nature of the alert including the output from the plug-in.
Note
You can convert epoch time from the command line: date --date='@1235270465'.
Simple Remote Monitoring
You can create a variety of network-based services using Nagios plug-ins, but what if you want to monitor services that aren’t network facing or on the local host? One of the methods to do this is a special plug-in called check_by_ssh (for others, see the “Remote Monitoring” sidebar).
The check_by_ssh plug-in uses SSH to connect to a remote host and execute a command. So to make use of the plug-in, you have an SSH daemon running on the remote host, and any intervening firewalls have to allow SSH access to and from the host.
You also need to use key-based authentication between the hosts because Nagios has no capability to input a password when checking the service. So we’re going to start by creating a key to use between our Nagios server and the remote host.
Note
We introduced key-based SSH authentication in Chapter 10.
To create this key, we should be the user who runs Nagios, usually nagios. We can do this using the sudo command to execute the ssh-keygen command from the Nagios home directory of /var/spool/nagios.
# sudo -u nagios ssh-keygen -t rsa -b 4096Generating public/private rsa key pair.Enter file in which to save the key (/var/spool/nagios/.ssh/id_rsa):Created directory '/var/spool/nagios/.ssh'.Enter passphrase (empty for no passphrase):Enter same passphrase again:Your identification has been saved in /var/spool/nagios/.ssh/id_rsa.Your public key has been saved in /var/spool/nagios/.ssh/id_rsa.pub.The key fingerprint is:df:fc:d6:d2:50:66:65:51:79:d1:f8:56:a1:78:a4:df [email protected]
We use the -t rsa option to create an RSA key. We are prompted to enter a location for the key, usually in the .ssh directory under the home directory of the nagios user—in this case, /var/spool/nagios/.ssh. The private key is in the id_rsa file, and the public key is in the id_rsa.pub file. Instead of entering a passphrase for the key, we press Enter to specify an empty passphrase, because we need the connection to be made without a passphrase or password prompt.
We then need to copy the public key, id_rsa.pub, to the remote host and store it in the authorized_keys file for the user we’re going to connect to. If you are following along with this example, you should create a user on the remote host and specify a password for it. In our case, we do so on the remote gateway.example.com host as follows:
gateway$ sudo useradd nagiosWe also need to create the .ssh directory on the remote host and protect it.
gateway$ sudo mkdir /home/nagios/.sshgateway$ sudo chmod 0700 /home/nagios/.ssh
We can then copy the file, assuming jsmith has the appropriate access to the gateway server.
nagios$ scp .ssh/id_rsa.pub [email protected]:/tmp/authorized_keysnagios$ ssh [email protected]gateway$ sudo mv /tmp/authorized_keys /home/nagios/.ssh/authorized_keys &&sudo chown nagios /home/nagios/.ssh/authorized_keys &&sudo chmod 0644 /home/nagios/.ssh/authorized_keys
If this succeeds, we should now be able to SSH from the Nagios server to the gateway host without requiring a password. As root, issue the following (as the Nagios user account cannot access a shell as it is set to /sbin/nologin for their account; see the /etc/passwd file):
nagios# sudo –u nagios –E ssh nagios@gatewayThe authenticity of host 'gateway (192.168.0.254)' can't be established.ECDSA key fingerprint is 2d:94:d5:bd:3e:40:93:fe:d4:9b:eb:6f:93:4d:f3:a1.Are you sure you want to continue connecting (yes/no)? yesWarning: Permanently added 'gateway,192.168.0.254' (ECDSA) to the list of known hosts.
Here we have used sudo to execute the ssh command as the nagios user. The –E says use the Nagios user’s environment. This is important because this command will write the host key to the Nagios user’s ∼/.ssh/known_hosts file. We now configure Nagios to use this connection to check services. The check_by_ssh plug-in also relies on having the command to be executed installed on the remote host. This command is usually a Nagios plug-in, and hence the easiest way to do this is to install the Nagios plug-in package on the remote host. On CentOS, we issue the following:
gateway$ sudo yum install nagios-plugins nagios-plugins-loadOn Ubuntu, you can install the plug-ins like we did on the Nagios server, or you should be able to install them from the APT repository.
gateway$ sudo apt-get install nagios-pluginsWe can then define a command that uses the check_by_ssh plug-in to monitor a service on the remote host. For example, to monitor the load on a remote host, we could use the following command:
$ sudo vi /etc/nagios/objects/commands.cfg# ssh_check_commandsdefine command{command_name check_load_sshcommand_line $USER1$/check_by_ssh -H $HOSTADDRESS$ -l nagios-C "/usr/lib64/nagios/plugins/check_load -w $ARG1$ -c $ARG2$"}
We have added the previous command definition to the /etc/nagios/objects/commands.cfg file. We call our command check_load_ssh. The command_line part specifies that we’re executing the check_by_ssh plug-in and connecting to the host specified by the -H option.
The -l option specifies the name of the user we want to connect to on the remote host; here we’re using the nagios user we just created.
The -C specifies the command we want to run on the remote host. In this case, we’re running another, locally installed, Nagios plug-in called check_load and passing two arguments to it as the values of the -w and -c (WARNING and CRITICAL) thresholds.
Tip
The check_by_ssh command can do a whole lot more. Run it with the --help option to see all its capabilities.
We are going to create a file called linux-servers-base.cfg in the /etc/nagios/objects directory. This is going to be used to define our gateway host and define the service check we will use to check the load on the gateway server. The file will look like Listing 18-21.
Listing 18-21. linux-servers-base.cfg
define host{name basic-ssh-checksuse linux-serverhostgroups linux-groupregister 0}define host{host_name gatewayalias gateway.example.comuse basic-ssh-checks}define service{use local-servicehostgroup_name linux-groupservice_description Current Loadcheck_command check_load_ssh!5.0,4.0,3.0!10.0,6.0,4.0}define hostgroup{hostgroup_name linux-group}
In Listing 18-21 we have defined one host template, one host, one service, and one hostgroup. The host template is basically used to attach any hosts that use this template to the linux-group hostgroup. We are using the hostgroup here to link the host template and the service together. Every host that uses the template basic-ssh-checks will get the Current Load service because they share the same hostgroup.
Taking a look at our service definition closer, we can see that we have declared it like this:
define service{use local-servicehostgroup_name linux-groupservice_description Current Loadcheck_command check_load_ssh!5.0,4.0,3.0!10.0,6.0,4.0}
Our service, called Current Load, executes the check_load_ssh command and passes two arguments, which specify the average load over the 1-, 5-, and 15-minute intervals required to trigger a WARNING or CRITICAL status.
Note
We discussed load in Chapter 17.
Finally in Listing 18-21 we have the host definition for the gateway server. This uses the template basic-ssh-checks, which calls in the Current Load service check via the hostgroup. It also will have all the notification and check period definitions provided by the linux-server template and the generic-host templates as we do not override anything here or in the templates.
This is a simple example of how to perform remote monitoring; it is not ideal (the key-based SSH connection could be a security vulnerability), but it is the simplest method. For more complicated environments, using the NRPE server and corresponding command is usually a better approach. NCAP and NRDP are also available and require a combination of different plug-ins with a mix of languages (which makes them awkward to install and configure).
Note
As with hosts, we haven’t covered all the available functionality for services. You can also group services together, make them dependent on each other, and perform a variety of other useful tricks with them. We recommend you read the available Nagios documentation and many of the other useful resources for more information.
Logging and Debugging
You can view the logs for Nagios in the /var/log/nagios/nagios.log file. You may also have these notifications being replicated to the syslog (rsyslog) daemon.
If you do not want this functionality, you can set your use_syslog directive to the following:
use_syslog=0When you need to debug Nagios , you will need to edit the /etc/nagios/nagios.cfg file and edit the following:
debug_level=0Do you remember from LDAP logging when we had additive logging directives that give different log levels by adding binary numbers together? Nagios is the same. Here is the list of possible logging levels:
# -1 = Everything# 0 = Nothing# 1 = Functions# 2 = Configuration# 4 = Process information# 8 = Scheduled events# 16 = Host/service checks# 32 = Notifications# 64 = Event broker# 128 = External commands# 256 = Commands# 512 = Scheduled downtime# 1024 = Comments# 2048 = Macros
So if we wanted to see host and service checks in our logs and the external commands, we would change debug=0 to debug=144, which is 16 (host/service checks) + 128 (external commands).
You will need to restart Nagios for this to take effect, and the debug logs will appear in a /var/log/nagios/debug.log file.
Nagios Plug-ons
You can choose from a large collection of plug-ins to create services and commands to check them. You can see a partial list of the available plug-ins in Table 18-7.
Table 18-7. Nagios Plug-Ins
Plug-in | Description |
|---|---|
check_ntp | Checks the status of an NTP service |
check_swap | Checks your swap |
check_ifstatus | Checks the status of network interfaces |
check_tcp | Checks the status of a TCP-based network service |
check_by_ssh | Checks the status of a service via SSH |
check_imap | Checks the status of an IMAP service |
check_clamd | Checks the status of a ClamAV daemon |
check_udp | Checks the status of a UDP-based network service |
check_dig | Checks the DNS status via dig |
check_ping | Checks the status of a host via ICMP |
check_simap | Checks the status of an IMAP service |
check_nagios | Checks the status of the Nagios process |
check_snmp | Checks via SNMP |
check_http | Checks the status of a web server |
check_ssh | Checks the status of an sshd service |
This is a small selection of the available plug-ins, but it should give you a good basis for creating appropriate checks for your environment. Most Nagios plug-ins are simple and self-explanatory. Almost all of them provide the --help option to display their function and options.
Other plug-ins outside of the Nagios plug-in pack are also available. For example, you can find a huge collection of such plug-ins at https://exchange.nagios.org/directory/Plugins .
Note
You can also find some useful add-ons at https://www.nagios.org/downloads/nagios-core-addons/ .
You can develop your own plug-ins , if required. Some simple guidelines and examples for such development are located at https://assets.nagios.com/downloads/nagioscore/docs/nagioscore/4/en/pluginapi.html .
Setting Up the Nagios Console
Now that you understand how hosts and services can be defined, you can create your own hosts and services to supplement the examples provided with both distributions. Once you have created these hosts and services, it is useful to have a console to view them in. Nagios comes with a fully functional web-based console, and we’re going to show you how to set it up.
Tip
Alternatives to the Nagios console are also available. You can see a good list of these at https://exchange.nagios.org/directory/Addons/Frontends-(GUIs-and-CLIs)/Web-Interfaces .
The Nagios console can run inside the Apache web server we demonstrated in Chapter 11. Both CentOS and Ubuntu include default installations of the web console. On CentOS, you can find the Apache configuration for Nagios at /etc/httpd/conf.d/nagios.conf; on Ubuntu, it’s at /etc/apache2/conf-available/nagios.conf.
The console can be found in a web service directory of /nagios. If your web server is running, browsing to http://nagios.example.com/nagios/ (replacing the hostname with the name of your Nagios host) should display your console.
Note
You can use what you learned in Chapter 11 to move your Nagios console to a virtual host or other location.
Console Authentication
To protect against people making malicious use of your Nagios console, the web server has some basic authentication. Nagios uses Apache’s basic HTTP authentication to protect the console. When you open the console, you will be prompted for a username and password, as you can see in Figure 18-9.
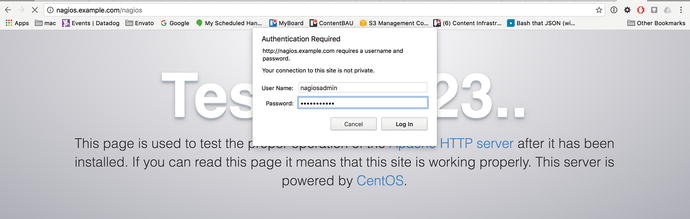
Figure 18-9. Nagios authentication
Apache basic authentication is configured by specifying a file holding usernames and passwords to the web server. This file is then queried by web sites that are secured by basic authentication. The default username and password are nagiosadmin.
Caution
This is basic authentication with an emphasis on basic, however. Apache basic authentication uses simple encrypted passwords that are easy to intercept and decrypt. To ensure better protection of your Nagios console, you should consider enabling SSL for it.
Let’s look inside our Nagios Apache configuration for the location of our password file. On CentOS, inside our /etc/httpd/conf.d/nagios.conf file, we find the following:
AuthName "Nagios Access"AuthType BasicAuthUserFile /etc/nagios/passwd<IfModule mod_authz_core.c># Apache 2.4<RequireAll>Require all grantedRequire valid-user</RequireAll></IfModule>
On Ubuntu, in the /etc/apache2/conf-available/nagios.conf file, we have this:
AuthName "Nagios Access"AuthType BasicAuthUserFile /etc/nagios/htpasswd.usersRequire valid-user
The AuthName and AuthType directives enable basic authentication. The AuthUserFile specifies the location of the password file, /etc/nagios/passwd on CentOS and /etc/nagios/htpasswd.users on Ubuntu. This is the file we need to add our users to. The Require valid-user directive indicates that only users specified in this file can log into the console.
Once you’ve found where your authentication file needs to be, you need to create the file to hold your users and passwords. You do this using a command called htpasswd.
Listing 18-22 shows this command in action.
Listing 18-22. Using the htpasswd Command
$ sudo htpasswd -c /etc/nagios/passwd jsmithNew password:Re-type new password:Adding password for user jsmith
The htpasswd command has two variables: the location of the file that holds our usernames and passwords and the username of the user. We also use a command-line switch, -c. The -c switch is used when you first create a password file. After that, you can drop this switch and merely specify the file and the user to be added.
In Listing 18-22, we added a new password to the file with the -c option called /etc/nagios/passwd. We specify the user we’re adding, jsmith, and are prompted for a password and then a verification of the entered password. Both passwords must match. If they do, the command will be successful, and the user will be added to the specified password file.
We can then use this username and password to sign in to the Nagios console and display the console screen, as you can see in Figure 18-10.
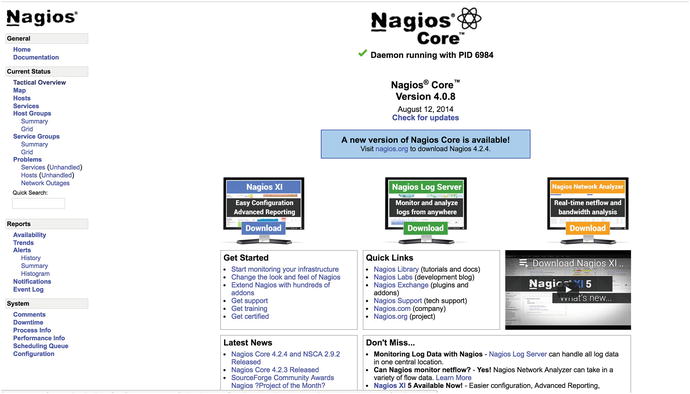
Figure 18-10. The Nagios console
Once we have users and passwords created, we can sign on to the console, but we also need to configure what access each user has. This is done by editing a configuration file called cgi.cfg, located in the /etc/nagios directory.
Nagios has two types of users on the console: authenticated users and authenticated contacts. Both types of users need a username and password to sign on to the console. Authenticated users have their access specified in the cgi.cfg configuration file. Authenticated contacts are authenticated users, with the username of each matching the name of a Nagios contact.
Hence, if the username jsmith, for example, matches the name of a contact, which is the value of the contact_name directive, this authenticated user becomes an authenticated contact.
So, what’s the difference? Authenticated users are granted some generic rights to view the web console. Authenticated contacts are granted further rights to view and manipulate the hosts and services for which they are contacts.
Let’s look at the cgi.cfg file. The first directive in the cgi.cfg file is called use_authentication. It controls whether authentication is enabled for the Nagios web console and whether Nagios will use the authentication credentials provided from the web server. The directive looks like this:
use_authentication=1A setting of 1, which is the default, enables authentication, and a setting of 0 disables it. Authorization for particular functions on the console is provided by a series of directives in the cgi.cfg file that take lists of users, separated by commas, as options. Here’s an example:
authorized_for_all_services=jsmith,nagiosadminThe authorized_for_all_services directive controls who can view services on the console, and we’ve specified that the users jsmith and nagiosadmin have this access.
Table 18-8 contains the full list of possible authorization directives and describes each one.
Table 18-8. Authorization Directives
Directive | Description |
|---|---|
authorized_for_system_information | Users who can access the Nagios process information |
authorized_for_configuration_information | Users who can see all configuration information |
authorized_for_system_commands | Users who can issue commands through the web console |
authorized_for_all_services | Users who are authorized to all services |
authorized_for_all_hosts | Users who are authorized to all hosts |
authorized_for_all_service_commands | Users who can issue service-related external commands |
authorized_for_all_host_commands | Users who can issue host-related external commands |
The first directive in Table 18-8, authorized_for_system_information, provides access to view information about the Nagios process and the server, such as when the process started and what settings are set on the server.
The second directive, authorized_for_configuration_information, provides authorization to view all configuration information and the object definitions for your monitoring environment. This includes the configuration of your hosts, services, contacts, and commands, as well as all other object types.
The third directive, authorized_for_system_commands, controls who has access to start, stop, or restart the Nagios process from the web console.
The next two directives, authorized_for_all_services and authorized_for_all_hosts, control which users can view all service and host information on the web console. Remember, authenticated contacts can view the information about the hosts and services for which they are contacts.
The last two directives in Table 18-8, authorized_for_all_service_commands and authorized_for_all_host_commands, allow you to specify users who are authorized to issue external commands to services and hosts, respectively. This allows you to perform actions such as disabling active checks of the host or service or enabling or disabling notifications for the host or service.
Note
By default, all the authorization directives are commented out in the cgi.cfg file. You will need to uncomment them and add any required users to the directives.
If you want to specify that all users have access to a particular function, use the * symbol.
authorized_for_all_services=*This directive setting would provide all authenticated users with access to view information about all services defined on the Nagios server. The * symbol will work for all authorization directives.
As we mentioned earlier, in addition to any authorization granted to them, users who are also contacts have access to the hosts and services for which they are contacts. For services, this access includes
Viewing of service status
Viewing of service configuration
Ability to view service history and notifications
Ability to issue commands to the service (start and stop checking, for example)
For hosts, this access includes
Viewing of host status
Viewing of host configuration
Ability to view host history and notifications
Ability to issue commands to the host (start and stop checking, for example)
Authenticated contacts that have access to a particular host because they are a contact for that host also have the same access to all the services on that host just as if they were a contact for those services. For example, if you are an authenticated contact for the server1 host, you are able to view the status, configuration, service history, and notifications as well as issue commands to all the services defined on that host.
Console Functions
The Nagios console provides not only an interface through which to view your hosts and services but also the ability to control how they are monitored. We’re going to walk you through a few of the screens available in the console, but we recommend you take a look at the views, graphs, lists, and controls available on the console.
For a summary of the status of your environment, the best view is the Tactical Monitoring Overview screen, which you can see in Figure 18-11.
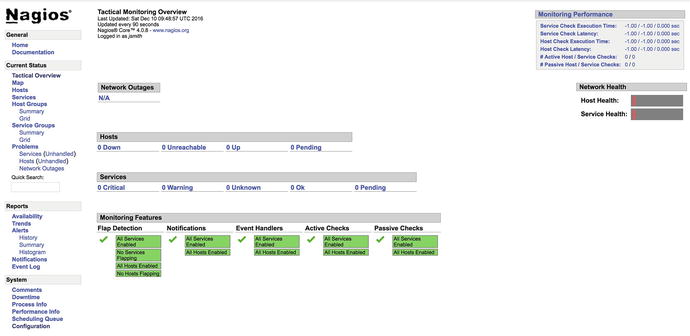
Figure 18-11. The Tactical Monitoring Overview screen
This screen displays the current status of the Nagios server and a summary of your host and service statuses. It is reached by clicking the Tactical Monitoring Overview link in the left menu.
To see your hosts and services in more detail, the Host Detail and Service Detail links in the left menu display a full list of the hosts and services being monitored. You can see the Service Detail screen in Figure 18-12.
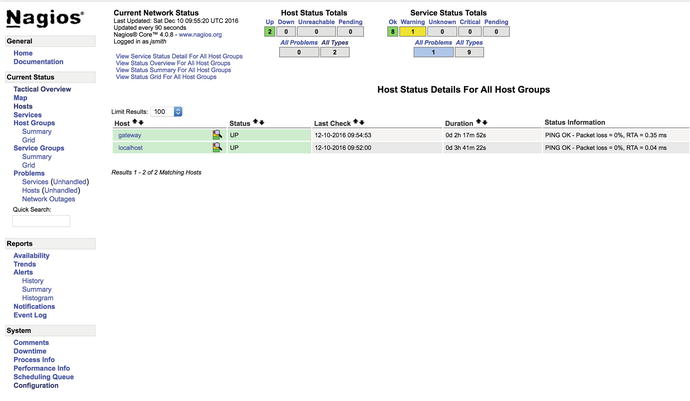
Figure 18-12. The Hosts Detail screen
You can see here that we have two hosts listed: the localhost or the Nagios server and the gateway server we configured earlier. You can see that we can ping both hosts and that they are in the status of UP. On the right side you can see information about the ping response; also, you can see the last time they were checked and how long they have been in that current state for.
In Figure 18-13 we show the Service Detail screen.
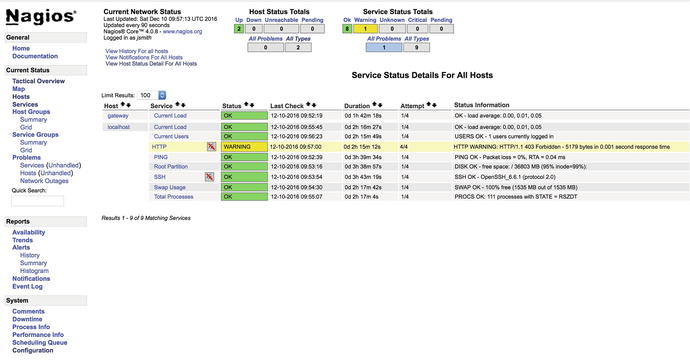
Figure 18-13. The Service Detail screen
Here in Figure 18-13 we can see the status of the services that we are checking on our hosts. You can see the check for Current Load is working on our gateway server. The HTTP check is in a WARNING state because the httpd service is responding but the result is not 200 OK but rather 403. We would have to change the check to handle the authentication the Nagios web service requires before we will get a 200 OK and for it to be green.
On both these screens, you can click the hosts and services to drill down into their status and configuration.
The last console screen we’re going to show you in Figure 18-14 is the Process Info screen, which displays the status of the Nagios process and its configuration. You can also configure a variety of Nagios options, such as enabling and disabling checking and notifications, through this screen.
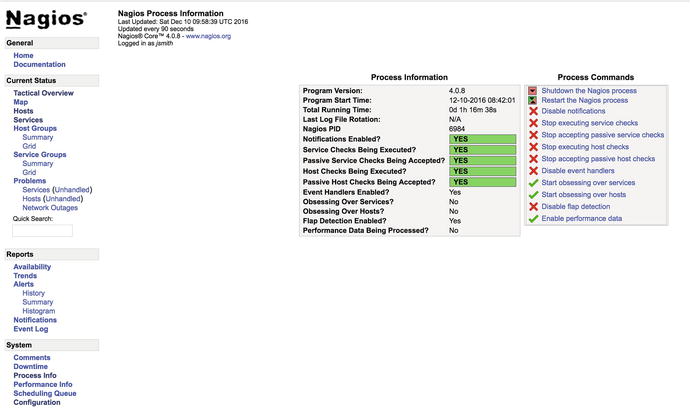
Figure 18-14. The Nagios Process Information screen
You can do other things through this console, such as host and service reports, check the event log, and see and schedule downtime for hosts and services.
Troubleshooting Nagios
Lots of resources are available to help you with Nagios including web sites, forums, and books, such as Pro Nagios 2.0 by James Turnbull, one of the authors of this book (Apress, 2006). You may also find Art of Monitoring by the same author to be useful; see https://www.artofmonitoring.com/ .
You can find a number of support options, including commercial support, at https://www.nagios.org/support/ , comprehensive documentation at https://www.nagios.org/documentation/ , and a FAQ for Nagios at https://support.nagios.com/knowledge-base/ . You can also subscribe to the active and helpful mailing list available at http://lists.nagios.com/mailman/listinfo through the Nagios forum at https://support.nagios.com/forum/index.php , which is the preferred way of getting user help.
Summary
In this chapter, you learned about logging and monitoring and how to make them work for you. You discovered how rsyslog works and how to make the most out of your rsyslog daemon. You also learned how to search your log data using Kibana and how to get your log data into Elasticsearch via Logstash and Filebeats.
In addition, the chapter explored Nagios, an enterprise monitoring tool. You saw how to install and configure Nagios. You also discovered how to configure your hosts and services and the supporting configuration needed to monitor your environment.
In the next chapter, we’ll discuss provisioning hosts and show you how to manage your configuration with automated configuration tools.