
Chapter 1
Discovering the Match between Data Science and Python
IN THIS CHAPTER
![]() Discovering the wonders for data science
Discovering the wonders for data science
![]() Exploring how data science works
Exploring how data science works
![]() Creating the connection between Python and data science
Creating the connection between Python and data science
![]() Getting started with Python
Getting started with Python
Data science may seem like one of those technologies that you’d never use, but you’d be wrong. Yes, data science involves the use of advanced math techniques, statistics, and big data. However, data science also involves helping you make smart decisions, creating suggestions for options based on previous choices, and making robots see objects. In fact, people use data science in so many different ways that you literally can’t look anywhere or do anything without feeling the effects of data science on your life. In short, data science is the person behind the partition in the experience of the wonderment of technology. Without data science, much of what you accept as typical and expected today wouldn’t even be possible. This is the reason that being a data scientist is the sexiest job of the twenty-first century.
 To make data science doable by someone who’s less than a math genius, you need tools. You could use any of a number of tools to perform data science tasks, but Python is uniquely suited to making it easier to work with data science. For one thing, Python provides an incredible number of math-related libraries that help you perform tasks with a less-than-perfect understanding of precisely what is going on. However, Python goes further by supporting multiple coding styles (programming paradigms) and doing other things to make your job easier. Therefore, yes, you could use other languages to write data science applications, but Python reduces your workload, so it’s a natural choice for those who really don’t want to work hard, but rather to work smart.
This chapter gets you started with Python. Even though this book isn’t designed to provide you with a complete Python tutorial, exploring some basic Python issues will reduce the time needed for you to get up to speed. (If you do need a good starting tutorial, please get Beginning Programming with Python For Dummies, 2nd Edition, by John Mueller (Wiley). You’ll find that the book provides pointers to tutorials and other aids as needed to fill in any gaps that you may have in your Python education.
Defining the Sexiest Job of the 21st Century
At one point, the world viewed anyone working with statistics as a sort of accountant or perhaps a mad scientist. Many people consider statistics and analysis of data boring. However, data science is one of those occupations in which the more you learn, the more you want to learn. Answering one question often spawns more questions that are even more interesting than the one you just answered. However, the thing that makes data science so sexy is that you see it everywhere and used in an almost infinite number of ways. The following sections provide you with more details on why data science is such an amazing field of study.
Considering the emergence of data science
Data science is a relatively new term. William S. Cleveland coined the term in 2001 as part of a paper entitled “Data Science: An Action Plan for Expanding the Technical Areas of the Field of Statistics.” It wasn’t until a year later that the International Council for Science actually recognized data science and created a committee for it. Columbia University got into the act in 2003 by beginning publication of the Journal of Data Science.
However, the mathematical basis behind data science is centuries old because data science is essentially a method of viewing and analyzing statistics and probability. The first essential use of statistics as a term comes in 1749, but statistics are certainly much older than that. People have used statistics to recognize patterns for thousands of years. For example, the historian Thucydides (in his History of the Peloponnesian War) describes how the Athenians calculated the height of the wall of Platea in fifth century BC by counting bricks in an unplastered section of the wall. Because the count needed to be accurate, the Athenians took the average of the count by several solders.
The process of quantifying and understanding statistics is relatively new, but the science itself is quite old. An early attempt to begin documenting the importance of statistics appears in the ninth century when Al-Kindi wrote Manuscript on Deciphering Cryptographic Messages. In this paper, Al-Kindi describes how to use a combination of statistics and frequency analysis to decipher encrypted messages. Even in the beginning, statistics saw use in practical application of science to tasks that seemed virtually impossible to complete. Data science continues this process, and to some people it might actually seem like magic.
Outlining the core competencies of a data scientist
As is true of anyone performing most complex trades today, the data scientist requires knowledge of a broad range of skills to perform the required tasks. In fact, so many different skills are required that data scientists often work in teams. Someone who is good at gathering data might team up with an analyst and someone gifted in presenting information. It would be hard to find a single person with all the required skills. With this in mind, the following list describes areas in which a data scientist could excel (with more competencies being better):
- Data capture: It doesn’t matter what sort of math skills you have if you can’t obtain data to analyze in the first place. The act of capturing data begins by managing a data source using database management skills. However, raw data isn’t particularly useful in many situations — you must also understand the data domain so that you can look at the data and begin formulating the sorts of questions to ask. Finally, you must have data-modeling skills so that you understand how the data is connected and whether the data is structured.
- Analysis: After you have data to work with and understand the complexities of that data, you can begin to perform an analysis on it. You perform some analysis using basic statistical tool skills, much like those that just about everyone learns in college. However, the use of specialized math tricks and algorithms can make patterns in the data more obvious or help you draw conclusions that you can’t draw by reviewing the data alone.
- Presentation: Most people don’t understand numbers well. They can’t see the patterns that the data scientist sees. It’s important to provide a graphical presentation of these patterns to help others visualize what the numbers mean and how to apply them in a meaningful way. More important, the presentation must tell a specific story so that the impact of the data isn’t lost.
Linking data science, big data, and AI
Interestingly enough, the act of moving data around so that someone can perform analysis on it is a specialty called Extract, Transformation, and Loading (ETL). The ETL specialist uses programming languages such as Python to extract the data from a number of sources. Corporations tend not to keep data in one easily accessed location, so finding the data required to perform analysis takes time. After the ETL specialist finds the data, a programming language or other tool transforms it into a common format for analysis purposes. The loading process takes many forms, but this book relies on Python to perform the task. In a large, real-world operation, you might find yourself using tools such as Informatica, MS SSIS, or Teradata to perform the task.
Data science isn’t necessarily a means to an end; it may instead be a step along the way. As a data scientist works through various datasets and finds interesting facts, these facts may act as input for other sorts of analysis and AI applications. For example, consider that your shopping habits often suggest what books you might like or where you might like to go for a vacation. Shopping or other habits can also help others understand other, sometimes less benign, activities as well. Machine Learning For Dummies and AI For Dummies, both by John Mueller and Luca Massaron (Wiley) help you understand these other uses of data science. For now, consider the fact that what you learn in this book can have a definite effect on a career path that will go many other places.
Understanding the role of programming
A data scientist may need to know several programming languages in order to achieve specific goals. For example, you may need SQL knowledge to extract data from relational databases. Python can help you perform data loading, transformation, and analysis tasks. However, you might choose a product such as MATLAB (which has its own programming language) or PowerPoint (which relies on VBA) to present the information to others. (If you’re interested to see how MATLAB compares to the use of Python, you can get my book, MATLAB For Dummies, published by John Wiley & Sons, Inc.) The immense datasets that data scientists rely on often require multiple levels of redundant processing to transform into useful processed data. Manually performing these tasks is time consuming and error prone, so programming presents the best method for achieving the goal of a coherent, usable data source.
Given the number of products that most data scientists use, it may not be possible to use just one programming language. Yes, Python can load data, transform it, analyze it, and even present it to the end user, but it works only when the language provides the required functionality. You may have to choose other languages to fill out your toolkit. The languages you choose depend on a number of criteria. Here are the things you should consider:
- How you intend to use data science in your code (you have a number of tasks to consider, such as data analysis, classification, and regression)
- Your familiarity with the language
- The need to interact with other languages
- The availability of tools to enhance the development environment
- The availability of APIs and libraries to make performing tasks easier
Creating the Data Science Pipeline
Data science is partly art and partly engineering. Recognizing patterns in data, considering what questions to ask, and determining which algorithms work best are all part of the art side of data science. However, to make the art part of data science realizable, the engineering part relies on a specific process to achieve specific goals. This process is the data science pipeline, which requires the data scientist to follow particular steps in the preparation, analysis, and presentation of the data. The following sections help you understand the data science pipeline better so that you can understand how the book employs it during the presentation of examples.
Preparing the data
The data that you access from various sources doesn’t come in an easily packaged form, ready for analysis — quite the contrary. The raw data not only may vary substantially in format, but you may also need to transform it to make all the data sources cohesive and amenable to analysis. Transformation may require changing data types, the order in which data appears, and even the creation of data entries based on the information provided by existing entries.
Performing exploratory data analysis
The math behind data analysis relies on engineering principles in that the results are provable and consistent. However, data science provides access to a wealth of statistical methods and algorithms that help you discover patterns in the data. A single approach doesn’t ordinarily do the trick. You typically use an iterative process to rework the data from a number of perspectives. The use of trial and error is part of the data science art.
Learning from data
As you iterate through various statistical analysis methods and apply algorithms to detect patterns, you begin learning from the data. The data might not tell the story that you originally thought it would, or it might have many stories to tell. Discovery is part of being a data scientist. In fact, it’s the fun part of data science because you can’t ever know in advance precisely what the data will reveal to you.
Of course, the imprecise nature of data and the finding of seemingly random patterns in it means keeping an open mind. If you have preconceived ideas of what the data contains, you won’t find the information it actually does contain. You miss the discovery phase of the process, which translates into lost opportunities for both you and the people who depend on you.
Visualizing
Visualization means seeing the patterns in the data and then being able to react to those patterns. It also means being able to see when data is not part of the pattern. Think of yourself as a data sculptor — removing the data that lies outside the patterns (the outliers) so that others can see the masterpiece of information beneath. Yes, you can see the masterpiece, but until others can see it, too, it remains in your vision alone.
Obtaining insights and data products
The data scientist may seem to simply be looking for unique methods of viewing data. However, the process doesn’t end until you have a clear understanding of what the data means. The insights you obtain from manipulating and analyzing the data help you to perform real-world tasks. For example, you can use the results of an analysis to make a business decision.
In some cases, the result of an analysis creates an automated response. For example, when a robot views a series of pixels obtained from a camera, the pixels that form an object have special meaning and the robot’s programming may dictate some sort of interaction with that object. However, until the data scientist builds an application that can load, analyze, and visualize the pixels from the camera, the robot doesn’t see anything at all.
Understanding Python’s Role in Data Science
Given the right data sources, analysis requirements, and presentation needs, you can use Python for every part of the data science pipeline. In fact, that’s precisely what you do in this book. Every example uses Python to help you understand another part of the data science equation. Of all the languages you could choose for performing data science tasks, Python is the most flexible and capable because it supports so many third-party libraries devoted to the task. The following sections help you better understand why Python is such a good choice for many (if not most) data science needs.
Considering the shifting profile of data scientists
Some people view the data scientist as an unapproachable nerd who performs miracles on data with math. The data scientist is the person behind the curtain in an Oz-like experience. However, this perspective is changing. In many respects, the world now views the data scientist as either an adjunct to a developer or as a new type of developer. The ascendance of applications of all sorts that can learn is the essence of this change. For an application to learn, it has to be able to manipulate large databases and discover new patterns in them. In addition, the application must be able to create new data based on the old data — making an informed prediction of sorts. The new kinds of applications affect people in ways that would have seemed like science fiction just a few years ago. Of course, the most noticeable of these applications define the behaviors of robots that will interact far more closely with people tomorrow than they do today.
From a business perspective, the necessity of fusing data science and application development is obvious: Businesses must perform various sorts of analysis on the huge databases it has collected — to make sense of the information and use it to predict the future. In truth, however, the far greater impact of the melding of these two branches of science — data science and application development — will be felt in terms of creating altogether new kinds of applications, some of which aren’t even possibly to imagine with clarity today. For example, new applications could help students learn with greater precision by analyzing their learning trends and creating new instructional methods that work for that particular student. This combination of sciences might also solve a host of medical problems that seem impossible to solve today — not only in keeping disease at bay, but also by solving problems, such as how to create truly usable prosthetic devices that look and act like the real thing.
Working with a multipurpose, simple, and efficient language
Many different ways are available for accomplishing data science tasks. This book covers only one of the myriad methods at your disposal. However, Python represents one of the few single-stop solutions that you can use to solve complex data science problems. Instead of having to use a number of tools to perform a task, you can simply use a single language, Python, to get the job done. The Python difference is the large number scientific and math libraries created for it by third parties. Plugging in these libraries greatly extends Python and allows it to easily perform tasks that other languages could perform, but with great difficulty.
 Python’s libraries are its main selling point; however, Python offers more than reusable code. The most important thing to consider with Python is that it supports four different coding styles:
- Functional: Treats every statement as a mathematical equation and avoids any form of state or mutable data. The main advantage of this approach is having no side effects to consider. In addition, this coding style lends itself better than the others to parallel processing because there is no state to consider. Many developers prefer this coding style for recursion and for lambda calculus.
- Imperative: Performs computations as a direct change to program state. This style is especially useful when manipulating data structures and produces elegant, but simple, code.
- Object-oriented: Relies on data fields that are treated as objects and manipulated only through prescribed methods. Python doesn’t fully support this coding form because it can’t implement features such as data hiding. However, this is a useful coding style for complex applications because it supports encapsulation and polymorphism. This coding style also favors code reuse.
- Procedural: Treats tasks as step-by-step iterations where common tasks are placed in functions that are called as needed. This coding style favors iteration, sequencing, selection, and modularization.
Learning to Use Python Fast
It’s time to try using Python to see the data science pipeline in action. The following sections provide a brief overview of the process you explore in detail in the rest of the book. You won’t actually perform the tasks in the following sections. In fact, you don’t install Python until Chapter 3, so for now, just follow along in the text. This book uses a specific version of Python and an IDE called Jupyter Notebook, so please wait until Chapter 3 to install these features (or skip ahead, if you insist, and install them now). Don’t worry about understanding every aspect of the process at this point. The purpose of these sections is to help you gain an understanding of the flow of using Python to perform data science tasks. Many of the details may seem difficult to understand at this point, but the rest of the book will help you understand them.
The examples in this book rely on a web-based application named Jupyter Notebook. The screenshots you see in this and other chapters reflect how Jupyter Notebook looks in Firefox on a Windows 7 system. The view you see will contain the same data, but the actual interface may differ a little depending on platform (such as using a notebook instead of a desktop system), operating system, and browser. Don’t worry if you see some slight differences between your display and the screenshots in the book.
You don’t have to type the source code for this chapter in by hand. In fact, it’s a lot easier if you use the downloadable source (see the Introduction for details on downloading the source code). The source code for this chapter appears in the P4DS4D2_01_Quick_Overview.ipynb source code file.
Loading data
Before you can do anything, you need to load some data. The book shows you all sorts of methods for performing this task. In this case, Figure 1-1 shows how to load a dataset called Boston that contains housing prices and other facts about houses in the Boston area. The code places the entire dataset in the boston variable and then places parts of that data in variables named X and y. Think of variables as you would storage boxes. The variables are important because they make it possible to work with the data.
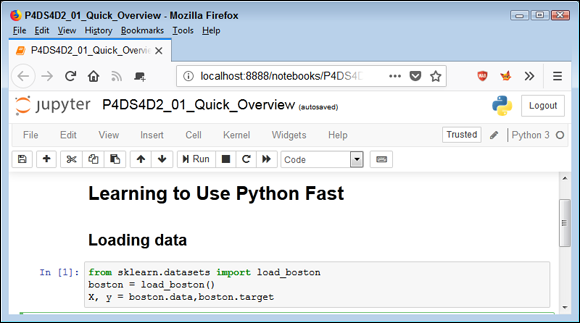
FIGURE 1-1: Loading data into variables so that you can manipulate it.
Training a model
Now that you have some data to work with, you can do something with it. All sorts of algorithms are built into Python. Figure 1-2 shows a linear regression model. Again, don’t worry precisely how this works; later chapters discuss linear regression in detail. The important thing to note in Figure 1-2 is that Python lets you perform the linear regression using just two statements and to place the result in a variable named hypothesis.
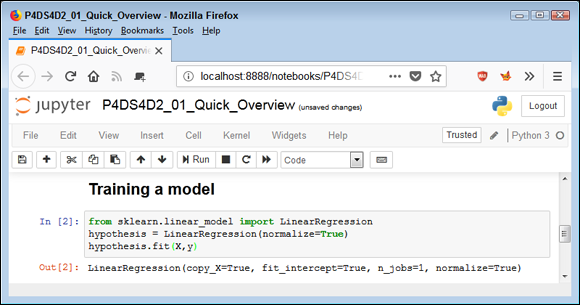
FIGURE 1-2: Using the variable content to train a linear regression model.
Viewing a result
Performing any sort of analysis doesn’t pay unless you obtain some benefit from it in the form of a result. This book shows all sorts of ways to view output, but Figure 1-3 starts with something simple. In this case, you see the coefficient output from the linear regression analysis.

FIGURE 1-3: Outputting a result as a response to the model.
One of the reasons that this book uses Jupyter Notebook is that the product helps you to create nicely formatted output as part of creating the application. Look again at Figure 1-3 and you see a report that you could simply print and offer to a colleague. The output isn’t suitable for many people, but those experienced with Python and data science will find it quite usable and informative.