144 Quality Assurance
Given the answers to these questions, the team will develop an overall
plan and dene the requirements of the review process to make sure the
goals are being met. Typical questions may be
• What precisely did you notice?
• How did you feel?
• What (if anything) would you like to do differently?
Step 3. Define and Establish Process Controls
Once the rst two steps have been completed, then the owners of the process
should begin the determination of sampling, frequency, and calculating the
voice of the process (control limits). The notion of determining the appropri-
ate and applicable sampling and frequency is based on determining the cor-
rect control on critical and signicant process parameters as well as establish
dominant process factors that inuence process output.
The process of dening and establishing controls is very important and
depends on sampling and frequency, as well as the data involved in the
process. For sampling and frequency, the selection is based on the assump-
tion that both reect the current process. This means that the sample and
frequency are representative of the process pattern and a reection of the
population. As for the data, consideration must be given to what type of data
is used. There are two types:
1. Variable or measured: Examples are length, viscosity, weight, time,
temperature, pressure, dimension, and so on.
2. Attribute or countable: Examples are pass/fail, go/no go, present/
absent, yes/no, and so on.
The preferred choice of data is variable because there is a greater sensitiv-
ity of variability and there is greater exibility for analysis. With attribute,
both the sensitivity and exibility are missing. Depending on what data the
process generates or the process owner decides to choose, the selection of
control charts will be different. For example, with variable data, the X bar,
R chart, medium chart, individual moving range, standard deviation range
chart, CUSum, and other charts may be utilized. With attribute charts, the p,
u, np, c, and other charts may be used. The goal here is to remove all assign-
able causes, and develop a consistent and stable process so that capability
may be calculated. The calculated control limits will identify whether the
process is consistent and stable enough to pursue capability study. Only ran-
dom variation (common cause variation) is allowed for studying capability of
the process. Unless the process is normally distributed (all assignable causes
have been removed), capability cannot be calculated. If data is not normally
distributed, sometimes by transforming the data (via Wilk’s lambda [λ] or
145Statistical Process Control (SPC)
Box-Cox functions or some other transformation function) we can proceed
to capability as the transformed data become normal. If, after transforming
the data, the distribution does not follow normality, you should start all over
again and make sure you review the steps to nd what is really going on
with the process or maybe the selection of the data.
Yet another benet of establishing the voice of the process is to assure that
the dened standards of performance are related to the customer’s demands
as well as the organization’s demands. Therefore, performance is monitored for
all critical/signicant process parameters and product characteristics via (a)
variable data/charts (the preferred approach) to establish target value and mini-
mize variation, and (b) attribute data/charts to dene/demonstrate the mini-
mum acceptable and unacceptable levels of nonconformance. The preferred
goal is zero defects and zero nonconformities. These approaches depend on
two very important perspectives: (a) technical—ideas, tools, and methodolo-
gies used to achieve customer needs and expectations, and (b) historical—
experiences based on things gone wrong (TGW) and things gone right (TGR)
of past practices on the same or similar processes. In essence, these are com-
parative studies that relate controls to past process events. Typical relation-
ships of control to process events may be divided into four activities.
• Before the event activities, such as
• Quality Function Deployment (QFD). Translating the customer
wants into engineering requirements
• Design of Experiments (DOE). Identifying and quantifying
within and between variation as well as interaction between
factors
• Failure Mode and Effects Analysis (FMEA). Identifying potential
failures and suggesting appropriate controls
• During the event activities, such as
• SPC on process parameters. Monitor a process for vital indicators.
• After the event activities, such as
• Inspection
• SPC on product
• Characteristics reports
• Activities that may be performed before, during, after the event, such
as error proong, which is 100% prevention or detection at source,
contact/non-contact devices.
No matter where they are performed, the purpose of these activities is to
establish an accurate, appropriate, and applicable system for measurement
and reporting of performance. This system should be as simple as possible,
such as a technician taking simple measurements (e.g., temperatures, length,
146 Quality Assurance
etc.). It must be noted here that quite often these activities may be complex,
such as, plant-wide SPC system to customer-specic standard or require-
ment, a pattern of running the process as is and taking measurements, or
interpreting results at least with signals that indicate the possibility of out of
control conditions. The signals used most often are
1. Out of control points
2. Run of seven points (in a run, the points do not cross the center line)
3. Trends of seven points (in a trend, the points cross the center line)
4. Points too close to the limits (process repeats every so often but the
points are creating gaps; it is an indication of a mixing issue)
5. Cycles (process repeats every so often; points are continuous)
6. Hugging (points suddenly are hugged around the center line or have
shifted above or below the center line without adjustment of the con-
trol limits)
Perhaps one of the most important and critical issues in this step is to rec-
ognize and make sure that the measurement system used is veried as valid.
Chapter 16 discusses measurement system analysis (MSA) in more detail.
Here, we emphasize that the measurement verication and validity is an
issue of
• Verifying the validity of a signal or message that the measurement
indicates
• Evaluating signicance of a signal or message
• Evaluating options for improvement and taking actions as needed
on
• Action on process to bring out-of-control conditions into control
• Action on output to prevent nonconforming output from reach-
ing the customer
Step 4. Continuously Improve Process Performance
The nal step to SPC is to make sure that the variation is controlled and
minimized. As such, the process of continual monitoring is a never-ending
one, unless the variation is zero, which is impossible. Because of this never-
ending journey, the effort to reduce variation with the systematic approach
that we just discussed is continuous. That approach is
• Understand process from start to nish
• Dene process goals
• Understand how to achieve goals

147Statistical Process Control (SPC)
• Focus on key elements
• Monitor, evaluate, and improve
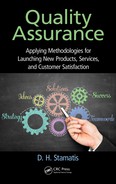
Now that we know the rationale of the SPC, let us summarize the steps
for its implementation. Everyone dealing with SPC must be aware of seven
distinct steps. They are shown in Figure 12.2. Of special importance is Step7,
which assesses process capability. Indeed, it is the nal step of any SPC
endeavor because before capability is established, the process must be con-
sistent, stable, in control (no special causes), and normally distributed. If any
one of these requirements is not met, capability cannot be calculated. For a
detailed discussion on this issue, see Stamatis (2003), Wheeler (2000a,b, 2010),
and Bothe (1997).
To make sure the supplier follows this approach, we have some key
questions that must be answered for every step. They are by no means
exhaustive, but hopefully they will be helpful. For individual organiza-
tions and specic processes, the list may be modied to reect their specic
requirements.
• Step 1 questions
• How does the supplier select SPC characteristics (or process
parameters)?
• Are the supplier’s SPC procedures and work instructions
adequate?
• Step 2 questions
• How does the supplier determine sampling frequency?
• How does the supplier determine subgroup size?
• Are control charts appropriate for the processes and the data
collected?
• Under what circumstances does the supplier recalculate control
limits?
• Step 3 questions
• Does the supplier employ, at a minimum, gauge calibration
(bias), gauge repeatability and reproducibility (R&R) analysis?
Step 1
Identify
characteristic(s)
or parameter(s)
to measure
and monitor
Develop
sampling plan
Conduct
measurement
systems
analysis (MSA)
Collect data or
measurements
Create control
chart(s)
Interpret control
chart(s) and
recommend
actions
Assess process
capability
Step 2 Step 3 Step 4 Step 5 Step 6 Step 7
FIGURE 12.2
Seven-step approach to SPC implementation.
148 Quality Assurance
• Does the supplier check linearity of the gauge (i.e., bias across the
gauge’s measurement range)?
• Does the supplier properly use measurement systems and
studies?
• Steps 4 and 5 questions
• Does the supplier apply an appropriate process for collecting
data and creating control charts?
• Is the supplier using statistical control limits? Statistical control
limits are the voice of the process. They should never be con-
fused with customer specications. They are not the same.
• Step 6 questions
• How many of the applicable out-of-control tests is the operator
using?
• What is the recommended reaction to out-of-control signals?
• Does the chart indicate that corrective actions are effective?
• When the supplier nds a signal, how does the supplier quaran-
tine production? How far back (in time or in number of pieces)
does the supplier quarantine product? Is it effective?
• Step 7 questions
• Are the supplier’s process capability and/or performance indices
valid? Make sure they are using P
pk
and not C
pk
. The difference is
that P
pk
is using actual data for calculating the standard deviation,
whereas C
pk
is using estimated data for the standard deviation.
• Do the supplier’s process capability and/or performance indi-
ces meet customer expectations? Minimum expectation for the
PPAP approval is P
pk
of 1.67 or greater and for long-term full pro-
duction, P
pk
is expected to be no less than 1.33. In both cases, the
bigger the number, the better it is.
SPC and Six Sigma
As we have seen, SPC is a very powerful yet simple methodology to identify
special causes, remove them, and generate stability in a process to eventu-
ally calculate capability. There is also a much more powerful yet difcult
methodology that focuses on more demanding problems of the process and
that is the Six Sigma approach. As powerful as the methodology is, however,
it uses SPC in every stage of its evaluation for both the traditional Six Sigma
model (DMAIC) and the more advanced version of the design for the Six
Sigma model (DCOV).
..................Content has been hidden....................
You can't read the all page of ebook, please click here login for view all page.