
247Measurement System Analysis (MSA)
Gage R&R (AN
OVA) for data
3.
2.
1.
6.
5.
4.
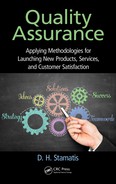
Xbar chart by operators Operators*parts interaction
Keith is different?
should be out-of-control;
op
erator patterns similar
Parts representative?
of process variation
should be in-control
By operators
By parts
3.25
Sample meanSample rangePercent
3.15
3.05
Jennifer
Jennifer
Jennifer
Keith
Keith
Nate
Nate
KeithNate
Jennifer
Operators
Keith
Nate
Parts
Parts
Operators
3.25
3.0SL = 3.182
X
–
–
= 3.159
–3.0SL = 3.135
–3.0SL = 0.00E+00
3.0SL = 0.05921
R
–
= 0.02300
3.25
3.25
3.15
3.15
3.05
3.05
3.05
12345678910
12345678910
0.08
0.06
0.04
0.02
0.00
100
50
0
Gage name:
EN/FN Gage 18.09 Plate
10/24/00
Nate McCall
Date of study:
Reported by:
Tolerance:
Misc:
R chart by operators
Components of variation
Gage R&R
Repeat
Reprod
Part-to-part
Average
%Contribution
%Study var
%Toler
FIGURE 16.13
Typical graphical output of Minitab
®
for variable data MSA.
248 Quality Assurance
Graphical Output: Six Graphs in All
The six items that we just mentioned might be separated into two categories
(see Figure 16.14). They are the health side and the troubleshooting side.
Destructive Test
When we are conducting a destructive testing, we are interested in a nested
approach of gauge R&R MSA. The output for a nested gauge R&R is similar
to the normal output and is shown in Figure 16.15.
Chart Output Interpretation
Now that we have identied the process of entering data and selection of the
appropriate analysis, and we have shown the typical outputs of the Minitab
®
software in reference to the MSA, let us attempt to interpret the results.
• Tall bar charts: Distinguishes the components of variation in per-
centages (%)
• Repeatability, reproducibility, and parts (want low-gauge R&R,
high part-to-part variation)
• R chart: Helps identify unusual measurements
• Repeatability/resolution (no outliers permitted)
• Xbar chart: Shows sampled process output variety
• Reproducibility/sensitivity (want similar patterns for each
operator)
The leading graphical indicators with which the evaluator should be con-
cerned the most are
• Bar charts for components (see Figure 16.16)
• Look at the R chart rst, then Xbar chart (see Figure 16.17)
• More R chart indicators (see Figure 16.18)
• ANOVA tabular output % (see Figure 16.19)
Explanation of Some of the % Numbers
% StudyVariation =
σ
R&R
σ
TOTAL
*100
If the gauge does not pass %Study, it cannot perform the job of process
control (it will not be able to adequately distinguish one part from another).
Anything less than 10% is very good. Anything less than 30% is acceptable.

249Measurement System Analysis (MSA)
200
100
0
123
123
0.15
0.10
0.05
0.00
1.1
1.0
0.9
0.8
0.7
0.6
0.5
0.4
0.3
1.1
1.0
0.9
0.8
0.7
0.6
0.5
0.4
1.1
1.0
0.9
0.8
0.7
0.6
0.5
0.4
1.1
1.0
0.9
0.8
0.7
0.6
0.5
0.4
12
12 3
345678 910
1
2
3
Operator
Operator
Part
Part
2345 67 8910
Gage R&R
Repeat
Gage R&R (ANOVA) for response
Reprod
Part-to-part
Gage name:
Date of study:
Reported by:
Tolerance:
Misc:
%Contribution
%Contribution
%Study var
%Tolerance
Sample mean Sample range Percent
Average
Xbar chart by operator
R chart by operator
Components of variation
Operator*part interaction
By operator
By part
UCL = 0.1252
R
–
= 0.03833
LCL = 0
UCL = 0.8796
Mean = 0.8075
LCL = 0.7354
If only one operator,
you won’t get
these graphs
If nested study,
you won’t get this
graph
MSA
health
side
MSA Troubleshoot side
FIGURE 16.14
Typical output of the health and troubleshooting side of the graphical output.

250 Quality Assurance
Gage name:
Date of study:
Reported by:
Tolerance:
Misc:
Gage R&R (Nested) for response
100
50
0
5
4
3
2
1
0
18
17
16
15
14
13
12
18
17
16
15
14
13
678910 11 12 13 14 15 12345
18
17
16
15
14
13
Components of variation
Xbar chart by operator
R chart by operator
Part
operator
Sample mean Sample range Percent
Gage R&R
Billie Nathan Steve
Billie Nathan Steve
Billie Nathan Steve
Billie Nathan Steve
Repeat Reprod Part-to-part
%Contribution
%Study var
By operator
By part (operator)
Operator
Operator by process output interaction
is not applicable
UCL = 4.290
UCL = 17.62
LCL = 12.68
Mean = 15.15
R
–
= 1.313
LCL = 0
FIGURE 16.15
Nested gauge R&R.

251Measurement System Analysis (MSA)
150 12 3
12 3
UCL = 124.0
UCL = 797.1
Mean = 725.7
R
–
= 37.97
LCL = 0
LCL = 654.3
R chart by operator
Xbar chart by operator
Want: R chart in controlXbar: at least 50% outside limits
Xbar chart: test
of sensitivity,
reproducibility and
population variety
Range chart (each
point is the range of
repeated
measurements of the
same part): exposes
gage repeatability,
resolution and control
Inside control
limits: blind spot
of the gage
Sample rangeSample mean
100
1200
1100
1000
900
800
700
600
500
400
300
50
0
FIGURE 16.17
Evaluation of the R chart and the Xbar chart by operator.
Gage R&RRepeatReprodPart-to-part
Gage R&R Repeat Reprod
Answers: “Where is the variation?”
Much better
Needs help
Part-to-part
%Contribution
%Study var
%Contribution
%Study var
Components of variation
Components of variation
100
50
0
100
50
0
Percent
Percent
Gage R&R ANOVA for score
FIGURE 16.16
Bar chart for components.
..................Content has been hidden....................
You can't read the all page of ebook, please click here login for view all page.