
242 Quality Assurance
Step 1: Take all measurements in a random order to ensure that any drift or
changes that occur will be spread randomly throughout the study.
Step 2: Estimate all readings to the nearest number possible. At a mini-
mum, all readings should be taken at ½ of the smallest gradation.
Step 3: If operator calibration is suspected to be a major inuence on
variation, the gauge should be recalibrated by the operator
before each trial.
Step 4: The study should be observed by someone who understands the
importance of the precautions required to conduct a reliable study.
Trials and Data Collection
The actual process begins by making sure that
• There are generally two to three operators.
• There are generally ve to ten process outputs to measure.
• Each process output is measured two to three times (replicated) by
each operator.
To use the variable data MSA, one must begin with the worksheet of the soft-
ware (Figure 16.6). Here we enter the raw data. Once the data is entered, then
we follow the rubrics for analysis in the manner shown in Figures 16.7 and 16.8.
Manipulate the Data
Once the data is in the work sheet, now we go to the commends to stack the
data. In Minitab
®
, this is a very important step. If stacking is not selected, the
analysis may not be correct.
Replicate 1 Replicate 2
(randomized order)
10 pr
ocess outputs
3 op
erators
2 replicates
Have Operator 1 measure all
samples once (as shown in the
outlined block)
en, have Operator 2 measure all
samples once
Continue until all operators have
measured samples once (this is
Replicate 1)
Repeat these steps for the required
number of replicates (parts in
random order)
Enter data into Minitab
®
columns as
shown
•
•
•
•
•
FIGURE 16.6
Data in worksheet.

243Measurement System Analysis (MSA)
Prepare the Analysis
Now that the data are appropriately stacked, we are ready to select our
analysis. Figure 16.9 shows the selection process. There are multiple oppor-
tunities to measure crossed gauge R&R, so make sure, for example, that the
appropriate and applicable method of analysis is chosen and that the error or
measurement can be estimated.
On the other hand, if a single opportunity measurement (nested gauge
R&R) is needed, make sure that the characteristics of the item being tested
or the components of the measurement process are no longer the same as
Your data in Minitab
®
may initially look
like this. You will need to STACK your
data so that all like data is in one
column only.
Use the commands
(Stack all process outputs,
operators, and responses so
that they are in one column only
.)
Now you are ready to run the
data analysis.
> Manip
> Stack
> Stack blocks of columns
FIGURE 16.7
Process for stacking the data.
Note:
c10, c11, c12 are the columns in
which the respective data are
found IN OUR EXAMPLE. You
must have ALL data STACKE
D in
these columns.
Enter titles
FIGURE 16.8
Data stacked and ready for analysis.

244 Quality Assurance
when the test began. It is important here to note that there is a need to collect
a batch of like parts (minimize within variation) for the measurement system
study. Some examples are
• Destructive testing
• Hardness testing
• Aging
• Chemical analysis
Choose a Method of Analysis
Generally, there are two approaches to the analysis. The rst is to use the
ANOVA method and the second is to use the Xbar and Rbar. Both are accept-
able. However, the ANOVA is much more powerful and it gives more infor-
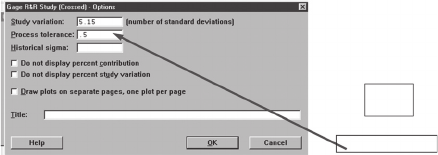
mation. Figure 16.10 shows the selection process and Figure 16.11 shows the
selection process if the tolerance is necessary.
> Stat > Quality To ols
> Gage R&R Study (Crossed)
> Gage R&R Study (Nested)
Use the commands
Each process output
measured by each
operator
OR
For “destructive tests”
where each process output
is measured uniquely by
each operator
(An outcome of a nested response is shown in Figu
re 16.15.)
FIGURE 16.9
Selection process for crossed gauge R&R.
ANOVA method is preferred
•
Gives more information
Enter gage
info and
options
FIGURE 16.10
Selection process for method of analysis.
245Measurement System Analysis (MSA)
MSA Graphical Six Panel
The typical output for a variable MSA is both numerical and graphical. Both
are shown in Figure 16.12.
Minitab® Graphical Output
The graphical output of Minitab
®
for a variable MSA is shown in Figure 16.13
with minimal comments.
What We Look for in These Charts
An output of software is useless unless one knows what one is looking at
and for. The following is an overview of the generic concerns that should be
examined.
1. Total gauge R&R < 30% (% study variation), and part-to-part to be
the biggest contributor (similar to that shown).
2. R chart must be in-control. An out-of-control range chart indicates
poor repeatability. In addition, you want to see ve or more levels
(look across the points) of range within the control limits.
3. Xbar chart must be 50% out-of-control or more (indicating the mea-
surement system can tell a good part from a bad part) and similar
patterns between operators.
4. Spread of the 10 MSA parts should represent the actual process
variation.
5. The operator means should be the same (straight line).
6. Lines should be parallel and close to each other. This indicates good
reproducibility.
Upper specification
limit (USL)
minus
Lower spec
ification
limit (LSL)
For this example:
USL = 1.0
USL – LSL = 0.50
(Note: Industry standard set at 5.15 standard deviations, if supplier uses 6.0,
comparisons will show larger error than with industry.)
LSL = 0.5
FIGURE 16.11
Selection process for adding tolerance (optional).

246 Quality Assurance
200
Percent
Sample range
Sample mean
Average
1.1
1.0
0.9
0.8
0.7
0.6
0.4
1
1
1
2
3
23
2345678910
123456 78910
0.5
1.1
1.0
0.9
0.8
0.7
0.6
0.4
0.5
1.1
1.0
0.9
0.8
0.7
0.6
0.4
0.5
100
0
Gage R&RRepeat
Components of variation
Gage R&R (ANOVA) for response
What does all this mean?
Graphs
Session window
By part
By operator
Operator*part interaction
R chart by operator
Xbar chart by operator
Reprod Part-to-part
%Contribution
%Study var
Gage name:
Date of study:
%Tolerance
123
123
0.15
0.10
0.05
0.00
Operator
Part
Part
UCL = 0.1252
UCL = 0.8796
Mean = 0.8075
R
–
= 0.03833
LCL = 0
LCL = 0.7354
Operator
1.1
1.0
0.9
0.8
0.7
0.6
0.5
0.4
0.3
Reported by:
Tolerance:
Misc:
Tw
o-way ANOV
A table with interactio
n
Gage R&R
FIGURE 16.12
Minitab
®
output for variable MSA output.
..................Content has been hidden....................
You can't read the all page of ebook, please click here login for view all page.