
3
Mechanism and Physiologically Based PK/PD Model in Assisting Translation from Preclinical to Clinical: Understanding PK/PD of Therapeutic Proteins at Site‐of‐Action
Xi Chen1 and Weirong Wang2
1Bristol‐Myers Squibb, Clinical Pharmacology and Pharmacometrics, Route 206 and Province Line Road, Princeton, NJ, 08543 USA
2Janssen BioTherapeutics (JBIO), Janssen R&D, Biologics Development Sciences, 1400 McKean Road, Spring House, PA, 19447, USA
3.1 Introduction
Understanding the Exposure–Response (ER) relationship is critical for translation of biologics from preclinical to clinical stage and for projection of safe and efficacious doses in humans. The mechanism of action (MOA) of biologics commonly involves binding to specific target, and the extent and duration of target engagement (TE) drives down stream pharmacological effects. For biologics against therapeutic target in central circulation, ER relationship can usually be established correlating plasma or serum exposure with target engagement and drug efficacy measurements. However, for biologics whose targets reside in tissues, their concentration and target engagement at the tissue site of action is what associates directly with the pharmacological effects. Moreover, the preclinical animal models used to assess drug effect can be of considerable difference from the clinical scenarios. Thus, simple extrapolation based on ER relationship in plasma/serum may be misleading, and the specific differences in target expression profile, physiology and disease pathophysiology between plasma/serum and tissue site of action, and between preclinical models and humans must be considered. Mechanism and physiologically based pharmacokinetics (PBPK)/pharmacodynamics (PD) modeling approaches are valuable tools to quantitatively characterize and account for the differences in biologics tissue distribution, target dynamics, and target binding, etc., and thus facilitate more reliable translation of biologics from preclinical to clinical stages. This chapter reviews current progress and potential challenges in this area. Emphasis is placed on providing a few case examples showing how mechanistic PBPK/PD models can be utilized to decipher the underpinnings of biologics ER relationship and to showcase value of such modeling in the transitions of biologics at the preclinical–clinical interface. This chapter will also focus on monoclonal antibodies (mAbs) and Fc‐fusion proteins, the major class of biologics in preclinical and clinical development.
3.2 Biologic Distribution to Tissue Site of Action
3.2.1 Overview
Unlike small molecule drugs, the rate and extent of biologic tissue distribution is determined by three processes: tissue uptake from blood circulation, target binding and subsequent degradation/internalization, and elimination from tissue site. Biologic tissue uptake process can include paracellular convection, diffusion, and possible FcRn‐mediated endocytosis and transcytosis for mAbs and Fc‐fusion proteins [1,2]. The dominant tissue uptake pathway for biologics is through paracellular convection [3,4], which is governed by plasma‐to‐tissue fluid exchange rate and the sieving effect of paracellular pores in the vascular endothelium [4,5]. Once present in tissues, biologics are distributed into the space composed of interstitial fluid and bind to their targets, either in the interstitial fluid (soluble) or on cell surface (membrane‐bound). Binding to membrane‐bound target anchors biologics on the surface of tissue cells, which may lead to longer tissue retention of biologics and subsequent degradation upon internalization [6]. Elimination of other biologics from tissues is expected to be mainly driven by lymph drainage [5].
Tissue distribution kinetics of biologics is affected by multiple factors including molecular structure, tissue vascular endothelium, target binding, and disease status. Distribution of biologics varies in tissues with tissue vascular endothelium permeability. In the absence of specific target binding, the tissue concentrations of biologics are usually proportional to that in plasma, regardless of dose, time and animal species, and the plasma/tissue ratio is mostly determined by tissue vascular endothelium permeability. The plasma/tissue relationship for mAbs had been characterized using an antibody biodistribution coefficient (ABC) [7]. The calculated ABC across different tissues suggested more extensive mAb exposure in tissues with fenestrated vascular endothelium, such as liver, spleen, and kidney, whereas limited exposure at tissues with continuous vascular endothelium, including muscle and fat. Also, biologics with various molecular sizes exhibit different levels of tissue penetration. Using various antibody fragments of known molecular weight from 27 to 150 kDa, the extent of their tissue exposure was found to follow a simple exponential relationship based on molecular weight [8].
For a biologic with specific target at a given tissue site, its distribution can be significantly impacted by the target interaction [9]. For example, highly expressed cell surface target at a tissue site usually leads to an increase in the accumulative tissue uptake of biologics [10]. For biologics against cell surface target, the internalization and subsequent degradation of biologics upon target binding may reduce the tissue exposure of intact biologics [11–15]. Lastly, tissue distribution of biologics can be altered under certain disease conditions, such as inflammation‐associated increase in vasculature permeability, elevation in interstitial fluid pressure, or ascites and pleural effusion seen in some cancer patients [16]. Understanding the distribution of biologics into tissues with target expression is crucial for understanding its ability to engage the target and exert the pharmacological function at the tissue site of action.
3.2.2 Bioanalytical Methods for Biologics at Tissue Sites
Examination of biologics tissue distribution relies on well‐established bioanalytical methods and experimental techniques. Traditionally, biologics tissue concentrations are measured from tissue homogenate, which are averaged concentrations comprising a mixture of vascular, interstitial, and cellular concentrations [4,17]. Biologics only distribute in the tissue interstitial space and bind to their specific targets therein, making interstitial concentration the driving force for the pharmacological effect. Interstitial concentration of biologics can be derived from total tissue concentration by correction of residual blood contamination and interstitial volume proportion to overall tissue volume [18]. Effort has also been made to develop new experimental techniques for direct assessment of biologics concentrations in tissue interstitial space. Wiig and Swartz summarized various techniques for tissue interstitial fluid sampling [16]. Even though there is still no well‐accepted “gold standard” method for direct measurement of biologics interstitial concentrations, studies using these techniques have reported measurements of biologics interstitial concentrations in various tissues and provided valuable insight for biologics distribution kinetics at tissue site of action [19–22]. Recently, a comprehensive assessment of biologics distribution in tissue interstitial fluid was conducted in mice by tissue centrifugation using an anti‐interleukin (IL)‐17 mAb as a model compound [20]. Eleven tissues including adipose, bone, brain, gut, heart, kidney, liver, lung, muscle, skin, and spleen were examined.
Distribution of biologics to the specific tissue site of action under disease conditions had also been evaluated. Etanercept is a dimeric fusion protein for the treatment of rheumatoid arthritis (RA). It consists of two ligand‐binding domains of human p75 tumor necrosis factor receptor (TNFR) and the human immunoglobulin G1 (IgG1) Fc portion. Skin interstitial concentrations of etanercept were examined in healthy and collagen‐induced arthritic (CIA) rats using suction blister technique [22]. It is noted that etanercept showed moderate distribution in skin interstitial fluid and its concentration was about 30% relative to plasma concentration when equilibrium was reached. Importantly, enhanced skin interstitial exposure of etanercept was observed in CIA rats in comparison with healthy controls, suggesting that inflammation increases the rate and extent of biologics tissue distribution. An anti‐mouse IL‐6 mAb has also been used as a model compound to study biologics distribution in joint synovial fluid in healthy and CIA mice [19]. Joint lavage was applied for synovial fluid sampling. The test antibody concentrations in joint lavage fluid were significantly higher in CIA mice relative to healthy controls, suggesting increased tissue distribution of mAb in inflamed arthritic joints.
Dermal interstitial fluid concentrations of secukinumab, a recombinant fully human mAb that selectively targets and neutralizes IL‐17A for the treatment of moderate‐to‐severe plaque psoriasis (PsO), have been examined in healthy subjects and psoriatic patients [21]. Corroborated with findings in rodents [22], dermal interstitial fluid concentrations of secukinumab relative to serum in psoriatic patients are shown to range from 28% to 39%, higher than that in healthy subjects (23%).
3.2.3 Full PBPK Model and Minimal PBPK (mPBPK) Model
Tissue distribution data like the ones described above makes it possible to develop PBPK models for biologics. PBPK models have proved to be a highly valuable tool to characterize biologics tissue distribution kinetics and assess key impacting factors. A full PBPK model incorporates key physiological and anatomical components at the whole‐body, tissue, and subtissue levels. It includes all major tissue and organs connected in the anatomical manner with blood and lymph flows [7,18]. Each tissue compartment comprises vascular, endosomal, and interstitial spaces [7]. If the target is membrane‐bound, an additional cell space should be included. The model also involves all contributing pathways for biologics tissue distribution: (i) paracellular convection driven by plasma flow; (ii) FcRn‐mediated endocytosis and transcytosis for mAbs and Fc‐fusion proteins; and (iii) removal from tissue site via lymph drainage and other elimination pathways. In such way, a PBPK model uses physiological relevant volume and flows and provides physiological meaningful parameter values compared with the empirical pharmacokinetic (PK) models. The PBPK model can also include any specific contributing pathway for the distribution of a given biologic to any tissue of interest, making it flexible and useful for assessment of different impacting factor on biologic tissue distribution.
The development of a full PBPK model relies on the measurement of concentration‐time‐profiles in plasma or serum and all major tissues and organs. When only plasma or serum concentration data are available, a minimal physiologically based pharmacokinetic (mPBPK) model provides a mathematically and computationally alternative to inform PKs and tissue distribution characteristics [3,23].
The “first‐generation” mPBPK models provide a suitable modeling platform for assessing PK characteristics of small molecule entities as well as smaller size proteins and peptides, as shown in Figure 3.1 [23]. Inheriting and lumping all major physiologic attributes from full PBPK models, the first‐generation mPBPK model includes a blood/plasma/serum compartment and one or two lumped tissue compartments connected by blood flow. Distribution of drug molecules to tissues is driven by Fick's Laws of perfusion and diffusion. The “second‐generation” mPBPK model was designed specifically for mAbs and Fc‐fusion proteins (Figure 3.2) [3]. It adapts all essential components of mAb/Fc fusion PKs derived from full PBPK models. Plasma/serum, lymph, and tissue compartments are connected in anatomical manner. Tissues are lumped into two compartments (tight or leaky) based on their vascular endothelial structure (continuous or fenestrated). Paravascular convection and lymph drainage are assumed to be the dominant pathways for a mAb's uptake and removal from tissues. Tissue interstitial space is assumed to be the major extravascular distribution space.

Figure 3.1 First‐generation mPBPK model with additional target/elimination tissue compartment for small proteins and peptides. Model includes plasma compartment (V p), two types of tissue compartments (V 1 and V 2), and an additional target/elimination tissue compartment (V T). Distribution to tissues is assumed driven by perfusion and diffusion. Q CO and Q T are cardiac plasma flow and plasma flow to target/elimination tissue. f d1 and f d2 are the fractions of Q CO for each lumped tissue compartment and f dT is the fraction of Q T for target/elimination tissue. K p is the tissue partition coefficient.
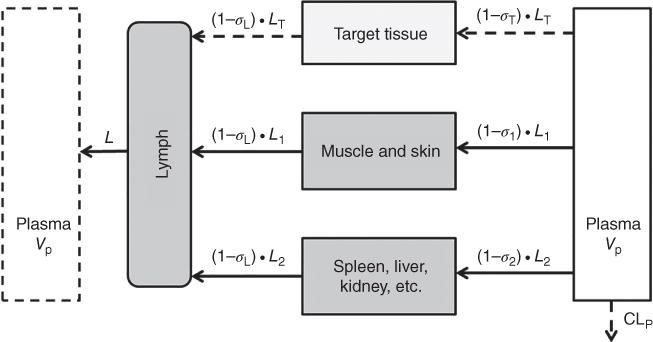
Figure 3.2 Second‐generation PBPK model with an additional target tissue compartment. Tissues are lumped into two spaces according to their vascular structure. Tissue compartments are connected with plasma and lymph in an anatomic manner. Convection and lymphatic drainage are assumed to be the dominant tissue uptake and elimination pathways. When concentration measurements of biologics in target tissue are available, an additional tissue compartment could be implemented for assessment of biologic tissue distribution. L, L 1, L 2, and L T represent total lymph flow, lymph flow to each lumped tissue compartment, and target tissue compartment. σ 1, σ 2, and σ T, are vascular reflection coefficients for two lumped tissue compartments and target tissue compartment. σ L is the lymph reflection coefficient.
Importantly, for any specific tissue of interest, e.g. tissue site of action, additional compartments could be incorporated in the either the first‐ or the second‐generation mPBPK models, using tissue‐specific measurements to characterize drug distribution and target modulation at this tissue of interest. With the physiological and anatomical layouts and the flexibility to include extra tissue compartment and implement target‐mediated drug disposition (TMDD) features, mPBPK models also allow assessment of the interaction between two entities distinctive tissue distributions and elimination properties by overlaying two mPBPK models for each component. For example, Chen et al. showed an extended application of mPBPK models to assess tumor necrosis factor‐α (TNF‐α) suppression mediated by infliximab by overlaying the second‐generation mPBPK model for infliximab and the first‐generation mPBPK model for rhTNF‐α [24,25]. The TMDD feature was included in the plasma compartment to characterize the interaction between infliximab and TNF‐α. Overall, mPBPK models inherit and lump major physiologic attributes from whole‐body PBPK models and generate physiologically relevant PK parameters with only assessing drug concentration measurements in blood or plasma, and provides the flexibility for focused assessment of any tissue of interest.
3.2.4 Application of PBPK and mPBPK Models to Facilitate Understanding of Biologic Tissue Distribution
RA and PsO are both chronic inflammatory diseases. RA attacks not only synovial tissues but also affects other organs, such as heart, skin, and kidney [26]. PsO is featured of inflammatory skin disorder with circumscribed, scaling, and erythematous plaques [27,28]. Though the pathogenesis of RA and PsO are still not fully understood, many soluble proinflammatory cytokines including TNF‐α, IL‐1, IL‐6, IL‐17, and IL‐23 are found to play key roles in the disease initiation and propagation of these diseases [29–31]. There are many biologics targeting TNF‐α, IL‐17, and IL‐23 on the market for the treatment of RA or PsO, such as anti‐TNF‐α (infliximab, etanercept), anti‐IL‐17 (secukinumab, ixekizumab), anti‐IL‐12/IL‐23 (ustekinumab), anti‐IL‐23 (guselkumab), and more in different stages of drug development [32–35]. In patients with RA and PsO, inflammatory cytokines showed increase in expression and function at the corresponding diseased tissue sites. Therefore, quantitative assessment of the tissue distribution and target modulation at site of action for a cytokine neutralizing biologic will benefit the understanding of their ER relationships. Tissue distribution of a TNF‐α inhibitor etanercept and an anti‐IL‐6 mAb CNTO 345 to the inflamed ankle joint in CIA animal disease models were examined with both full PBPK and second‐generation mPBPK modeling approaches [22,36]. These modeling efforts have successfully characterized the tissue distribution concentration‐time profiles of the studied agents. The modeling results showed that inflammation led to about twofold increase in joint synovium vasculature leakiness [22], which are in good agreements with sparse data of etanercept concentrations in synovial fluid in RA patients [37]. Also, the model has estimated that lymph flow rates in normal and inflamed ankle joints are 0.0024 and 0.0128 ml d−1, which are consistent with the lymph flow rate reported and derived from the literature [38]. Another second‐generation mPBPK modeling work has been done to characterize dermal tissue distribution of an anti‐IL‐23 mAb, CNTO 3723, in a mouse psoriasis‐like (PsL) disease model [39]. Modeling results suggested that 10% and 25% of CNTO 3723 exposure in dermal interstitial fluid relative to serum concentration in healthy and PsL mice, respectively, which are consistent with previous study of secukinumab skin distribution in healthy subject and psoriatic patients (23% and 28%) [21].
Besides characterization of biologic tissue distribution kinetics, mechanistic PBPK modeling approach provides parameter values that are physiologically meaningful and enable rational scale‐up across species and human. Shah and Betts have developed a full PBPK model capable of characterizing the plasma and tissue PKs of both nonspecific and target‐specific mAb in wild‐type, FcRn knockout, tumor‐bearing, and nontumor bearing mice [40]. The model was then applied as a platform to describe the plasma PK of mAbs across species in mouse, rat, monkey, and human with a common set of model parameters, demonstrating the potential of PBPK model in scale up and allowing reliable predictions across preclinical species and human.
3.3 Target Engagement of Biologics at Site of Action
3.3.1 Overview
Most of biologics elicit their therapeutic effect through binding to their targets, either soluble or membrane bound, which subsequently leads to blockage, inhibition, or stimulation of these targets. For biologics against membrane‐bound targets, the magnitude of its pharmacological response often correlates with target occupancy at the site of action. For biologics against soluble targets, its pharmacological response often correlates with the extent and duration of free target suppression at site of action. Binding of biologics toward membrane‐bound targets has been well discussed previously elsewhere [41–45], and this chapter will only focus on the interaction of biologics and soluble targets.
The interaction of biologics and their soluble targets could also be described by the kinetic representation of a TMDD model [6]. The key determining factors for this target‐binding process are PK, target‐binding affinity, target dynamics, and elimination rate of the formed biologic–target complex. For conventional biologics against a single target, higher binding affinity will simply shift the binding diagram toward more target binding and complex formation. For biologics against multiple targets (e.g. bi‐specific or tri‐specific antibodies) kinetic modeling is often required to identify the appropriate binding affinity ranges that would favor the formation of desired complex.
Target dynamics plays an important role in determining the ability of biologics to suppress free soluble target. The impact of target dynamics had been nicely demonstrated by Wang et al. in 2014 with IL‐6 and siltuximab [46]. IL‐6 is a soluble inflammatory cytokine with rapid turnover in systemic circulation. Siltuximab is an IL‐6 antagonist biologic therapy agent for the treatment of multicentric Castleman's disease (MCD). It was shown that dose of siltuximab in cynomolgus monkeys led to significant increase in serum total IL‐6 concentration and that the free IL‐6 returned to baseline while significant excess of siltuximab was still present in the serum. A mechanistic PK/TE/PD model was developed to characterize the interplay between siltuximab and IL‐6 in cynomolgus monkeys [46]. The model showed that the return of free IL‐6 to baseline in presence of significant excess of siltuximab can be attributed to the dissociation of IL‐6/siltuximab complex.
The impact of target dynamics on IL‐6 target engagement at tissue site of action had also been characterized in a CIA mouse model [19,36]. The time‐course of free IL‐6 suppression by an anti‐IL‐6 mAb CNTO 345 in both systemic circulation and at the joint was studied [36]. Significant serum IL‐6 baseline elevation was observed in CIA mice in comparison with healthy controls. It was shown that treatment of CNTO 345 led to significant increase in serum total IL‐6 concentration and that the free IL‐6 returned to baseline, while significant excess of CNTO 345 was still present in the serum. Surprisingly, the lowering of free IL‐6 in the joint synovial fluid was found to be as effective as that in serum, despite the ∼tenfold lower CNTO 345 concentrations and ∼ 10‐fold lower and higher baseline IL‐6 concentrations at the joint comparing to that in serum. This can largely be attributed to the lack of total IL‐6 accumulation in the joint synovial fluid.
Lastly, the elimination rate of the biologic–target complex can also impact the total target profile. In the first‐in‐human studies of two humanized IgG1 mAbs targeting IL‐13, the mAbs showed similar PK profiles, but very different total IL‐13 concentration profiles were observed [47]. This was attributed to an approximately 100‐fold faster serum elimination rate of the mAb/IL‐13 complex of one mAb over another. The difference in elimination rates of bound complex is expected to have an impact on the degree of free target inhibition.
3.3.2 Bioanalytical Methods to Understand Target Engagement by Biologics
Quantitative assessment of target suppression by biologics requires measurement of the biologic and target concentrations. Discussion has been initiated on current bioanalytical methods to quantify free and total mAbs and targets by the American Association of Pharmaceutical Scientists (AAPS) Ligand‐Binding Assay Bioanalytical Focus Group [48]. Quantification of target, especially the free target can be quite challenging [49,50]. First, many of soluble targets of therapeutic interest are often of very low abundance (e.g. TNF‐α baseline is ∼10 pg ml−1 in healthy subject and ∼20 pg ml−1 in RA patients [51], IL‐17 baseline is undetectable in healthy subjects and ∼2–3 pg ml−1 in PsO patients [52]), making it more challenging to measure the lowering of free target from the baseline with currently available bioanalytical methods, many of which with limit of quantification (LOQ) above the target baseline concentrations. Second, it is extremely difficult to measure free target in the presence of excessive amount of free drug and bound target without disturbing the equilibrium during sample analysis. A sample pretreatment step to separate free and total target is commonly used before quantifying the free target [19]. Development of the pretreatment procedure can be time‐ and labor‐consuming, as it is essential to minimize the possible dissociation of target/drug complex during the process [48]. It is important to qualify the bioanalytical methods and identify the assay limitations, which are often unavoidable, before interpreting the free and total target data [5,19].
For some therapeutic targets that are present in the body with extreme low abundance, animal studies had been conducted by boosting the target to a measurable level using exogenously dosed target along with biologics to enable assessment of their interaction and the in vivo elimination rates of free and bound target [24,39]. Though there will always be a question about the relevance of exogenous target, with appropriate study design and reagent quality control, this kind of study can generate data that may be used to inform target engagement under physiological conditions. One such example is with TNF‐α, the soluble proinflammatory cytokines that mediate many inflammatory diseases including RA. Biologics targeting TNF‐α has been the most successful class of therapeutic biologics in the treatment of RA and other inflammatory diseases [53], triggering more efforts in seeking new biologic candidates targeting TNF‐α with improved properties. The intrinsic low abundance of TNF‐α poses challenges to understand TNF‐α suppression by biologics. Chen et al. has characterized human recombinant tumor necrosis factor‐α (rhTNF‐α) PKs in rats together with a mPBPK modeling approach [25]. The model estimated parameters were applied to predict rhTNF‐α PK in monkeys, along with the physiological volumes and flow rates in monkeys, and the prediction agreed well with measured data from monkeys.
3.3.3 Mechanistic PBPK/PD Modeling to Facilitate Understanding of Target Engagement at Site of Action
Mechanistic modeling approaches that incorporate the TMDD components have been applied widely for characterization of the target binding and disposition kinetics of biologics. First brought up by Mager [6] and underwent mathematical and computational assessments and approximations [54,55], TMDD model quantitatively represents the binding of a drug to its pharmacological target and subsequent disposition process. For more detail about general TMDD and its modeling code, refer to Chapters 7 and 8 by Gibiansky.
As shown in Figure 3.3, TMDD can be incorporated into PBPK models for quantitative evaluation of target binding and suppression kinetics both in central circulation and at tissue site of action [56].
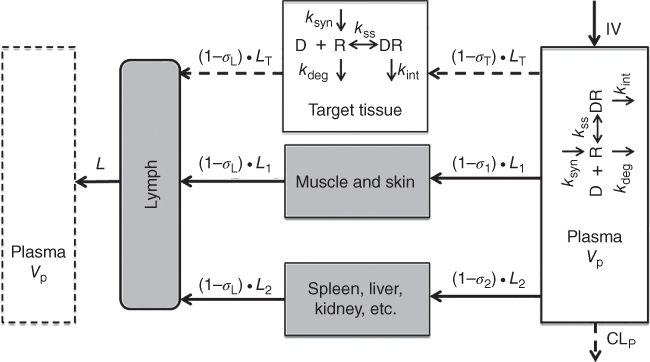
Figure 3.3 Second‐generation mPBPK model with TMDD implemented. Model scheme include TMDD features included in both plasma/serum and target tissue compartments. D, R, and DR represent free biologic drug, free target, and drug–target complex, respectively. k syn and k deg are synthesis and elimination rates of the free target and k int represents the elimination rate of the drug/target complex. K ss is the steady‐state dissociation constant.
When a therapeutic target is in central circulation, free target suppression in plasma/serum can be indicative of its pharmacological effect. For example, following siltuximab treatment, suppression of free IL‐6 in the serum of cynomolgus monkeys correlated well with the observed profiles of C‐reactive protein (CRP), an established biomarker for systemic inflammation [5]. In humans, free serum immunoglobulin E (IgE) suppression has been shown to correlate with clinical outcomes in asthma, following treatment of anti‐IgE antibody omalizumab [57,58].
However, the therapeutic targets for many biologic drugs reside and function at disease tissue site, and free target suppression at the tissue site of action is what drives the therapeutic effect. One example is with CXCL13, a chemokine constitutively expressed in secondary lymphoid tissues [59]. Along with CXCR5, CXCL13 regulates germinal center formation in secondary lymphoid tissues during an immune response, and it is a potential drug target for the treatment of autoimmune diseases with leukocyte tissue infiltration and/or germinal center involvement. Brodfuehrer et al. has quantitative assessed CXCL13 suppression by an anti‐CXCL13 neutralizing mAb in a T‐dependent mouse immunization (TDI) model in both serum and spleen [60]. Total mAb, total CXCL13, and free CXCL13 concentrations were analyzed in serum and spleen. A site‐of‐action model including serum and spleen compartments and TMDD incorporated in both compartments was applied for characterizing free CXCL13 suppression by mAb. This modeling work provided quantitative assessment of target suppression at the tissue site of action and enabled the characterization ER relationship of CXCL13 target coverage and pharmacological effects.
Understanding target suppression by biologics at tissue site of action requires measurements of both biologics and target in the tissue site, which are quite challenging. Therefore, target suppression in serum is sometimes assumed to be a surrogate to associate with the pharmacological effect and to establish ER relationship. However, the validity of this assumption is questionable. A thorough study has been performed recently to examine IL‐6 suppression by an anti‐IL‐6 mAb, CNTO 345, in both serum and joint synovial fluid in CIA mice [36]. A second‐generation mPBPK model was developed with an addition of joint synovial fluid tissue compartment and TMDD features included in both serum and joint compartments. The modeling assessment indicated that IL‐6 suppression differs greatly in joint synovial fluid from that in serum. These differences can be attributed to the limited tissue distribution of CNTO 345 in ankle joint synovial fluid, the significantly higher IL‐6 baseline in ankle joint synovial fluid in comparison with serum, and very importantly, the relative time‐scales of elimination rates among CNTO 345, free IL‐6, and CNTO 345‐IL‐6 complex in serum and ankle joint synovial fluid [36]. Model estimated clearance rates of both CNTO 345 and CNTO 345‐IL‐6 complex in joint synovium approximate ankle joint lymphatic flow rate are different from that in serum. The degradation rate of IL‐6 in synovium is estimated to be around 2.5‐fold of ankle joint lymphatic flow rate, which is over 100‐fold lower than that in systemic circulation. These results suggested that the kinetic processes of CNTO 345, IL‐6 and the formed CNTO 345‐IL‐6 complex in joint synovial fluid are mostly governed by tissue lymph drainage, which is an entirely different elimination pathway from that in systemic circulation [36]. These results strongly suggest that target suppression in systemic circulation cannot be used directly as a surrogate for target suppression in tissue site of action. However, mechanism and physiologically based models that incorporated essential determinants of the interaction between the biologic and its target can be an invaluable tool to enable translation from preclinical models to humans.
3.4 Translational Application of Mechanistic PBPK Modeling
As illustrated in the Sections 3.2.4 and 3.3.3, mechanistic PBPK modeling approaches have been applied to understand biologic tissue distribution, target dynamics, and biologic–target interaction at the site of action, which are all key underpinnings of the causal relationship of biologic exposure and pharmacological responses. These models can integrate knowledge from various sources, separate drug‐specific and system‐specific parameters, and utilize physiological and anatomical information across species to enable rational prediction of biologics ER in humans.
A recent case example was shown by Chen et al. using recombinant mouse interleukin‐23 (rmIL‐23) and anti‐mouse IL‐23 mAb, CNTO 3723 [39]. The translational model scheme is illustrated in Figure 3.4, which outlined the essential components for this translational application, including tissue distribution to the site of action, target dynamics, and target binding and interaction. A mPBPK model with TMDD features was developed to quantitatively assess the kinetics and interrelationship between CNTO 3723 and exogenously administered rmIL‐23 in both serum and lesional skin site [39]. The translational applications of the developed model were first evaluated using ustekinumab, an anti‐human IL‐23/IL‐12 mAb developed for treatment of PsO. The model derived parameters related to biologics tissue distribution, and IL‐23 interaction dynamics parameters were combined with other system‐ and drug‐specific properties such as IL‐23 baseline in psoriatic patients, ustekinumab human PK, and IL‐23 binding affinity for ustekinumab to predict free IL‐23 suppression in skin lesion in psoriatic patients [39]. As shown in Figure 3.5, model predicted free IL‐23 suppression in skin lesion, but not necessarily that in serum, corroborated well with the established clinical efficacious dose of ustekinumab [39].

Figure 3.4 Model scheme for a biologic translation application. Model scheme includes both serum and target tissue compartments. Tissue distribution to site of action is driven by convection (σ T, vascular reflection coefficient; σ L, lymph reflection coefficient; and L T, target tissue lymph flow). Target binding and interaction is characterized with TMDD features.
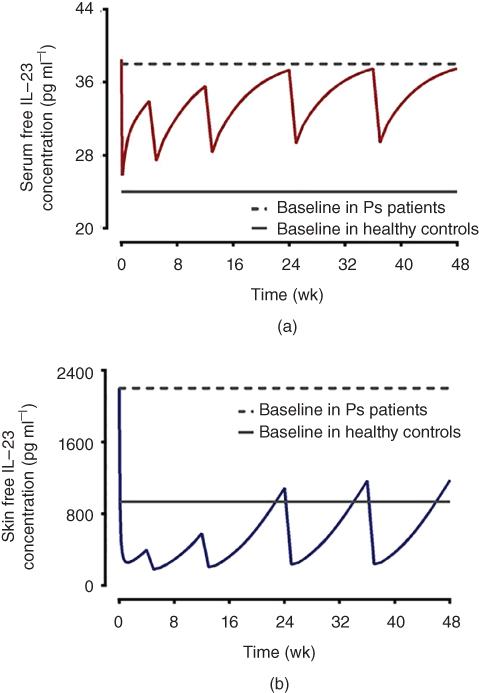
Figure 3.5 Translational projection of free IL‐23 suppression by ustekinumab using mechanistic modeling approach. Free IL‐23 concentration‐time profiles in serum (a) and lesional skin (b) of psoriatic patients (60–90 kg) following clinical recommended therapeutic dose (45 mg SC at 0 and 4 weeks initially, followed by 45 mg SC every 12 weeks). Free IL‐23 in lesional skins shows sustained suppression below IL‐23 baseline threshold in healthy subjects, suggesting model predicted IL‐23 concentration in lesional skin site correlates with ustekinumab therapeutic efficacy.
Source: From Chen et al. 2018 [39].
Anti‐IL‐23 mAb guselkumab was approved by FDA in 2017 for treatment of plaque PsO. In addition to the ustekinumab simulation shown by Chen et al. [39], the mPBPK model was further applied for prediction of free IL‐23 suppression by guselkumab in both serum and skin lesion site of psoriatic patients, and compared with guselkumab efficacy data reported from clinical studies [61–63]. To perform the simulation, a group of 100 virtual psoriatic patients was generated with body weight range similar to patients enrolled in the guselkumab clinical studies (mean and standard deviation (SD) are 89.3 and 21.2 kg, respectively, following normal distribution). An one‐compartment linear model PK model with first‐order absorption and first‐order elimination previously published for guselkumab was adapted for individual serum PK simulations in the virtual patients [64]. Inter‐individual variability (IIV) on PK parameters and covariate effects of body weight were retained. One hundred simulations were performed per each virtual patient. The simulated serum PK profiles were then incorporated into the model scheme shown in Figure 3.4. Together with other tissue distribution and IL‐23 dynamics related parameters derived from previous work [39], model was able to predict serum guselkumab concentration profiles and free IL‐23 concentration profiles in skin lesion sites in virtual patients. As shown in Figure 3.6, the simulated free IL‐23 concentration profiles in lesional skin are in good agreement with the psoriasis area severity index (PASI) scores observed in a clinical study [63,65].

Figure 3.6 Simulated guselkumab serum concentration profiles (a) and free IL‐23 concentration profiles in lesional skin (b) in virtual psoriatic patients following a single SC dose of guselkumab at 10, 30, 100, and 300 mg, respectively.
As shown in Figure 3.7, following the prescribed clinical dose regimen (100 mg subcutaneous (SC) at Weeks 0, 4, and 100 Q8W thereafter) of guselkumab, model simulation showed sustained free IL‐23 suppression below the threshold of baseline IL‐23 in healthy subjects and the suppression of free IL‐23 is more substantial in lesional skin in comparison with that in serum. Notably, guselkumab at the prescribed clinical dose regimen suppresses free IL‐23 in lesional skin to a median level that is much lower than the threshold of baseline IL‐23 in healthy subjects throughout the treatment. However, considering the PK variability of these virtual patients at the prescribed clinical dose regimen, a greater portion of these virtual patients is expected to respond well to guselkumab treatment, which have been observed in clinical studies [61,62]. In summary, this example has showcased the potential of mechanistic mPBPK modeling to understand biologics target engagement at tissue site of action, and thus provide an invaluable tool for rational human efficacious dose projection.

Figure 3.7 Simulated free IL‐23 concentration profiles in serum (a) and lesional skin (b) in virtual psoriatic patients following guselkumab at the prescribed clinical dose regimen (100 mg SC at Weeks 0, 4, and Q8W thereafter).
3.5 Conclusion
Biologics represent a rapid growing class of therapeutic agents that hold great potential. Ten antibody therapeutics have been granted their first market approval in European Union and United States in 2017, and there are many more under various stages of development [66]. For biologics against targets reside and function at tissue sites, target engagement at the tissue site of action is what expected to drive the downstream PD and therapeutic effects. There are considerable challenges in obtaining drug distribution and target engagement data from tissue sites, especially in clinics. Mechanistic PBPK modeling approaches deciphering underpinning components in the ER relationship shows great potential to integrate knowledge from various sources and can enable more informed translation from preclinical species to human and between patient populations. Case examples are presented to show that mechanistic PBPK models are highly valuable in translational research at the preclinical–clinical interface.
References
- 1 Lobo, E.D., Hansen, R.J., and Balthasar, J.P. (2004). Antibody pharmacokinetics and pharmacodynamics. J. Pharm. Sci. 93 (11): 2645–2668.
- 2 Glassman, P.M., Abuqayyas, L., and Balthasar, J.P. (2015). Assessments of antibody biodistribution. J. Clin. Pharmacol. 55 (Suppl. 3): S29–S38.
- 3 Cao, Y., Balthasar, J.P., and Jusko, W.J. (2013). Second‐generation minimal physiologically‐based pharmacokinetic model for monoclonal antibodies. J. Pharmacokinet. Pharmacodyn. 40 (5): 597–607.
- 4 Baxter, L.T., Zhu, H., Mackensen, D.G., and Jain, R.K. (1994). Physiologically based pharmacokinetic model for specific and nonspecific monoclonal antibodies and fragments in normal tissues and human tumor xenografts in nude mice. Cancer Res. 54 (6): 1517–1528.
- 5 Wang, W., Wang, E.Q., and Balthasar, J.P. (2008). Monoclonal antibody pharmacokinetics and pharmacodynamics. Clin. Pharmacol. Ther. 84 (5): 548–558.
- 6 Mager, D.E. (2006). Target‐mediated drug disposition and dynamics. Biochem. Pharmacol. 72 (1): 1–10.
- 7 Shah, D.K. and Betts, A.M. (2013). Antibody biodistribution coefficients: inferring tissue concentrations of monoclonal antibodies based on the plasma concentrations in several preclinical species and human. MAbs 5 (2): 297–305.
- 8 Li, Z. et al. (2016). Influence of molecular size on tissue distribution of antibody fragments. MAbs 8 (1): 113–119.
- 9 Tiwari, A. et al. (2016). Assessing the impact of tissue target concentration data on uncertainty in in vivo target coverage predictions. CPT Pharmacometrics Syst. Pharmacol. 5 (10): 565–574.
- 10 Rajan, S. et al. (2017). Preclinical pharmacokinetic characterization of an adipose tissue‐targeting monoclonal antibody in obese and non‐obese animals. MAbs 9 (8): 1379–1388.
- 11 Thurber, G.M., Zajic, S.C., and Wittrup, K.D. (2007). Theoretic criteria for antibody penetration into solid tumors and micrometastases. J. Nucl. Med. 48 (6): 995–999.
- 12 Thurber, G.M., Schmidt, M.M., and Wittrup, K.D. (2008). Factors determining antibody distribution in tumors. Trends Pharmacol. Sci. 29 (2): 57–61.
- 13 Thurber, G.M., Schmidt, M.M., and Wittrup, K.D. (2008). Antibody tumor penetration: transport opposed by systemic and antigen‐mediated clearance. Adv. Drug Deliv. Rev. 60 (12): 1421–1434.
- 14 Tabrizi, M., Bornstein, G.G., and Suria, H. (2010). Biodistribution mechanisms of therapeutic monoclonal antibodies in health and disease. AAPS J. 12 (1): 33–43.
- 15 Graff, C.P. and Wittrup, K.D. (2003). Theoretical analysis of antibody targeting of tumor spheroids: importance of dosage for penetration, and affinity for retention. Cancer Res. 63 (6): 1288–1296.
- 16 Wiig, H. and Swartz, M.A. (2012). Interstitial fluid and lymph formation and transport: physiological regulation and roles in inflammation and cancer. Physiol. Rev. 92 (3): 1005–1060.
- 17 Abuqayyas, L. and Balthasar, J.P. (2012). Application of knockout mouse models to investigate the influence of FcγR on the tissue distribution and elimination of 8C2, a murine IgG1 monoclonal antibody. Int. J. Pharm. 439 (1–2): 8–16.
- 18 Garg, A. and Balthasar, J.P. (2007). Physiologically‐based pharmacokinetic (PBPK) model to predict IgG tissue kinetics in wild‐type and FcRn‐knockout mice. J. Pharmacokinet. Pharmacodyn. 34 (5): 687–709.
- 19 Wang, W. et al. (2016). Deciphering the in vivo performance of a monoclonal antibody to neutralize its soluble target at the site of action in a mouse collagen‐induced arthritis model. Pharm. Res. 33 (4): 1040–1049.
- 20 Eigenmann, M.J. et al. (2017). Interstitial IgG antibody pharmacokinetics assessed by combined in vivo‐ and physiologically‐based pharmacokinetic modelling approaches. J. Physiol. 595 (24): 7311–7330.
- 21 Dragatin, C. et al. (2016). Secukinumab distributes into dermal interstitial fluid of psoriasis patients as demonstrated by open flow microperfusion. Exp. Dermatol. 25 (2): 157–159.
- 22 Chen, X. et al. (2015). Biodistribution of etanercept to tissues and sites of inflammation in arthritic rats. Drug Metab. Dispos. 43 (6): 898–907.
- 23 Cao, Y. and Jusko, W.J. (2012). Applications of minimal physiologically‐based pharmacokinetic models. J. Pharmacokinet. Pharmacodyn. 39 (6): 711–723.
- 24 Chen, X. et al. (2017). Interrelationships between infliximab and recombinant tumor necrosis factor‐α in plasma using minimal physiologically based pharmacokinetic models. Drug Metab. Dispos. 45 (7): 790–797.
- 25 Chen, X. et al. (2017). Characterization and interspecies scaling of rhTNF‐α pharmacokinetics with minimal physiologically based pharmacokinetic models. Drug Metab. Dispos. 45 (7): 798–806.
- 26 Turesson, C. et al. (2003). Extra‐articular disease manifestations in rheumatoid arthritis: incidence trends and risk factors over 46 years. Ann. Rheum. Dis. 62 (8): 722–727.
- 27 Schon, M.P. and Boehncke, W.H. (2005). Psoriasis. N. Engl. J. Med. 352 (18): 1899–1912.
- 28 Lebwohl, M. (2003). Psoriasis. Lancet 361 (9364): 1197–1204.
- 29 Thompson, C., Davies, R., and Choy, E. (2016). Anti cytokine therapy in chronic inflammatory arthritis. Cytokine 86: 92–99.
- 30 Krueger, J.G. et al. (1990). Role of growth factors, cytokines, and their receptors in the pathogenesis of psoriasis. J. Invest. Dermatol. 94 (Suppl. 6): 135S–140S.
- 31 Alunno, A. et al. (2015). Targeting the IL‐23/IL‐17 axis for the treatment of psoriasis and psoriatic arthritis. Expert. Opin. Biol. Ther. 15 (12): 1727–1737.
- 32 Ternant, D. et al. (2015). Clinical pharmacokinetics and pharmacodynamics of monoclonal antibodies approved to treat rheumatoid arthritis. Clin. Pharmacokinet. 54 (11): 1107–1123.
- 33 Reichert, J.M. (2015). Antibodies to watch in 2015. MAbs 7 (1): 1–8.
- 34 Dong, J. and Goldenberg, G. (2017). New biologics in psoriasis: an update on IL‐23 and IL‐17 inhibitors. Cutis 99 (2): 123–127.
- 35 Campa, M. and Menter, A. (2016). A review of emerging IL‐17 inhibitors in the treatment of psoriasis focusing on preclinical through phase II studies. Expert Opin. Investig. Drugs 25 (11): 1337–1344.
- 36 Chen, X. et al. (2016). Minimal physiologically‐based pharmacokinetic (mPBPK) model for a monoclonal antibody against interleukin‐6 in mice with collagen‐induced arthritis. J. Pharmacokinet. Pharmacodyn. 43 (3): 291–304.
- 37 Zhou, H. (2005). Clinical pharmacokinetics of etanercept: a fully humanized soluble recombinant tumor necrosis factor receptor fusion protein. J. Clin. Pharmacol. 45 (5): 490–497.
- 38 Page‐Thomas, D.P. et al. (1987). Clearance of proteoglycan from joint cavities. Ann. Rheum. Dis. 46 (12): 934–937.
- 39 Chen, X. et al. (2018). Development and translational application of a minimal physiologically‐based pharmacokinetic (mPBPK) model for a monoclonal antibody (mAb) against interleukin 23 (IL‐23) in IL‐23‐induced psoriasis‐like (PsL) mice. J. Pharmacol. Exp. Ther. 365 (1): 140–155.
- 40 Shah, D.K. and Betts, A.M. (2012). Towards a platform PBPK model to characterize the plasma and tissue disposition of monoclonal antibodies in preclinical species and human. J. Pharmacokinet. Pharmacodyn. 39 (1): 67–86.
- 41 Wei, X. et al. (2017). Pharmacokinetic and pharmacodynamic modeling of serum etrolizumab and circulating β7 receptor occupancy in patients with ulcerative colitis. J. Clin. Pharmacol. https://doi.org/10.1002/jcph.1031.
- 42 Lindauer, A. et al. (2017). Translational pharmacokinetic/pharmacodynamic modeling of tumor growth inhibition supports dose‐range selection of the anti‐PD‐1 antibody pembrolizumab. CPT Pharmacometrics Syst. Pharmacol. 6 (1): 11–20.
- 43 Li, H. et al. (2015). Prediction of clinical pharmacokinetics of AMG 181, a human anti‐α4β7 monoclonal antibody for treating inflammatory bowel diseases. Pharmacol. Res. Perspect. 3 (1): e00098.
- 44 Freeman, D.J. et al. (2012). Tumor penetration and epidermal growth factor receptor saturation by panitumumab correlate with antitumor activity in a preclinical model of human cancer. Mol. Cancer 11: 47.
- 45 Colburn, W.A. (1994). Drugs and endogenous ligands compete for receptor occupancy. J. Clin. Pharmacol. 34 (12): 1148–1152.
- 46 Wang, W. et al. (2014). Mechanistic pharmacokinetic/target engagement/pharmacodynamic (PK/TE/PD) modeling in deciphering interplay between a monoclonal antibody and its soluble target in cynomolgus monkeys. AAPS J. 16 (1): 129–139.
- 47 Tiwari, A. et al. (2016). A mechanistic PK/PD model for two anti‐IL13 antibodies explains the difference in total IL‐13 accumulation observed in clinical studies. MAbs 8 (5): 983–990.
- 48 Lee, J.W. et al. (2011). Bioanalytical approaches to quantify “total” and “free” therapeutic antibodies and their targets: technical challenges and PK/PD applications over the course of drug development. AAPS J. 13 (1): 99–110.
- 49 Neubert, H. et al. (2012). Tissue bioanalysis of biotherapeutics and drug targets to support PK/PD. Bioanalysis 4 (21): 2589–2604.
- 50 Zheng, S., McIntosh, T., and Wang, W. (2015). Utility of free and total target measurements as target engagement and efficacy biomarkers in biotherapeutic development – opportunities and challenges. J. Clin. Pharmacol. 55 (Suppl. 3): S75–S84.
- 51 Arican, O. et al. (2005). Serum levels of TNF‐α, IFN‐γ, IL‐6, IL‐8, IL‐12, IL‐17, and IL‐18 in patients with active psoriasis and correlation with disease severity. Mediat. Inflamm. 2005 (5): 273–279.
- 52 Michalak‐Stoma, A. et al. (2013). Serum levels of selected Th17 and Th22 cytokines in psoriatic patients. Dis. Markers 35 (6): 625–631.
- 53 Upchurch, K.S. and Kay, J. (2012). Evolution of treatment for rheumatoid arthritis. Rheumatology (Oxford) 51 (Suppl. 6): vi28–vi36.
- 54 Mager, D.E. and Krzyzanski, W. (2005). Quasi‐equilibrium pharmacokinetic model for drugs exhibiting target‐mediated drug disposition. Pharm. Res. 22 (10): 1589–1596.
- 55 Gibiansky, L. et al. (2008). Approximations of the target‐mediated drug disposition model and identifiability of model parameters. J. Pharmacokinet. Pharmacodyn. 35 (5): 573–591.
- 56 Cao, Y. and Jusko, W.J. (2014). Incorporating target‐mediated drug disposition in a minimal physiologically‐based pharmacokinetic model for monoclonal antibodies. J. Pharmacokinet. Pharmacodyn. 41 (4): 375–387.
- 57 Lowe, P.J. and Renard, D. (2011). Omalizumab decreases IgE production in patients with allergic (IgE‐mediated) asthma; PKPD analysis of a biomarker, total IgE. Br. J. Clin. Pharmacol. 72 (2): 306–320.
- 58 Lowe, P.J. et al. (2009). Relationship between omalizumab pharmacokinetics, IgE pharmacodynamics and symptoms in patients with severe persistent allergic (IgE‐mediated) asthma. Br. J. Clin. Pharmacol. 68 (1): 61–76.
- 59 Ansel, K.M. et al. (2000). A chemokine‐driven positive feedback loop organizes lymphoid follicles. Nature 406 (6793): 309–314.
- 60 Brodfuehrer, J. et al. (2014). Quantitative analysis of target coverage and germinal center response by a CXCL13 neutralizing antibody in a T‐dependent mouse immunization model. Pharm. Res. 31 (3): 635–648.
- 61 Leonardi, C.L. et al. (2008). Efficacy and safety of ustekinumab, a human interleukin‐12/23 monoclonal antibody, in patients with psoriasis: 76‐week results from a randomised, double‐blind, placebo‐controlled trial (PHOENIX 1). Lancet 371 (9625): 1665–1674.
- 62 Papp, K.A. et al. (2008). Efficacy and safety of ustekinumab, a human interleukin‐12/23 monoclonal antibody, in patients with psoriasis: 52‐week results from a randomised, double‐blind, placebo‐controlled trial (PHOENIX 2). Lancet 371 (9625): 1675–1684.
- 63 Sofen, H. et al. (2014). Guselkumab (an IL‐23‐specific mAb) demonstrates clinical and molecular response in patients with moderate‐to‐severe psoriasis. J. Allergy Clin. Immunol. 133 (4): 1032–1040.
- 64 Yao, Z. et al. (2018). Population pharmacokinetic modeling of guselkumab, a human IgG1 lambda monoclonal antibody targeting IL‐23, in patients with moderate to severe plaque psoriasis. J. Clin. Pharmacol. 58 (5): 613–627.
- 65 Hu, C. et al. (2014). Information contributed by meta‐analysis in exposure–response modeling: application to phase 2 dose selection of guselkumab in patients with moderate‐to‐severe psoriasis. J. Pharmacokinet. Pharmacodyn. 41 (3): 239–250.
- 66 Kaplon, H. and Reichert, J.M. (2018). Antibodies to watch in 2018. MAbs 10 (2): 183–203.