
5
5Model‐Based Meta‐Analysis Use in the Development of Therapeutic Proteins
Timothy J. Taylor Bill Frame and Angela D. Taylor
Projections Research Inc., Pharmacometrics, 63 E. Shore Drive, Niantic, CT, 06357, USA
5.1 Introduction
Model‐based meta‐analysis (MBMA) is a method for combining summary or aggregate qualitative and quantitative study data from multiple studies to develop a single conclusion that has greater statistical power than one study alone, thus facilitating decisions during drug development. Individual studies sometimes fail to show statistically significant differences; multiple studies investigating the same clinical hypothesis often form a continuum of clinical experience and combining these study results leverages existing information. Since MBMA is based on aggregate (e.g. mean or median) results from large numbers of subjects from different studies and potentially different therapeutic agents, it increases the power to precisely detect significant effects across multiple studies, providing a basis for quantitative drug development decisions [1].
The term meta‐analysis was introduced by Glass in 1976 where in his paper on educational research he states, “Meta‐analysis refers to the analysis of analyses” [2]. The basic idea is to combine results from multiple scientific studies and analyze that data together as a whole. British mathematician Karl Pearson was the first to apply this method while reporting on inoculations to prevent enteric fever due to Salmonella species [3]. MBMA extends this idea by incorporating models relevant to the response being studied. MBMA is an innovative use of available data that results in increased knowledge and more precise decision‐making in all phases of drug development, reducing overall cost of development, and improving success rates of new therapies.
MBMA can be used across all phases of drug development, specifically in applying pharmacostatistical models to safety and efficacy data. MBMA enables indirect comparison such as taking into account the impact of differences in treatment, patient population, and trial characteristics (http://www.quantitativesolutions.net/our‐services/model‐based‐meta‐analysis/). MBMA can also be applied to scale across indications such as individual drugs that work on different inflammatory diseases (inflammatory bowel disease (IBD) including the principle types Crohn's disease (CD) and lcerative colitis (UC) as well as psoriasis, psoriatic arthritis (PsA), and ankylosing spondylitis (AS)). As such, models such as these can help predict drug performance in later stage development or for a different indication (http://www.quantitativesolutions.net/our‐services/model‐based‐meta‐analysis/). Another application of MBMA is to test how a new drug is expected to compare with the current standard of care and with the emerging competition, both positively and negatively. This aids in drug development strategy by differentiating between new therapies with established therapies, for example, which creates more evidence for GO–NO GO decision‐making as data become available [4]. Thus currently the most common application for MBMA is the comparison of drugs in development to marketed drugs and competitors.
This chapter focuses on the use of MBMA in the development of therapeutic proteins for immune‐mediated inflammatory disease where pharmacometric models are used to model the responses of interest.
5.2 Types of MBMA and Database Considerations
MBMA attempts to combine large amounts of data to answer questions about dose selection, time course of drug effect, time course of adverse events, or the distribution of possible outcomes of a future clinical trial. The most common type of MBMA pools summary data from multiple publications (http://www.quantitativesolutions.net/our‐services/model‐based‐meta‐analysis/). For example, proprietary data might exist for a compound in development with multiple response measurements over time for each subject in a cohort. This might be combined with summary‐level data of the studied population extracted from the literature for competing therapies. Such an analysis was presented where beta regression was used to study Alzheimer's disease [5]. MBMA was also used on purely subject‐level pharmacokinetic (PK) data to guide the first‐in‐human study designs for monoclonal antibodies [6]. MBMA is not limited to describing aggregate data; however, it can also be used to simultaneously model individual level data along with aggregate data from the study population [7].
Choosing the most appropriate studies to include is a critical process that can affect the reliability of the results. Many MBMA analyses have been criticized for incomplete, poor quality, or biased (primarily positive) data. MBMA requires clearly defined objectives and complete, unbiased reviews of all studies (published and unpublished) examining the same therapeutic outcome measure [8]. Systematic reviews should present a balanced summary of existing research, enabling MBMA to be based on all relevant studies of adequate quality, ideally with studies that show both success and failure in reaching their therapeutic objective. Incomplete reviews potentially result in biased models. Funnel plots, which is a scatter plot of treatment effect against a measure of study precision can be used to screen for bias [9]. Positive reports are more likely to be included in a meta‐analysis than those showing no significant differences or negative trends, and there is a tendency to exclude results published in languages other than English. The methodological quality of the design and execution of each study included in MBMA must be assessed. Another potential source of bias in MBMA is that missing data are assumed to be missing at random, both at patient‐level and study‐level [10]. Therefore, data sources must be scrutinized for drop‐out and type of missing‐ness and then handled appropriately. The preferred reporting items for systematic reviews and meta‐analyses (PRISMA) statement (www.prisma‐statement.org) are useful during this evaluation.
A plan for inclusion and/or exclusion criteria must be generated. For example, combining studies exploring only the induction of therapeutic response with studies that include only maintenance of therapeutic response, or both induction and maintenance, can be complex and possibly inappropriate as the goals of these studies are different and patient populations in maintenance studies are often enrolled only if they show a response to induction treatment, thus biasing the response seen in maintenance.
The double‐blind method is an important part of the scientific methodology in drug development studies to prevent research outcomes from being “influenced” by the placebo (PCB) effect or observer bias. A study without placebo arms may be less informative than those with placebo arms since studies without placebo arms may overestimate the therapeutic effect. Therefore, including only double‐blind studies should be attempted or the model should account for the lack of a placebo arm for those studies.
For continuous responses, such as the time above or below a target efficacy endpoint, several issues may arise. Some may report a measure of central tendency and others may report a change from baseline. Since baseline is measured with the same error as post baseline values, and since there may be important predictors for baseline, it is best to avoid change from baseline studies unless that change is the primary focus (see discussion of CR‐70 below). For positive continuous responses, the measure of central tendency could be the arithmetic mean, geometric mean, harmonic mean, or possibly the median, depending on the distribution of the responses. For responses where “lower is better” have nonnormal distributions, the geometric mean should be reported instead of the arithmetic mean. For positive responses, the harmonic mean is typically better than the geometric mean that is also better than the arithmetic mean [11]. With discrete responses, typically the number of subjects present at each evaluation point and the count of the outcome of interest are reported. This may also be the case when authors choose related but different measures of a disease. For example, studies on CD might be characterized by the Crohn's Disease Activity Index (CDAI), which is a bounded continuous response, while other studies might report the number of subjects that experience a 70‐point drop from baseline in CDAI (CR‐70) or a 100‐point decrease from baseline CDAI (CR‐100).
Ideally, the data base should contain as much summary information as possible. During the analysis phase, before MBMA is implemented, studies can be rejected based on specific criteria that will ensure a continuous and harmonious combination of all data such as retaining data only if there is a placebo arm, the raw arithmetic mean is reported over time, or there is minimal dropout.
5.3 Data Analytic Models Useful for MBMA
In order for MBMA to be applied successfully in pharmacometrics, there needs to be a foundation of familiarity with the computer program NONMEM® [12] or other population modeling software. Ahn and French explored various methods of handling MBMA for within‐treatment arm correlation with the NONMEM software. They began by writing a nested model that might be used for an unbounded continuous response. The fixed effects part of the model is omitted here so the focus remains on the random components. The nesting is formulated as follows: within a study (indexed by i), there are subjects (indexed by j) giving rise to panel data at time points (denoted by t). The model random effects equation is shown in Eq. (5.1).
where Yij(t) is the random component of the response at time t, for the jth subject in study i. All three random effects in [13] are independent and normally distributed with variances ![]() for between study, between subject, and within‐subject effects, respectively. Since what is reported for a summary is often an arithmetic mean for a given treatment arm (group) at a particular time point, the arithmetic mean is computed. That calculation reveals that the residual errors across time points, within an arm, are correlated with a correlation coefficient calculated as
for between study, between subject, and within‐subject effects, respectively. Since what is reported for a summary is often an arithmetic mean for a given treatment arm (group) at a particular time point, the arithmetic mean is computed. That calculation reveals that the residual errors across time points, within an arm, are correlated with a correlation coefficient calculated as ![]() . Note that for this model an arithmetic mean suffices since the random effect on study and a symmetry correlation structure for within treatments (i.e. both models have three random effect parameters). The symmetry matrix for within‐arm residuals (n = 3 time points/treatment) looks like Eq. (5.2) multiplied by 1/√N, where N is the number of treatment arms.
. Note that for this model an arithmetic mean suffices since the random effect on study and a symmetry correlation structure for within treatments (i.e. both models have three random effect parameters). The symmetry matrix for within‐arm residuals (n = 3 time points/treatment) looks like Eq. (5.2) multiplied by 1/√N, where N is the number of treatment arms.

The diagonal elements are the same for all time points and represent total variance. The off‐diagonal elements suggest that the covariance is equal between time points. An equivalent model can be developed by using a random study effect, a random arm effect, and a residual error term for within‐arm variability. For this case, both the random arm and residual variability terms are weighted by 1/√N.
For these models, the random effect parameters are estimated. This is in contrast to a situation where reported standard errors from the literature might be used. In other words, the variance of the residual error for the arithmetic mean (σ2/√N) is replaced by the reported value of the standard error of the arithmetic mean squared (AM2), and thus σ2 is not estimated. For all the models, the assumption is that the standard deviations of the data are the same across arms and studies; the only factor making the standard errors different is the number of subjects for each arm and study which is included with the 1/√N term.
In the second part of Ahn and French analysis, more realistic models were considered, where the random effects enter in a nonlinear fashion [12]. The weighting schemes from the simple linear models were carried over to the nonlinear models. The various methods of handling random effects were compared via simulation and estimation. Results varied across simulation scenarios, but in general, models using only a treatment arm random effect were not optimal. Changing sample sizes over time were not explored.
Implementation in NONMEM involved using the NONMEM specific term for the identification (ID) variable to cluster study‐level or arm‐level data, or inter‐occasion variability to cluster arms within a study. Correlated residual errors were modeled with the L2 data item. Another possibility is using the “eta on epsilon” approach for residual error, which would allow this error to vary across studies or arms.
Often, the response being modeled is bounded and continuous. These types of responses require the use of truncated distributions. This can be dealt with in NONMEM using the YLO and or YUP options. Ahn and French mentioned using Taylor series approximations [12] when dealing with random effects, which enter the model nonlinearly. Series approximations and or central limit theorems have also been used to simultaneously model different measures of central tendency as might be reported for a positive response arising from a nonnormal distribution (log normal for example) [14].
5.4 Example 1: MBMA in Inflammatory Bowel Disease
Presented in this section are the results from the development of models for the kinetics of drug action (K‐PD) using a meta‐analysis of published literature on CD and its therapies. A total of 30 publications were used to develop the databases for these models.
5.4.1 Overview of Inflammatory Bowel Disease and Clinical Endpoints
IBD is a chronic condition characterized by a relapsing–remitting course that can affect the entire gastrointestinal (GI) tract or only parts of it. CD and UC are the primary forms of IBD, and both can present with extra‐intestinal manifestations. The symptoms of both forms are similar and a positive diagnosis requires colonoscopy. The etiology of IBD is not well understood and may arise from the multiple contributors including genome, microbiome, exposome, and immunome. IBD can have a profound impact on patients' lives and requires chronic therapy to manage symptoms and to restore a good quality of life. The treatment for IBD usually follows a “step up” approach first using corticosteroids and antibiotics, and 5‐aminosalicyclic acid (5‐ASA) or budesonide. If a patient fails to respond or loses response to this initial therapy, then immunosuppressants such as azathioprine or methotrexate are used. Subsequent treatment failures, or for patients presenting with severe disease, indicate that the use of biologics, such as tumor necrosis factor alpha (TNFα) antagonists (anti‐TNFα), and anti‐integrin monoclonal antibodies are required to manage the disease.
Less than 50% of IBD patients have long‐term successful treatment outcomes with anti‐TNF treatment. In randomized controlled trials, initial clinical remission rates achieved with TNF antagonists for IBD range between 20% and 40% [15,16]. For patients that achieve remission, approximately 40% maintain remission one year later [13]. About one‐third of patients never respond to anti‐TNF therapy [17,18]; a high proportion (30–50%) of patients initially respond, but subsequently require dose adjustments to maintain clinical remission [19], and approximately 20% of patients lose response shortly after anti‐TNFα initiation [20]. Therefore, a large proportion of patients have an unmet medical need for IBD treatment due to treatment failures.
Disease metrics and biomarkers are used to define disease characteristics and evaluate therapeutic improvements. The four measurements widely used in CD are the CDAI, the CDAI decrease of ≥100 points from baseline (CR100), C‐reactive protein concentrations (CRPs), and immunogenicity (e.g. anti‐drug antibody, ADA, positive).
The CDAI is used to quantify the symptoms of subjects with CD and is comprised of the sum of eight separately weighted factors where values range from 0 to 600. Higher values indicate more severe symptoms [21]. The CR100 is a binary metric derived from the CDAI and is typically reported as the percent of subjects having at least a 100‐point decrease in CDAI from baseline. CRP is an acute‐phase protein whose blood concentration rises in response to inflammation [22]. Similar to other therapeutic proteins, a large percentage of the patients treated with anti‐TNFα MAbs develop ADA which has been associated with undesirable outcomes, particularly lack of efficacy.
5.4.2 MBMA for Inflammatory Bowel Disease Treated with Biologics
This section is an example of MBMA results using published literature on IBD studies (meta‐analysis) and the development of a K‐PD model of the time course of drug action of the biologic therapies on CDAI, CR100, CRP, and immunogenicity. The analysis concentrated on evaluating the effects of the anti‐TNFα biologics certolizumab pegol, CDP870 (an earlier formulation of certolizumab) adalimumab, and infliximab, the humanized monoclonal antibody against α4 integrin natalizumab, the monoclonal antibody against α4β7 vedolizumab, and the monoclonal antibody ustekinumab that blocks IL‐12 and IL‐23.
5.5 MBMA Literature Search
As mentioned above, MBMA is often used to evaluate and compare the results of several published studies addressing a set of related research hypotheses [23]. The resulting overall average effect of drugs, when appropriately controlled for study characteristics, is generally a more powerful estimate of the true effect size than estimates that are derived from a single study. Simulations based on meta‐models provide a range of expected outcomes or dose–response relationships. These results from a meta‐analysis can be used to inform the relative efficacy of current and new agents, evaluate combinations of current treatments, and guide dose selection of new agents in development [24].
A systematic literature review of clinical trials of biologic treatments for IBD was conducted in public literature on drugs that have been approved or are in active clinical development. The search was conducted on major databases including PubMed, United States Food and Drug Administration (US FDA) summary basis of approval (SBA) website, product label, major gastroenterology society websites including Digestive Disease Week (DDW), United European Gastroenterology Week (UEGW), and European Crohn's and Colitis Organization (ECCO). The search criteria for clinical efficacy end points included CDAI and derived parameters such as CR70 and CR100 (a reduction of 70 or 100 points in CDAI over predose baseline, respectively) and, for ulcerative colitis, Mayo or partial Mayo Clinic scores. The keywords for search under the above criteria included dosing regimens (dose and dose frequency), biomarkers (receptor occupancy, CRP, and lymphocyte count), and safety endpoints such as incidence of immunogenicity and progressive multifocal leukoencephalopathy (PML). Well‐controlled clinical trials with longitudinal placebo and active treatment data were given the highest focus. In general, selected references contained reported results for double‐blind, randomized, placebo‐controlled Phase II/Phase III studies. The final meta database included 64 references and 74 studies. The datasets that were deemed assessable included 60 studies (47 in CD and 13 in UC) from 61 references. Summary descriptions of active treatment drug concentration (PK) data were available from only 13 studies in three references. Publications reporting single data points such as change from baseline without baseline values were deemed not informative and were thus excluded.
Table 5.1 lists the numbers of studies by therapeutic pathway and the corresponding therapeutic agents.
Table 5.1 Data sources used to develop the CDAI, CR100, CRP, and immunogenicity models.
| References | CDAI | CR100 | CRP | Immunogenicity |
| Hanauer et al. [16] | Y | N | Y | N |
| Rutgeerts et al. [15] | N | N | Y | N |
| Targan et al. [17] | Y | N | Y | N |
| Hanauer et al. [18] | Y | Y | Y | N |
| Feagan et al. [25] | N | N | N | Y |
| Ghosh et al. [26] | Y | N | N | N |
| Centocor Ortho Biotech, Inc. [27] | Y | Y | Y | N |
| Sandborn et al. [28] | Y | N | Y | N |
| Hommes et al. [29] | Y | Y | N | N |
| Reinisch et al. [30] | Y | Y | Y | N |
| Rutgeerts et al. [31] | Y | N | N | N |
| Schreiber et al. [32] | N | Y | Y | N |
| Tilg et al. [33] | N | N | Y | N |
| Sandborn et al. [34] | Y | Y | N | N |
| Probert et al. [35] | N | N | Y | N |
| Slonim et al. [36] | Y | N | N | N |
| Gordon et al. [37] | N | N | Y | N |
| Asakura et al. [38] | Y | N | Y | N |
| Present et al. [39] | Y | N | N | N |
| Sands et al. [40] | N | N | Y | N |
| Lemann et al. [41] | N | N | Y | N |
| Rutgeerts et al. [42] | Y | N | N | N |
| Colombel et al.[43] | N | Y | N | N |
| Moyer [44] | N | Y | N | N |
| Targan et al. [45] | Y | Y | Y | Y |
| Feagan et al. [46] | Y | Y | Y | Y |
| Rutgeerts et al. [47] | Y | N | Y | Y |
| Sandborn et al.[48] | Y | Y | Y | Y |
| Winter et al. [49] | Y | Y | Y | N |
| Sandborn et al. [50] | Y | Y | Y | N |
N, no; Y, yes; CDAI, Crohn's disease activity index; CR100, the CDAI decrease of ≥100 points from baseline; CRP, C‐reactive protein concentrations.
5.6 Kinetic‐Pharmacodynamic Models
PK data and/or PK models were not publically available for many of the agents evaluated in this analysis. As a result, a simplified empirical approach to the time‐course of drug action was employed. The approach was based on pharmacometric models, where there is a virtual compartment representing the “biophase” in which the drug concentration is in equilibrium with the drug effect. This allows for the extraction of the (pharmaco)kinetic (K) component from the pharmacodynamic (PD) component, commonly referred to as K‐PD.
Parameters of this model are the elimination rate constant (Ke) from the virtual compartment, which describes the equilibrium between the rate of dose administration and the observed effect, and a second parameter for the apparent effect of the drug on the endpoint at steady state (Figure 5.1). Gabrielsson et al. [51] demonstrated that the use of these empirical PD models for the purpose of characterizing response data (e.g. a K‐PD model) was a suitable approach when PK data were not available.
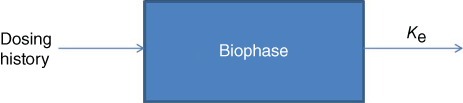
Figure 5.1 Model diagram. Ke, elimination rate constant.
Because the K‐PD models do not incorporate observed PK data, the amount of drug available for response is a virtual amount controlled by the dose regimen. This approach has been used to model a number of therapies such as describing the urinary excretion of the C‐telopeptide of the α chain of type I collagen, which is a marker of response for ibandronate treatment [52]. In addition, Pillai et al. showed that the results with a K‐PD model were consistent with the traditional PK–PD model, further justifying the use of K‐PD models when PK data are not available [52].
A K‐PD construct was used to model the attack‐decay characteristics of drug over time [53]. In the datasets used for the continuous variables CDAI and CRP, all CDAI response data were either reported as a mean or median, and all CRP response data were either reported as a mean, median, or geometric mean. For these disease metrics, median, and geometric mean responses were treated as means to avoid making assumptions about the distribution of the underlying data. The CDAI data were assumed to arise from a truncated distribution with truncation endpoints of 0 and 600. The realized CDAI mean or median response in the jth arm of the ith study at time t [CDAIij(t)] was described using Eq. (5.3).
A placebo response was observed in many clinical studies. In order to incorporate this into the model, two baseline values were used. The first two terms in the CDAI equation (BSLN1 and BSLN2) describe the baseline CDAI and placebo responses, respectively. At time zero, the estimated baseline for a typical study was BSLN1 + BSLN2. The placebo response for large values of t (a much later time from the beginning of the study) was BSLN1. The parameter k controlled the rate of transition from baseline to the new, lower steady‐state placebo response prediction. The function resulted in an asymptotic decline that was constrained to be positive. In Eq. (5.3), the term ɛij represents residual error in the model fit. Specifically, ɛij ∼ N(0,σ2), thus σ/SQRT(N) is the typical estimated standard deviation of the mean and σ is the estimated standard deviation of the raw data. N is simply the number of subjects contributing to each mean or median response. The random effect ηi2 describes between study variability in residual error.
The study specifies random effect parameters ETi1 and ηi2 described between‐study variability in the typical response and standard deviation of the raw data, respectively. Note that data within an arm was correlated, and this correlation was induced by the eta epsilon structure. For the CDAI model, the random effect ETi1 was specified as shown in Eq. (5.4) via a Manly transformation of the internal NONMEM random effect ηi1 to deal with skewness [54]:
In Eq. (5.4), λ was an estimated Manly shape parameter. The random effects ηi1 and ηi2 were assumed to be distributed with mean zero and variances ω1 and ω2, respectively.
The CRP response in the jth arm of the ith study at time t [CRPij(t)] was described as shown in Eq. (5.5).
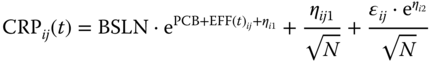
where BSLN described the baseline CRP value, PCB described the placebo response, and EFFij(t) described the drug responses. At time zero, the estimated baseline for a typical study was BSLN. The placebo response for time values larger than zero was BSLN·ePCB. The random effects ηi1, ηi2, and ɛij had the same meaning as for CDAI. As was suggested by Ahn and French [12], there were correlations between observations over time within a treatment arm because the same subjects were contributing to the means at each time point. This correlation depended on the ratio of the between‐subject variance to the sum of the between‐subject and residual variance. The term ηij1/√(N) modeled between‐arm variability in the mean response within a study. The random effect ηij1 was assumed to be distributed with mean zero and variance ω3. This variance component, therefore, modeled between‐subject variability in CRP in the additive space.
In the datasets used for evaluation of the discrete variables CR100 (CR) and immunogenicity (IMM), minus two times the log likelihood (−2LL), up to a constant of proportionality of the realized number of subjects in the jth arm of the ith study at time “t,” L[CRij(t)], and L[IMMij(t)], respectively, were modeled binomially, as follows:

In Eq. (5.6), Nij is the number of subjects in the jth arm of the ith study, and ProbCRij(t) is the probability of CR100 in the jth arm of the ith study at time t, which is described using Eq. (5.7).
The first two terms in Eq. (5.7) estimate the baseline and time‐dependent placebo logit contributions, respectively. For the CR100, the arm‐specific random effect ηj described between‐arm variability in the logit probabilities. The random effect ηj was assumed to be distributed with a mean of zero and variance ω1.
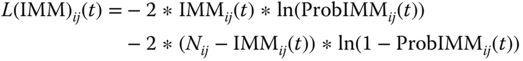
In Eq. (5.8), Nij is the number of subjects in the jth arm of the ith study, and ProbIMMij(t) is the probability of developing immunogenicity in the jth arm of the ith study at time t, which is described using Eq. (5.9). The first term in Eq. (5.9) estimates the baseline or placebo logit contribution.
For CDAI, CRP, CR100, and immunogenicity, the term EFFij(t) described drug effect for the jth arm of the ith study at time t greater than zero as follows (at time zero [baseline] the EFFij(t) term was zero):
Equation (5.10) indicates that the drug effect was proportional to the amount of virtual drug in the compartment corresponding to its associated study arm based on the K‐PD model described in Eq. (5.11). For each drug, a Ki parameter was estimated relating the amount of drug to the effect on the biomarker being evaluated. A(i,j) was the amount of virtual drug in the PK compartment for arm j of study i. The inputs to these compartments were determined by the dosing records based on the study design and the elimination from these compartments was described as follows:
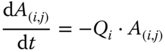
The Qi parameters determine the first‐order rate of elimination of the virtual drug, making the K‐PD model forcing function analogous to a bolus input. Thus, the amount of virtual drug available to exert a pharmacological effect was scaled to the dose and frequency of administration, allowing for the comparison of response across multiple dose regimens when PK data were not available. For most treatments, these parameters could not be estimated and were fixed to values minimizing minus two times the log likelihood (−2LL) of the data which were obtained via likelihood profiling across a wide range of values.
The models were fit using the NONMEM system (Version 7.1.0, ICON Development Solutions, Ellicott City, MD, USA) with the Laplacian estimation method. Intel® Visual Fortran (Version 10.1.011, Intel Corporation, Santa Clara, CA, USA) was used as the compiler.
Model evaluation was primarily graphical in nature via standard goodness of fit plots. Plots of predictions vs. observations and residuals vs. predictions and time were employed. A graphical predictive check included overlays of the observed data upon an 80% prediction interval (PI). The predictive checks were done using the training data structure replicated 100 times. To understand dose–response for these agents, the ranges of estimated responses for each treatment at representative doses were simulated. Box and whisker plots were generated for both induction and maintenance. Distributional assumptions of the residual error were explored with histograms.
5.6.1 K‐PD Models Results
These results were presented previously [55]. The final model parameter values for each of the models are displayed in Table 5.2.
Table 5.2 Final model parameters.
| Parameter | Estimate | 95% Wald CI | Between‐study variabilitya,b |
| CDAI | |||
| BSLN1 | 236 | 223.08–248.92 | 20.9 |
| BSLN2 | 64.1 | 54.24–73.96 | NE |
| k (d−1) | 0.16 | 0.12–0.2 | NE |
| λ | −0.0 582 | −0.116 to −0.001 | NE |
| Q terms (virtual drug elimination per day) | |||
| Adalimumab | 0.000 2 | NE | NE |
| CDP571 | 0.002 23 | NE | NE |
| Infliximab | 0.014 3 | 0.012–0.017 | NE |
| Natalizumab | 0.000 02 | NE | NE |
| MLN0002* | 0.000 02 | NE | NE |
| Certolizumab | 0.015 8 | NE | NE |
| CDP870 | 0.000 052 | NE | NE |
| K terms | |||
| Adalimumab | −0.164 | −0.193 to −0.135 | NE |
| CDP571 | −0.020 8 | −0.025 to −0.017 | NE |
| Infliximab | −0.123 | −0.16 to −0.086 | NE |
| Natalizumab | −0.059 7 | −0.066 to −0.054 | NE |
| MLN0002* | −0.228 | −0.263 to −0.193 | NE |
| Certolizumab | −0.027 6 | −0.033 to −0.022 | NE |
| CDP870 | −0.011 9 | −0.016 to −0.008 | NE |
| σ | 115 | 78.15–151.85 | 52.8 |
| CRP | |||
| BSLN | 12.6 | 10.23–14.97 | 43.4 |
| PCB | −0.018 3 | −0.1 to 0.07 | NE |
| Q terms (virtual drug elimination per day) | |||
| Adalimumab | 0.001 | NE | NE |
| Infliximab | 0.033 8 | NE | NE |
| Natalizumab | 0.024 6 | NE | NE |
| MLN0002* | 0.017 4 | NE | NE |
| Certolizumab | 0.037 | NE | NE |
| CDP870 | 0.027 2 | NE | NE |
| K terms | |||
| Adalimumab | −0.012 7 | −0.014 to −0.011 | NE |
| Infliximab | −0.003 09 | −0.0 064 to 0.0 002 | NE |
| Natalizumab | −0.002 06 | −0.002 to −0.002 | NE |
| MLN0002* | −0.001 53 | −0.0 021 to −0.001 | NE |
| Certolizumab | −0.003 09 | −0.0 064 to 0.0 002 | NE |
| CDP870 | −0.001 01 | −0.001 to −0.001 | NE |
| σ | 14.2 | 9.38–19.02 | 57.2 |
| Between‐subject variabilityc | 4.04 | ||
| Immunogenicity | |||
| INTd | 0.313 | 0.256–0.378 | NE |
| Q terms (virtual drug elimination per day) | |||
| Natalizumab | 0.024 6 | NE | NE |
| Certolizumab | 0.037 | NE | NE |
| MLN0002* | 0.017 4 | NE | NE |
| K terms | |||
| Natalizumab | −0.005 53 | −0.0 066 to −0.0 045 | NE |
| Certolizumab | −0.004 81 | −0.0 057 to −0.0 039 | NE |
| MLN0002* | −0.007 25 | −0.0 098 to −0.0 047 | NE |
| CR100 | |||
| BASEe | 0.009 | 0.003–0.035 | 40.7 |
| PCB e | 0.357 | 0.129–0.675 | NE |
| k (d−1) | 0.153 | 0.099–0.207 | NE |
| Q terms (virtual drug elimination per day) | |||
| Adalimumab | 8.58E−007 | −5E−006 to 1E−005 | NE |
| CDP571 | 1.00E−05 | NE | NE |
| Infliximab | 0.033 8 | NE | NE |
| Natalizumab | 0.024 6 | NE | NE |
| MLN0002* | 0.017 4 | NE | NE |
| Certolizumab | 0.037 | NE | NE |
| CDP870 | 0.027 2 | NE | NE |
| Ustekinumab | 1.00E−05 | NE | NE |
| K terms | |||
| Adalimumab | −1.97E−005 | −0.000 202 to 0.000 16 | NE |
| CDP571 | 0.000 2 | −0.000 1 to 0.000 5 | NE |
| Infliximab | 0.001 91 | 0.000 1–0.003 8 | NE |
| Natalizumab | 0.002 7 | 0.002–0.003 | NE |
| MLN0002* | 0.003 66 | 0.002–0.006 | NE |
| Certolizumab | 0.001 | 0.000 47–0.001 53 | NE |
| CDP870 | 0.001 95 | 0.000 81–0.003 09 | NE |
| Ustekinumab | 0.000 143 | −0.000 62 to 0.000 91 | NE |
CI, confidence interval; NE, not estimated; Q, elimination of the virtual drug; K, apparent drug effect; and MLN0002*, vedolizumab.
aFor CDAI, between‐study variability in baseline is reported as a standard deviation, for σ as a % coefficient of variation (CV).
bFor CRP, between‐study variability in baseline is reported as a % coefficient of variation (CV).
cUnits for between‐subject variability are on additive scale for CRP.
dINT reported as a probability.
eBASE and PCB are reported as probabilities.
5.6.1.1 CDAI K‐PD Model Results
The first‐order rate of elimination of the virtual drug (Q) was estimated only for infliximab. The apparent drug effect (K) parameters indicated that all drugs had a statistically significant effect over placebo. The attack‐decay characteristics of the different treatments were dosing regimen dependent (Table 5.2). Typical placebo, infliximab, and vedolizumab CDAI response vs. time curves are presented in the left panel of Figure 5.2 as is a visual predictive check (VPC) of CDAI vs. time in the right panel, which suggests good predictive ability of the model.
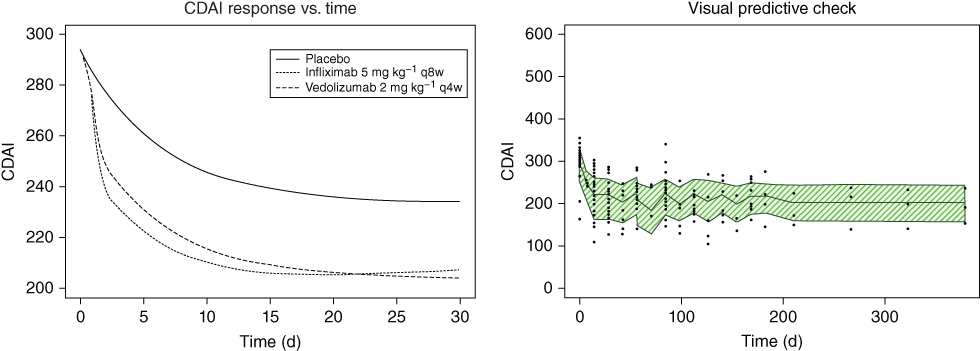
Figure 5.2 Crohn's Disease Activity Index (CDAI).
Using the final model, a comparison of the median CDAI profiles following standard treatment as outlined in their respective package inserts (Figure 5.3) shows that overall infliximab was the most clinically active of the evaluated biologics, with a decrease in CDAI to approximately 160 after the second 5 mg kg−1 dose at two weeks. The next most active treatment was the highest dose of adalimumab (160 mg), where a decrease in CDAI to approximately 180 was predicted after the second dose of 80 mg was administered at Week 2.
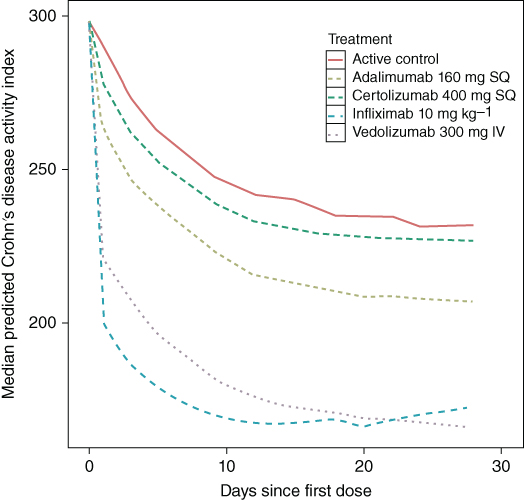
Figure 5.3 Predicted median Crohn's Disease Activity Index (CDAI). IV - intravenous and SQ, subcutaneous. (See insert for color representation of this figure.)
Figure 5.4 compares the range of CDAI values following treatment with infliximab for two dosing regimens. The panel on the left shows the 95% PI of CDAI following the recommended treatment with infliximab in the package insert of a 5 mg kg−1 dose at Weeks 0, 2, and 6, (the induction phase), and then 5 mg kg−1 every eight weeks thereafter (maintenance phase). The panel on the right has the same induction phase dose; however, for the maintenance phase, the dose is increased to 10 mg kg−1 every eight weeks. This regimen was chosen since the dosing instructions in the package insert indicate that some adult patients who initially respond to treatment may benefit from increasing the dose to 10 mg kg−1 if they later lose their response.
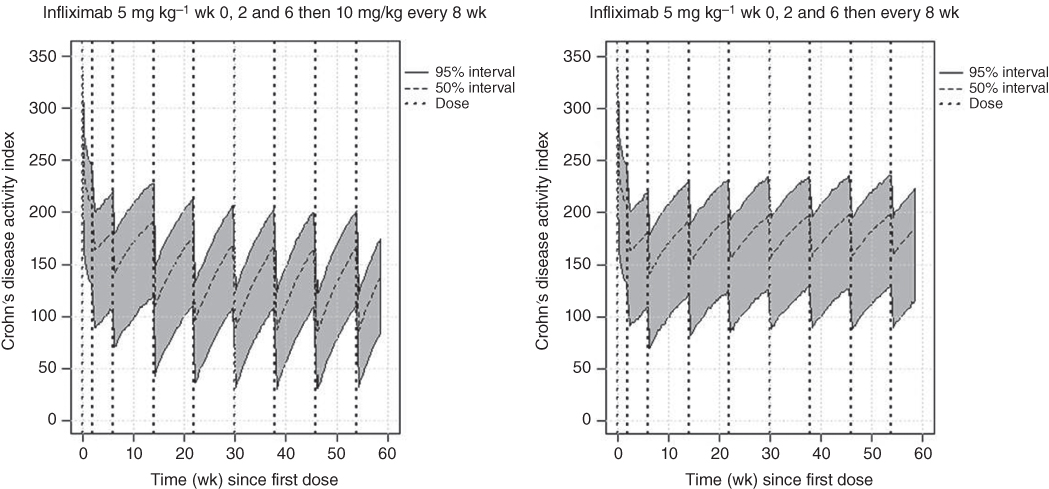
Figure 5.4 Range of CDAI response following labeled infliximab dosing regimens.
Figure 5.5 presents the same results with only the median values shown. As expected, based on these results, the higher maintenance dose results in a greater decrease in CDAI during maintenance and this level remained stable throughout the first year of treatment. For the higher maintenance dose, the CDAI values continue to decrease up to approximately 38 weeks after the first dose where they remain about the same for the rest of the year. Based on these simulations, more than half the patients administered the labeled dose (5 mg kg−1 during maintenance) of infliximab do not achieve remission (CDAI < 150), however, a 10 mg kg−1 shows that the majority of patients achieve remission for most of the dosing interval.
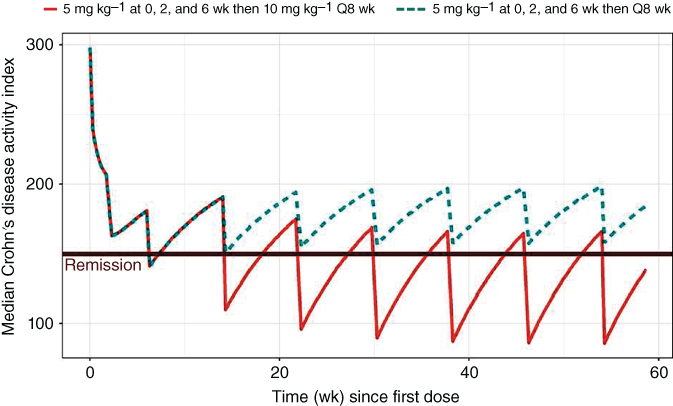
Figure 5.5 Median CDAI following a labeled infliximab dosing regimens. Label – REMICADE is administered by intravenous infusion over a period of not less than two hours.
Finally, this model was used to evaluate two alternative dosing regimens of infliximab. Figure 5.6 compares two such regimens. One regimen administered 10 mg kg−1 on Weeks 0, 2, and 6 during induction then 10 mg every eight weeks during maintenance. This dosing regimen shows a rapid improvement in the CDAI during induction to levels below the level of remission after the second dose at two weeks. During maintenance, the values are similar to those of the 10 mg kg−1 dose every eight weeks shown above. The second dosing regimen included the labeled dose of 5 mg kg−1 on Weeks 0, 2, and 6 during induction followed by 5 mg kg−1 every four weeks during maintenance. This figure shows remission is achieved for the majority of patients during maintenance at a lower dose provided it is administered more frequently.
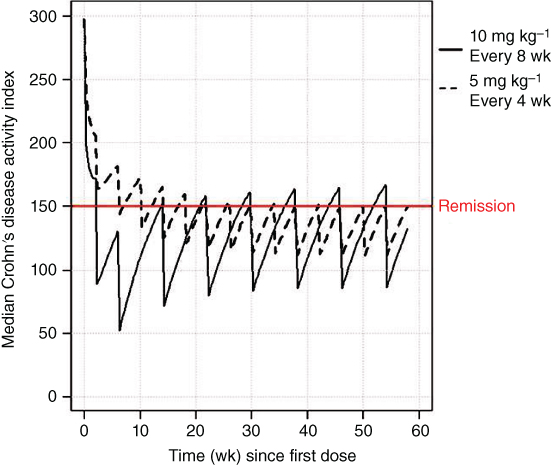
Figure 5.6 Median CDAI following a labeled infliximab dosing regimen and a proposed shortened interval.
5.6.1.2 CR100 K‐PD Model
In all, there were 153 data points for CR100 representing the number of subjects with CR100 from 38 arms in 13 studies. Q was estimated only for adalimumab. The K parameters indicated that only natalizumab, certolizumab, CDP870, vedolizumab, and infliximab had an effect on the probability of CR100. The attack‐decay characteristics of the different treatments were dosing regimen‐dependent. Simulations for how the model can be used to compare the efficacy of infliximab dosing regimens are shown in Figure 5.7. This plot compares the ranges of probabilities of CR100 for the same dosing regimens of infliximab shown above in the CDAI results, where 5 mg kg−1 at Weeks 0, 2, and 6 and then every eight weeks for maintenance or 5 mg kg−1 Weeks 0, 2, and 6 and then 10 mg kg−1 every eight weeks for maintenance. The probability of achieving CR100 increased in a dose‐dependent manner for infliximab during the induction phase of treatment.
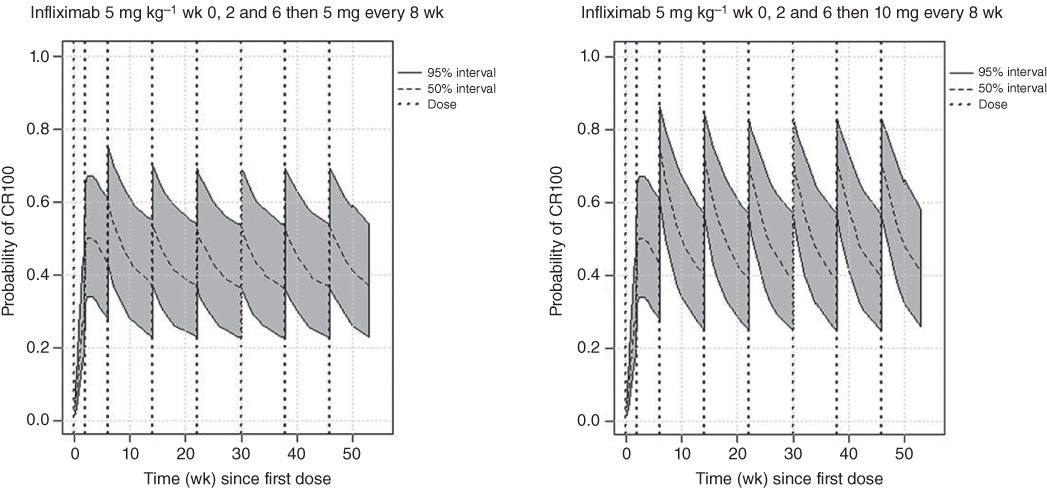
Figure 5.7 CR100 and infliximab with labeled dosing regimens.
5.6.1.3 C‐Reactive Protein K‐PD Model
For the CRP, the K parameters indicated that all drugs except infliximab and certolizumab (both of which confidence intervals, CIs, contained zero) had a statistically significant effect (Table 5.2). Typical placebo, infliximab, and vedolizumab CRP response vs. time curves in the left panel and a VPC in the right panel are presented in Figure 5.8. The VPC of CRP vs. time, median and 80% PI suggests a good predictive ability of the model.

Figure 5.8 C‐reactive protein response and visual predictive check plot. mg, milligram, kg, kilogram, CRP, C‐reactive protein, VPC, visual predictive check, MLN0002* = vedolizumab.
Figure 5.9 is a plot of the range of CRP concentrations for the same two dosing regimens for infliximab. A line showing the concentration of CRP where remission occurs (10 mg l−1) is displayed. The median CRP concentration only plot is shown in Figure 5.10. The results are similar to the CDAI results, where the higher maintenance dose results in a greater decrease in CDAI during maintenance and this level remained stable throughout the first year of treatment. The majority of patients remained in remission after Week 20 for the 10 mg kg−1 every eight weeks maintenance dose.

Figure 5.9 C‐reactive protein and infliximab proposed dosing regimens.
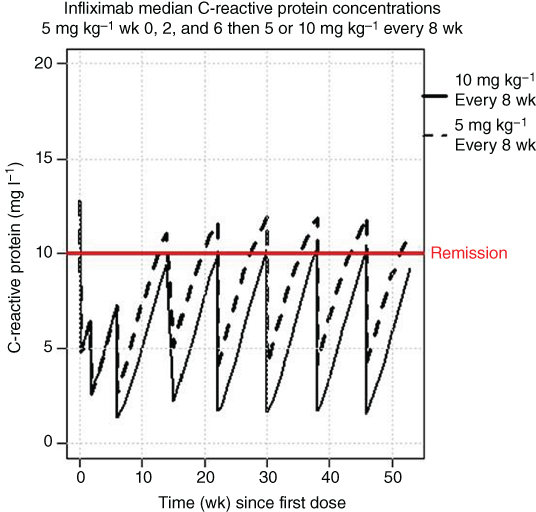
Figure 5.10 Median C‐reactive protein concentrations following infliximab treatment. mg ‐ milligrams, kg ‐ kilograms, wk ‐ week.
5.6.1.4 Immunogenicity K‐PD Model
In all, there were 12 data points representing the number of subjects with ADA. Because of the limited amount of published data available for this PD endpoint, only a simple model could be developed.
From the intercept (INT) term, it might be concluded that there was a nonzero probability of immunogenicity for a placebo subject. Ideally, the probability of developing ADA for placebo should be close to zero. Also, low doses of biological agents can be, and often are, more immunogenic than higher doses. The problem in this evaluation was that that neither data from placebo nor very low doses were available. Consequently, the INT term might be best thought of as an estimate of the maximum of such a function, beyond which the probability of immunogenicity decreased with increasing exposure. Exposure to certolizumab, natalizumab, and vedolizumab was inversely related to the probability of ADA (K parameters in Table 5.2).
VPCs of immunogenicity vs. time, mean, and 80% PI suggested good predictive ability of the model (Figure 5.11). The simulated percent of subjects that developed ADA after treatment with vedolizumab or certolizumab is displayed in Figure 5.12. As indicated from the INT function and decreased immunogenicity of biologics at higher doses, the percent of subjects with ADA decreased with increasing dose. These decreases were observed both during the induction (Day 55) and the maintenance (Day 167) phases of certolizumab treatments.
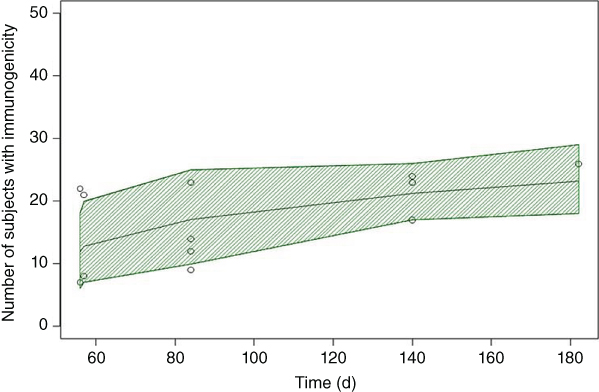
Figure 5.11 Visual predicative check of immunogenicity vs. time; The center solid line represents the mean and the shaded area is the 80% prediction interval.
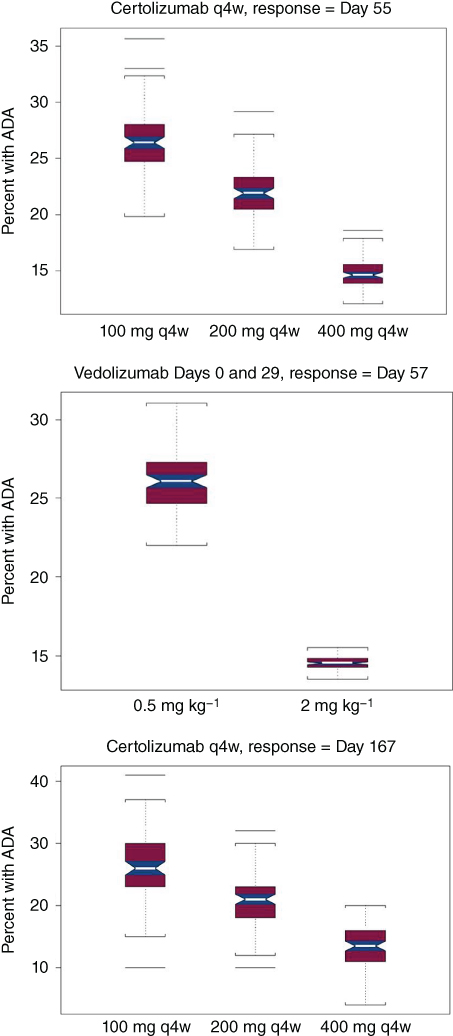
Figure 5.12 Percent of subjects with anti‐drug antibodies (ADAs) vs. dose.
5.7 MBMA Implications for Inflammatory Bowel Disease
The above results of a MBMA for response metrics CDAI, CR100, CRP, and ADA following treatment with biologics commonly used to treat IBD using K‐PD models indicate that the models described here can be used to simulate clinical results for IBD therapies during induction and maintenance. With minimal clinical data, these models can identify therapies that are likely to be effective without the time and expense of running large clinical trials. In addition, it may be possible to identify potentially useful dose strategies on which to design clinical trials. These models can also provide an estimated range of responses that can be used as a comparator to other therapeutic agents used to treat IBD. Therefore, the magnitude of clinical effects can be compared to the known effects of established therapies, and dosing can be adjusted to provide enhanced treatment benefits. The models may also be used to predict the effects of combination therapies for the treatment of IBD.
In conclusion, these models should have general utility in evaluating and developing new therapies for IBD. Although the present evaluations have concentrated on evaluating the response to treatment with biologics, meta‐analysis can be applied to other treatments for IBD, such as small molecules, making this approach an important tool in drug development. Because of the necessarily empirical nature of these models and the fact that the K terms (representing drug response) are different for each agent for the biomarkers evaluated, the activity of these agents could not be combined into a universal model by normalizing for dose.
5.8 Example 2: MBMA in Rheumatoid Arthritis
Rheumatoid arthritis (RA) is an autoimmune disease in which the body's immune system attacks joint tissue, causing chronic inflammation of the joint lining resulting in joint pain, stiffness, and sometimes even loss of normal movement. RA symptoms vary in severity and are intermittent with periods of increased disease activity alternating with periods of relative remission. Over time, RA can cause bone erosion and joint deformity. While there is no cure for RA, physical therapy, and medication can help slow the disease's progression, significantly reduce pain and limit potential permanent damage. Most cases can be managed with a class of medications called disease‐modifying anti‐rheumatic drugs (DMARDs), which are immunosuppressants.
Wang et al. [56] reported a MBMA focusing on DMARDs in the treatment of RA. The research explored the feasibility of employing clinical trials of shorter duration than the typical six months to assess efficacy. The metric of primary clinical interest was a 50% improvement in symptoms as measured by the American College of Rheumatology score (ACR50) [56].
Attention was restricted to randomized, controlled trials reporting ACR50 responses at both three and six months. Trials allowing crossover from active treatment to placebo were discarded. The number of subjects achieving the ACR50 response at time t in the jth arm of the ith trial, (Xijt), out of a sample size of Nij, were assumed to be distributed binomially (Nij, Pijt). The probability of an ACR50 at time t in the jth arm of the ith trial (Pijt) was modeled as shown in Eq. (5.12):
The θit are fixed‐effect parameters modeling the control contribution in the ith trial at time t. The trtij are fixed‐effects parameters modeling the treatment contribution in the jth arm of the ith trial. The scale parameter λt, is fixed to unity at the three‐month time point and was estimated for the six‐month time point using both a fixed effect parameter and a random effect parameter to model between trial variability. Additionally, drug class, mean patient baseline DAS28 (a continuous measure of disease severity), patient status in terms of response to previous therapies, disease duration, magnitude of the estimated control arm response, and various demographic variables were tested as predictors on the scale factor λt [7].
The scale factor was estimated to be 0.997 (95% CI 0.903–1.09) indicating a strong association between the ACR50 response at three and six months. The between‐trial variability term on the scale factor was not needed, and none of the scale predictors proved useful. This work suggests that three‐month data may be predictive of six‐month data.
5.9 Conclusion
The concept of MBMA was first put into practice in 1976 but since has become a cutting‐edge approach whose full potential has yet to be realized. This method of combining multiple studies to strengthen statistical analysis of data is applicable to all phases of drug development. With careful planning and used in conjunction with the NONMEM system, MBMA has shown to be successful in pharmacometric applications. Presented herein were examples of MBMA used with IBD and RA. In both instances, MBMA generated new analyses of available data to better understand the scope of the individual data from all the studies combined. MBMA can also be used with other disease types such as in oncology, where it has been applied to multiple melanoma [57]. This methodology can also be used to analyze the variability in response between patients particularly within identified subpopulations, and therefore, lead to more appropriate dosing for complex and often expensive treatments. A key step, however, is the standardization of reporting MBMA results, which would allow for the development of better models. Overall, MBMA is effective in leveraging study data for strategic decision‐making in all aspects of drug development.
References
- 1 Mould, D.R. (2012). Model‐based meta‐analysis: an important tool for making quantitative decisions during drug development. Clin. Pharmacol. Ther. 92 (3): 283–286. https://doi.org/10.1038/clpt.2012.122.
- 2 Glass, G.V. (1976). Primary, secondary, and meta‐analysis of research. Educ. Res. 5 (10): 3–8.
- 3 Pearson, K. (1904). Report on certain enteric fever inoculation statistics. Br. Med. J. 3: 1243–1246.
- 4 Boucher, M. and Bennetts, M. (2016). The many flavors of model‐based meta‐analysis: Part I – Introduction and landmark data. CPT Pharmacometrics Syst. Pharmacol. 5 (2): 54–64.
- 5 Rogers, J.A., Polhamus, D., Gillespie, W.R. et al. (2012). Combining patient‐level and summary‐level data for Alzheimer's disease modeling and simulation: a beta regression meta‐analysis. J. Pharmacokinet. Pharmacodyn. 39 (5): 479–498. https://doi.org/10.1007/s10928‐012‐9263‐3.
- 6 Davda, J.P., Dodds, M.G., Gibbs, M.A. et al. (2014). A model‐based meta‐analysis of monoclonal antibody pharmacokinetics to guide optimal first‐in‐human study design. MAbs 6 (4): 1094–1102.
- 7 Ocampo‐Pelland, A.S., Gastonguay, M.R., French, J.F., and Riggs, M.M. (2016). Model‐based meta‐analysis for development of a population‐pharmacokinetic (PPK) model for Vitamin D3 and its 25OHD3 metabolite using both individual and arm‐level data. J. Pharmacokinet. Pharmacodyn. 43 (2): 191–206.
- 8 Bailar, J.C. 3rd (1997). The promise and problems of meta‐analysis. N. Engl. J. Med. 337: 559–561.
- 9 Light, R.J. and Pillemer, D.B. (1984). Summing Up: The Science of Reviewing Research. Cambridge, MA: Harvard University Press.
- 10 Jones, A.P., Riley, R.D., Williamson, P.R., and Whitehead, A. (2009). Meta‐analysis of individual patient data versus aggregate data from longitudinal clinical trials. Clin. Trials 6 (1): 16–27.
- 11 Montgomery, H.L. (2014). Early Fourier Analysis, vol. 22. Providence, RI: American Mathematical Society.
- 12 Ahn, J.E. and French, J.L. (2010). Longitudinal aggregate data model‐based meta‐analysis with NONMEM®: approaches to handling within treatment arm correlation. J. Pharmacokinet. Pharmacodyn. 37: 179–201.
- 13 Peyrin‐Biroulet, L. and Lemann, M. (2011). Review article: remission rates achievable by current therapies for inflammatory bowel disease. Aliment. Pharmacol. Ther. 33: 870–879.
- 14 Frame, B. (2016). Combining Various Measures of Central Tendency in MBMA ACoP 2016 Meeting, Bellevue Washington (04 May).
- 15 Rutgeerts, P., Sandborn, W.J., Feagan, B.G. et al. (2005). Infliximab for induction and maintenance therapy for ulcerative colitis. N. Engl. J. Med. 353: 2462–2476.
- 16 Hanauer, S.B., Feagan, B.G., Lichtenstein, G.R. et al. (2002). Maintenance infliximab for Crohn's disease: the ACCENT I randomised trial. Lancet 359: 1541–1549.
- 17 Targan, S.R., Hanauer, S.B., van Deventer, S.J. et al. (1997). A short‐term study of chimeric monoclonal antibody cA2 to tumor necrosis factor alpha for Crohn's disease. N. Engl. J. Med. 337: 1029–1035.
- 18 Hanauer, S.B., Sandborn, W.J., Rutgeerts, P. et al. (2006). Human anti‐tumor necrosis factor monoclonal antibody (adalimumab) in Crohn's disease: the CLASSIC‐I trial. Gastroenterology 130: 323–333; quiz 591.
- 19 Colombel, J.F., Sandborn, W.J., Rutgeerts, P. et al. (2007). Adalimumab for maintenance of clinical response and remission in patients with Crohn's disease: the CHARM trial. Gastroenterology 132: 52–65.
- 20 Billioud, V., Sandborn, W.J., and Peyrin‐Biroulet, L. (2011). Loss of response and need for adalimumab dose intensification in Crohn's disease: a systematic review. Am. J. Gastroenterol. 106: 674–684.
- 21 Best, W.R., Becktel, J.M., Singleton, J.W., and Kern, F. Jr. (1976). Development of a Crohn's disease activity index. National Cooperative Crohn's Disease Study. Gastroenterology 70: 439–444.
- 22 Thompson, D., Pepys, M.B., and Wood, S.P. (1999). The physiological structure of human C‐reactive protein and its complex with phosphocholine. Structure 7: 169–177.
- 23 Mandema, J.W., Gibbs, M., Boyd, R.A. et al. (2005). Model‐based meta‐analysis for comparative efficacy and safety: application in drug development and beyond. N. Engl. J. Med. 352 (24): 2499–2507.
- 24 Lalonde, R.L., Kowalski, K.G., Hutmacher, M.M. et al. (2007). Model‐based drug development. Clin. Pharmacol. Ther. 82: 21–32.
- 25 Feagan, B.G., Greenberg, G.R., Wild, G. et al. (2005). Treatment of ulcerative colitis with a humanized antibody to the a4b7 integrin. N. Engl. J. Med. 352: 2499–2507.
- 26 Ghosh, S., Goldin, E., Gordon, F.H. et al. (2003). Natalizumab for active Crohn's disease. N. Engl. J. Med. 348: 24–32.
- 27 Centocor Ortho Biotech, Inc. (1998). A placebo‐controlled, dose‐ranging study followed by a placebo‐controlled, repeated extension of anti‐TNF chimeric monoclonal antibody (ca2) in the treatment of patients with active Crohn's disease. (Protocol T16 [C0168T16]). Biological License Agreement # 98–0012.
- 28 Sandborn, W.J., Colombel, J.F., Enns, R. et al. (2005). Natalizumab Induction and maintenance therapy for Crohn's disease. N. Engl. J. Med. 353: 1912–1925.
- 29 Hommes, D.W., Mikhajlova, T.L., Stoinov, S. et al. (2006). Fontolizumab, a humanised anti‐interferon gamma antibody, demonstrates safety and clinical activity in patients. Gut 55: 1131–1137.
- 30 Reinisch, W., Hommes, D.W., Van Assche, G. et al. (2006). A dose escalating, placebo‐controlled, double‐blind, single‐dose, and multidose, safety and tolerability study of fontolizumab, a humanised anti‐interferon gamma antibody, in patients with moderate to severe Crohn's disease. Gut 55: 1138–1144.
- 31 Rutgeerts, P., Sandborn, W.J., Fedorak, R.N. et al. (2006). Onercept for moderate‐to‐severe Crohn's disease: a randomized, double‐blind, placebo‐controlled trial. Clin. Gastroenterol. Hepatol. 4888–4893.
- 32 Schreiber, S., Rutgeerts, P., Fedorak, R.N. et al. (2005). A randomized, placebo‐controlled trial of certolizumab pegol (CDP870) for treatment of Crohn's disease. Gastroenterology 129: 807–818.
- 33 Tilg, H., Vogelsang, H., Ludwiczek, O. et al. (2003). A randomized, placebo‐controlled trial of pegylated interferon alpha in active ulcerative colitis. Gut 52: 1728–1733.
- 34 Sandborn, W.J., Feagan, B.G., Hanauer, S.B. et al. (2001). An engineered human antibody to TNF (CDP571) for active Crohn's disease: a randomized double‐blind placebo‐controlled trial. Gastroenterology 120: 1330–1338.
- 35 Probert, C.S., Hearing, S.D., Schreiber, S. et al. (2003). Infliximab in moderately severe glucocorticoid‐resistant ulcerative colitis: a randomized‐controlled trial. Gut 52: 998–1002.
- 36 Slonim, A.E., Bulone, L., Damore, M.B. et al. (2000). A preliminary study of growth hormone therapy for Crohn's disease. N. Engl. J. Med. 342: 1633–1637.
- 37 Gordon, F.H., Hamilton, M.I., Donoghue, S. et al. (2002). A pilot study of treatment of active ulcerative colitis with natalizumab, a humanized monoclonal antibody to α‐4 integrin. Aliment Pharmacol. Ther. 16: 699–705.
- 38 Asakura, H., Yao, T., Matsui, T. et al. (2001). Efficacy of treatment with chimeric monoclonal antibody (infliximab) to tumor necrosis factor‐α for Crohn's disease in Japan: evaluation by rapid turnover proteins, and radiologic and endoscopic findings. J. Gastroenterol. Hepatol. 16: 763–769.
- 39 Present, D.H., Rutgeerts, P., Targan, S. et al. (1999). Infliximab for the treatment of fistulas in patients with Crohn's disease. N. Engl. J. Med. 340: 1398–1405.
- 40 Sands, B.E., Anderson, F.H., Bernstein, C.N. et al. (2004). Infliximab maintenance therapy for fistulizing Crohn's disease. N. Engl. J. Med. 350: 876–885.
- 41 Lemann, M., Mary, J.Y., Duclos, B. et al. (2006). Infliximab plus azathioprine for steroid‐dependent Crohn's disease patients: a randomized placebo‐controlled trial. Gastroenterology 130: 1054–1061.
- 42 Rutgeerts, P., Feagan, B.G., Lichtenstein, G.R. et al. (2004). Comparison of scheduled and episodic treatment strategies of infliximab in Crohn's disease. Gastroenterology 126: 402–413.
- 43 Colombel, J.F. et al. Adalimumab induces and maintains clinical response and remission in patients with active Crohn's disease: results of the CHARM trial [abstract 686d]. Presented at Digestive Disease Week 2006, Los Angeles, CA (23 May 2006).
- 44 Moyer, P. Adalimumab shows promise in infliximab‐intolerant patients with Crohn's disease [abstract 8]. Presented at American College of Gastroenterology 2006 Annual Scientific Meeting and Postgraduate Course, Las Vegas, NV (23 October 2006).
- 45 Targan, S.R., Feagan, B.G., Fedorak, R.N. et al. (2007). Natalizumab for the treatment of active Crohn's disease: results of the ENCORE trial. Gastroenterology 132: 1672–1683.
- 46 Feagan, B.C., Greenberg, G.R., Wild, G. et al. (2008). Treatment of active Crohn's disease with MLN0002, a humanized antibody to the a4b7 integrin. Clin. Gastroenterol. Hepatol. 6: 1370–1377.
- 47 Rutgeerts, P., Schreiber, S., Feagan, B. et al. (2008). Certolizumab pegol, a monthly subcutaneously administered fc‐free anti‐TNFα, improves health‐related quality of life in patients with moderate‐to‐severe Crohn's disease. Int. J. Color. Dis. 23: 289–296.
- 48 Sandborn, W.J., Schreiber, S., Feagan, B.G. et al. (2007). Certolizumab pegol for the treatment of Crohn's disease. N. Engl. J. Med. 357: 228–238.
- 49 Winter, T.A., Wright, J., Ghosh, S. et al. (2004). Intravenous CDP870, a PEGylated Fab′ fragment of a humanized anti‐tumour necrosis factor antibody, in patients with moderate‐to‐severe Crohn's disease: an exploratory study. Aliment Pharmacol. Ther. 20: 1337–1346.
- 50 Sandborn, W.J., Feagan, B.G., Fedorak, R.N. et al. (2008). A randomized trial of ustekinumab, a human interleukin‐12/23 monoclonal antibody, in patients with moderate‐to‐severe Crohn's disease. Gastroenterology 135: 1130–1141.
- 51 Gabrielsson, J., Jusko, W.J., and Alari, L. (2000). Modeling of dose‐response‐time data: four examples of estimating the turnover parameters and generating kinetic functions from response profiles. Biopharm. Drug Dispos. 21 (2): 41–52.
- 52 Pillai, G., Gieschke, R., Goggin, T. et al. (2004). A semimechanistic and mechanistic population PK–PD model for biomarker response to ibandronate, a new bisphosphonate for the treatment of osteoporosis. Br. J. Clin. Pharmacol. 58 (6): 618–631.
- 53 Jacqmin, P., Snoeck, E., van Schaick, E.A. et al. (2007). Modelling response time profiles in the absence of drug concentrations: definition and performance evaluation of the K‐PD model. J. Pharmacokinet. Pharmacodyn. 34: 57–85.
- 54 Manly, B.F.J. (1976). Exponential data transformations. Statistician 25: 37–42.
- 55 Pan, W.‐J., Gibbs, M., Frame, B., and Mould, D.R. (2012). Model based meta analyses of disease metrics in patients with Crohn's disease. ACCP National Meeting 2012, Chicago IL (4 July).
- 56 Wang, Y., Zhu, R., Xiao, J. et al. (2016). Short‐term efficacy reliably predicts long‐term clinical benefit in rheumatoid arthritis clinical trials as demonstrated by model‐based meta‐analysis. J. Clin. Pharmacol. 56: 835–884.
- 57 Teng, Z., Gupta, N., Hua, Z. et al. (2003). Model‐based meta‐analysis for multiple myeloma: a quantitative drug‐independent framework for efficient decisions in oncology drug development. Clin. Transl. Sci. 52: 1728–1733.