13
Quantitative Pharmacology Approach to Select Optimal Dose and Study the Important Factors in Determining Disposition of Therapeutic Monoclonal Antibody in Pediatric Subjects – Some Considerations
Deni Hardiansyah and Chee M. Ng
University of Kentucky, College of Pharmacy, Lexington, KY, 40536, USA
13.1 Introduction
The use of therapeutic monoclonal immunoglobulin G (IgG) monoclonal antibodies (mAb) has grown significantly after the first commercialization of muromonab (Orthoclone OKT3®) in 1986 [1] due to their desirable features such as long serum half‐lives, limited off‐target toxicity, and high specificity and potency [2,3]. Five of the top 10 selling drugs in 2017 are mAbs, namely adalimumab (Humira®), infliximab (Remicade®), rituximab (Rituxan®), bevacizumab (Avastin®), and trastuzumab (Herceptin®) [4,5]. mAb is the best‐selling class of biologics with global annual revenue of nearly $100 billion, which represents approximately half of the total sales of all biopharmaceutical products [6,7]. It is anticipated that there will be ∼70 mAb products on the market by 2020 and combined worldwide sales of nearly $125 billion [8].
Table 13.1 List of approved mAbs in Europe (European Medicine Agency, EMA) and US (Food and Drug Administration, FDA) for pediatric indications.
| Name of the mAb | Approved indication in pediatric | Approved age range | Administration | Type | Source |
| Adalimumab |
Crohn's disease Polyarticular juvenile idiopathic arthritis |
≥6 yrb ≥4 yra; ≥2 yr b |
SC SC |
Human | [ 2 ,11] |
| Basiliximab | Prophylaxis of acute organ rejection | ≥1 yr b | IV bolus | Chimeric | [ 2 , 11 ] |
| Burosumab | X‐linked hypophosphatemia | ≥1 yr b | SC | Human | [10] |
| Canakimumab |
Cryopyrin‐associated periodic syndromes Systemic juvenile idiopathic arthritis |
≥4 yr a
; ≥2 yr and ≥7.5 kg b ≥2 yr a , b |
SC | Human | [ 2 , 11 ] |
| Daclizumab | Prophylaxis of acute kidney rejection | ≥11 mo a | IV infusion | Humanized | [ 2 , 11 ] |
| Denosumab | Giant cell tumor bone | Skeletally mature adolescents a | SC | Human | [ 2 , 11 ] |
| Dinutuximab | Neuroblastoma |
≥1 yr b
≥11 mo a |
IV infusion | Chimeric | [9,12] |
| Eculizumab |
Atypical hemolytic urenic syndrome Paroxysmal nocturnal hemoglobinuria |
Not specified, BW from 5 kg b
Not specified, BW from 5 kg b |
IV infusion IV infusion |
Humanized | [ 2 , 11 ] |
| Emicizumab | Hemophilia A | ≥1 mo a | SC | Humanized | [13] |
| Evolocumab | Heterozygous familial hypercholesterolemia (HeFH)/clinical atherosclerotic cardiovascular disease (CVD) |
≥13 yr a
≥13 yr b |
SC | Human | [14] |
| Infliximab |
Crohn's disease Ulcerative colitis |
≥6 yr a
, b
≥6 yr a , b |
IV infusion IV infusion |
Chimeric | [ 2 , 11 ] |
| Mepolizumab | Severe asthma | ≥12 yr a | SC | Humanized | [15] |
| Omalizumab |
IgE‐mediated asthma Chronic spontaneous/idiopathic urticaria |
≥12 yr a
; ≥6 yr b ≥12 yr a , b |
SC SC |
Humanized | [ 2 , 11 ] |
| Palivizumab | RSV injection | 35 wk gestational age to 2 yr a , b | IM | Humanized | [ 2 , 11 ] |
| Raxibacumab | Anthrax inhalation | Not specified, dose by BW a | IV infusion | Human | [ 2 , 11 ] |
| Tocilizumab |
Polyarticular juvenile idiopathic arthritis Systemic juvenile idiopathic arthritis |
≥2 yr a
, b
≥2 yr a , b |
IV infusion IV infusion |
Humanized | [ 2 , 11 ] |
aApproved by the FDA.
bApproved by the EMA.
Recently, the use of mAbs has increased in the pediatric population for many indications such as organ transplantation, inflammatory diseases, and oncology [2] . As per 2018, 16 mAbs have been approved for use in pediatric patients (13 of them are in the United States) [ 2 9 – 15 ]. All of the approved mAbs are chimeric, humanized, or fully human mAb (Table 13.1), with the exception of muromonab‐CD3 (OKT3), which is a murine mAb indicated for use in the treatment of acute, glucocorticoid‐resistant rejection of allogeneic renal, heart, and liver transplants. Three mAbs approved for the youngest children are emicizumab (infant from 1 month) [13] , palivizumab (neonates with a gestational age of at least 35 weeks) [16–18], and daclizumab (infants from 11 months) [19]. Most mAbs are approved for use in pediatric patients aged from 1 to 13 years as shown in Table 13.1 . Two mAbs, i.e. eculizumab and raxibazumab, which are dosed based on body weight (BW) as the criterion instead of using patient age. The mAbs are either administered intravascularly, subcutaneously, or intramuscularly due to their poor oral bioavailability [ 2 , 11 ]. Most of the administration routes for mAbs in pediatrics are adapted from the adults [2] .
Despite the fact that several mAbs were approved for pediatric indications, drug development for pediatric indications has often lagged behind the development for the treatment of adult disease, possibility due to ethical considerations, lack of financial incentives, and a lack of mandatory regulatory requirements for pediatric drug development in the past [20,21]. Several rigorous pediatric guidelines including the US Pediatric Research Equity Act (PREA) [22] and “Pediatric Regulation” of PIP (EC No. 1901/2006) introduced by European Union in 2007 [23]. These guidelines have been formulated to request the participation of pharmaceutical companies in performing adequate clinical studies to assess the safety and effectiveness of any new medical products for the claimed indication(s) in pediatric patients unless this pediatric requirement is waived, deferred, or inapplicable [21] .
Although both PIP and PREA have a lot of similarities, there are several differences between the plans, including focus (indication in PREA vs. study condition in PIP), the review process, and timelines (see Refs. [ 22 , 23 ] for details). Currently, there are 75 mAbs registered with PIP and/or PREA [ 2 ,24,25]. Studies for some of those drugs are planned for the children older than two years old. Clearly, these pediatric regulations have resulted in rapid increase in ongoing pediatric studies. It has been projected that the approval mAbs for pediatric use will increase in near future.
The most important aspect of drug development is to achieve desirable clinical efficacy while minimizing the toxicity of the investigated drug. Thus, the drug development research should be able to explain the pharmacokinetics (PKs) of the drug, establish the relationships between drug exposure and clinical outcomes and toxicity, and understand the complex interaction between drug and disease states. With few exceptions, most of the pediatric dose selection of mAb is based on the prior information from adult population. Figure 13.1 illustrates the general scheme of the complex interaction between PK, pharmacodynamics (PDs), and disease state for the pharmacotherapy in adult and pediatric population. In theory, based on the prior information from adults, the pediatric dose can be determined if the relationships between PK/PD/disease state in pediatric and adult patient populations are known. However, very little information is available about the relationships between the PK, PD, and the disease states in adult and pediatric populations. As a result, the PD and disease state are usually assumed to be the same between these two populations and only PK information is used to calculate the pediatric dose based on adult data [ 2 ,26]. Therefore, only PK considerations for the pediatric dose scaling of mAbs are discussed in the following sections in this chapter.
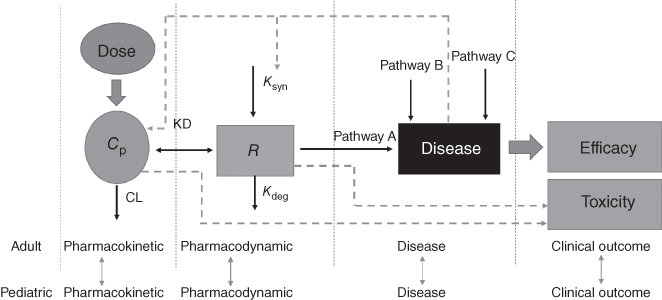
Figure 13.1 Pharmacokinetic–pharmacodynamic–disease relationship of pharmacotherapy in adult and pediatric population. Cp, drug concentrations; R, targeted receptor; Ksyn, endogenous synthesis rate of receptor; Kdeg, endogenous degradation rate of receptor; Kd, binding rate constant of drug and receptor; CL, drug clearance.
13.2 Pharmacokinetics of Therapeutic Monoclonal Antibody in Pediatric Population
Pharmacokinetics (PK) refers to the disposition of the drug after dosing and consists of processes of absorption, distribution, metabolism, and elimination. The small‐molecular drugs have a wealth of information on developmental changes in the important factors (i.e. metabolizing enzymes and renal functions) that affect the PK of the drugs [27]. In contrast, there have been very few studies reported in the literature that have investigated the developmental changes in the absorption, distribution, and elimination of mAbs.
mAbs have poor oral bioavailability due to degradation and inefficient diffusion and convection through gastrointestinal tract [3] . As a result, all marketed mAbs are administered parenterally. Among the 16 mAbs approved with pediatric indications, 7 are administered intravenously (IV), 8 subcutaneously (SC), and 1 intramuscularly (IM) (Table 13.1 ). SC administration of mAb offers several potential advantages compared with IV administration including the ability to administer the drugs by a health‐care professional at the patient's home or even by patient self‐administration for many long‐term and chronic drug treatment, and maybe able to be better tolerated due to relatively low serum drug concentrations from the slow absorption after SC administration [28]. Therefore, it is anticipated that SC injection is increasingly chosen as the preferred route of administration in the development of mAbs in pediatric population. Following SC administration, the mAbs is injected into subcutaneous tissues (hypodermis), where the drug resides and is absorbed into blood or lymphatic capillaries and the convective transport through lymphatic system is believed as the main pathway of the SC absorption [29]. The typical time to reach the maximum serum concentration is about two to eight days and the bioavailability has been reported between 50% and 100% in adults [30] for SC administration. There are several other factors that can affect the subcutaneous absorption and bioavailability of the mAbs, such as formulation of the related factors (e.g. injection volume) and patient‐specific factors (e.g. tissue structure of hypodermis, local blood and lymphatic flow, and Fc receptor [FcRn]) [29] . However, it is not yet known whether the differences in these factors would cause differences in bioavailability of mAbs between adults and pediatric population. For example, although animal studies in mice suggested the important role of FcRn receptor to the absorption of mAbs in SC administration [31], the role of FcRn to the physiological changes during child growth is not well‐defined. Therefore, more studies are needed to get a better understanding of the subcutaneous absorption characteristics in children.
Due to its relatively large size (MW ∼ 150 kDa), mAbs are not readily distributed in the body and generally do not enter into the cells as small molecular drugs (MW < 1 kDa) [ 3 , 30 ,32,33]. Therefore, the distribution of mAb is mainly restricted to vascular and interstitial space [3] . The convection and/or diffusion are believed to be the main transport mechanisms for the distribution of mAbs. These mechanisms are affected by the lymph flow, the reflection coefficient of the small and large pores in the vascular endothelium, and the permeability surface area [34–36]. In addition, the distribution of a mAbs may be influenced by binding to plasma and tissue target antigen [ 21 ,37] if the antigen concentration levels are comparable to the serum antibody concentrations. Plasma volume is one of the major determinants for the distribution of mAbs. The plasma volume is shown to be similar between the children (>1 years old) and adult after normalization with the BW [38]. However, the effects of age on other factors such as interstitial space and lymphatic drainage are largely unknown. For practical considerations, it is assumed that there is no clinically meaningful difference in the distribution of mAbs between adult and pediatric populations after differences in body size are properly taken into account [21] . However, it has been shown that the body size‐normalized plasma volume in children less than one year is higher than that in adults and therefore, more studies are needed in order to better understand the distribution of mAbs in these infant pediatric populations [38] .
Elimination through the glomerular filtration in the kidneys is low and insignificant due to large size of antibody [3] . There are two major types of elimination of mAb: nonspecific clearance (CL) involving Fcγ‐ and FcRn‐mediated catabolism, and target‐mediated drug disposition (TMDD) [39]. The FcRn receptor affects the nonspecific route as it can recycle back a mAb to the blood and/or interstitial space and plays a major role in the long half‐life of a mAb [40]. Up to now, the information of FcRn expression and its effect on the PK of mAbs in children remain largely unknown. Fcγ‐mediated endocytosis/phagocytosis plays an important role in the elimination of IgG that bind to viruses, bacteria, and target receptors [3] . However, it is well known that the contribution of Fcγ‐mediated endocytosis to the nonspecific clearance of therapeutic mAbs is very limited [41]. TMDD involves the interaction between mAb and its target receptor. Depending on the biology and the level of the target receptors, the presence of the TMDD can either lead to linear or saturable nonlinear PK. Therefore, TMDD can cause age‐dependent PK changes of mAbs if the TMDD plays an important role in the PK and the biology and target receptors are different between the children and adult population. For more detail on TMDD, please refer to Chapters 7 and 8.
13.3 Quantitative Pharmacology Considerations to Select Optimal Pediatric Dose of mAbs Based on Adult PK Studies
Dose selection of mAbs in pediatric subjects is often based on the assumption that disease and PD in children are similar to those in adult, and only prior information of PK data in adults is used for dose selection [ 2 , 26 ]. The pediatric dose is usually selected to yield drug exposures that match those from adult doses that shown to be safe and efficacious [42]. The PK of the mAbs is affected by the body size, and other patient‐specific factors such as age, target‐antigen levels, and disease activity. Among these factors, size‐related changes have been well studied and frequently identified as the most clinically relevant covariate to affect PK of mAbs in the absence of the TMDD (Tables 13.2 and 13.3). Due to large differences in body size and lack of information about the effects of age‐related factors between the adult and pediatric population, the pediatric doses of mAbs are often selected using body size‐based approach [ 3 , 30 ,50].
Table 13.2 Examples of pharmacokinetic parameter values and dosing regimens in adults and pediatrics.
| Mean pharmacokinetic value | Dosing regimen | ||||
| Name of the mAb | Pharmacokinetic parameter | Adult | Pediatric | Adult | Pediatric |
| Adalimumab | Cmin (μg ml−1) | 8–9 | 8 | Fixed dosing |
Tiered fixed dosing (US) Adjusted based on BSA (Europe) |
| Basiliximab | Clearance (ml h−1) | 37 |
17 (0–11 yr) 31 (12–17 yr) |
Fixed dosing | Tiered fixed dosing |
| Daclizumab | Cmin (μg ml−1) | 7.6 | 5.0 | Adjusted based on weight | Adjusted based on weight |
| Infliximab | Clearance (ml (d−1 kg)−1) | 5.4 | 5.4 | Adjusted based on weight | Adjusted based on weight |
| Palivizumab | Clearance (ml (d−1 kg)−1) | 2.8 | 2.4 | Adjusted based on weight | Adjusted based on weight |
Source: Adapted from Xu et al. 2013 [21] .
Table 13.3 Examples of the clearance (CL) and/or volume of distribution (V) values of mAbs in pediatric studies.
| Name of the mAb | Target | Subjects | Age (yr) | Clearance and volume of distribution | Source |
| Adalimumab | TNF‐α | 189 | 6–17 |
  |
[43] |
| Basiliximab | IL‐2Rα |
Infant = 20 Children = 15 Adolescent = 2 Adult = 184 |
0.17–9 9–14 20–68 |
CL (ml h−1) = 19.3 V (l) = 2 CL (ml h−1) = 46.6 V (l) = 4 CL (ml h−) = 55 V (l) = 5.7 |
[44–46] |
| Bevacizumab | VEGF‐A | 152 | 0.5–21 |
  |
[47] |
| Daclizumab | IL‐2Rα |
18 18 25 |
0.9–5 6–12 13–17 |
CL (ml h−1) = 5.24 V (l) = 0.92 CL (ml h−1) = 10.8 V (l) = 1.68 CL (ml h−1) = 14.5 V (l) = 2.49 |
[19] |
| Infliximab | TNF‐α | 692 | 6–76 |
  |
[48] |
| Omalizumab | IgE Fc | 79 | 19–150 |
  |
[49] |
CL, drug clearance; θi, typical value of i; BSA, body surface area; BW, body weight; F, bioavailability; V, volume of distribution.
As shown in Table 13.2 , most of the dosing strategies in pediatric are adapted from those in adults. For example, the selection of a dosing regimen based on body weight or body surface area (BSA) is often chosen for pediatrics if the same regimen is used in adults. Several dosing approaches have been proposed to select the pediatric dose of mAbs based on the adult PK data. They include (i) weight (WT)‐based (mg kg−1) dosing, (ii) BSA‐based (mg m−2) dosing, (iii) tiered fixed dosing that uses the fixed dose for patients with a specific WT range, and (iv) hybrid dosing approach consisting of fixed dosing for older children and body size‐based dosing for younger children with smaller BW [21] (Table 13.2 ). Several excellent reviews have been published to examine the pros and cons of these different approaches in selecting pediatric dose of mAbs based on the adult PK data [ 21 , 42 ,51]. Therefore, only the important considerations that were not addressed in these reviews are discussed in this chapter.
The selection of the optimal body‐sized dosing approach of mAbs in human subjects is affected by many factors. These include the degree of relationship between the body size and PK parameters, the impact of body size in reducing the population variability of the PK parameters, the body size ranges in the targeted patient population, and desirable drug exposure (area under the concentration time curve [AUC] or peak concentration [Cmax]) ranges. Among these factors, the relationship between the body size and the PK parameters is the most important one in selecting different dosing approaches and can be described by the following normalized equation based on allometric scaling principles:
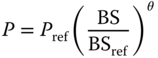
where P represents the PK parameter for subjects with body size BS, and Pref is the PK parameter for the reference subjects with body size BSref. θ is the exponent that used to describe the degree of relationship between the body size and the PK parameter. In theory, the fixed dosing approach is considered for human subjects only if θ is closed to zero, i.e. little or no relationships between body size and PK parameters. In contrast, linear dosing strategies by body size (i.e. mg kg−1 of BW or mg m−2 of BSA) is accurate when the θ is closed to one, i.e. perfect linear correlation between the body size and the PK parameters that affect the target drug exposures. The values of θ are highly variable with median of 0.62 and ranges of 0.00–1.16 for seven FDA‐approved mAbs in human subjects [52]. The ability of body size in decreasing the population variability of the PK parameters is another factor to consider in selecting different dosing approaches. The advantages of body size‐based dosing over fixed dosing approach in achieving consistent targeted drug exposure diminishes as the ability of body size in explaining the population variability of the PK parameters decreases for the adult population with limited body size ranges. The complex relationships between these factors play an important role in selecting different dosing approaches of mAbs in human subjects, as illustrated in the pertuzumab PK study reported by our group. Pertuzumab (Perjeta®) is a recombinant humanized mAb that targets the extracellular dimerization domain of the human epidermal growth factor receptor 2 protein (HER2) and its PK in adult cancer subjects is dependent on the body size [53]. However, the relationships between the body size and the PK parameters are less than perfect with θ = 0.587 for body weight on clearance and θ = 1.16 for BSA on volume of distribution in the central compartment (Vc). In addition, body size only explains small percentage of the population variability for CL and Vc, respectively. As a result, the BSA‐ and WT‐based dosing do not seem to improve the predictability of the pertuzumab steady‐state drug exposure compared to fixed dosing approach in adult cancer subjects with limited weight and BSA range (weight: 45.0–150.6 kg; BSA: 1.40–2.53 m2) in the simulation studies [53] . Therefore, in the presence of relatively large targeted drug exposure range of the pertuzumab, a fixed dosing regimen was proposed by our group to be used in the clinical studies and became the FDA‐approved dosing regimen for the treatment of adult subjects with HER‐2 positive metastatic breast cancer. A similar modeling and simulation approach was also used by our group to successfully justify the fixed‐dosing approach of the rituximab (Rituxan) in adult patients with rheumatoid arthritis [54]. Wang et al. conducted a simulation study to compare the performance of body size‐based and fixed dosing in reducing PK and/or PD variability in adults for 12 mAbs with published population PK and/or PD models [52] . Their study concluded that both dosing approaches perform similarly across the mAbs investigated and recommended using fixed dosing in early clinical studies in adult subjects because this dosing strategy offers several advantages such as lower risk of medical error, reduction in cost, ease of preparation, and administration [51] .
However, depending on the value of θ, a fixed dosing regimen is not always feasible in the pediatric population due to large body size variation. As illustrated in Figure 13.2, the fixed dosing approach achieves more consistent drug exposure measured by the AUC from time 0 to infinity (AUC0–∞) than the linear body‐sized dosing approach (i.e. mg kg−1 of body weight or mg m−2 of BSA) in pediatric subjects only if θ is close to 0. The body size dosing begins to outperform the fixed dosing approach when θ is approaching 1. As clearance and other important PK parameters of most mAbs are to some degree related to body size [52] , body size dosing is a more reasonable dosing approach compared to fixed dosing for mAbs in pediatric subjects. However, in the presence of the less‐than‐perfect linear relationships between the body size and PK parameters, the linear body size dosing strategies using either mg kg−1 or mg m−2 can produce inaccurate and biased drug exposures in pediatric subjects due to large body size variation. For example, in mAbs with the θ of 0.5 for the body size effects on clearance, the linear body size dosing approach underpredicts the drug exposure in the pediatric subjects (Figure 13.2 top left figure). This finding reinforces the idea that the value of θ is an important factor to consider in selecting appropriate body size dosing approach in pediatric subjects. In the following sections, we will describe a pediatric case study of using a quantitative approach in examining the effects of different θ values in the selection of optimal linear body size dosing strategy for a mAbs in pediatric subjects.
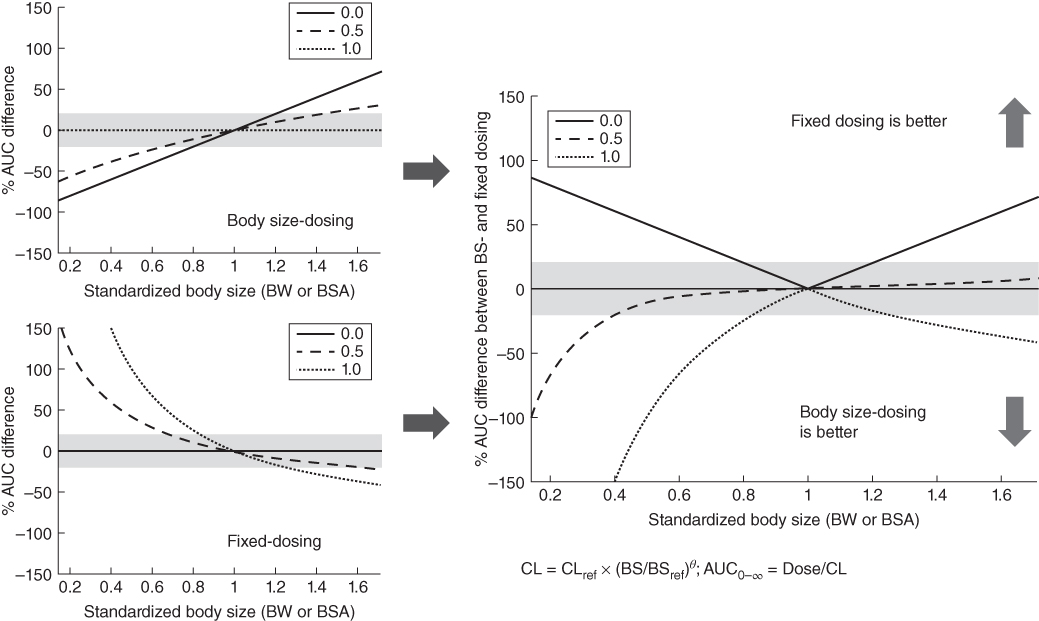
Figure 13.2 The comparison of AUC variability after body size and fixed dosing for pediatric patients with different body sizes. % AUC difference between BS‐ and fixed dosing = |% AUC difference of BW‐dosing| − |% AUC difference of fixed dosing|. Green shaded area = +20% from the reference; BW and BSA for reference patient: 70 kg and 1.73 m2; yellow shaded area = 95% percentile for the BW in children (2–11 years old).
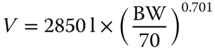
IGF1 is a fully human recombinant IgG1 monoclonal antibody that binds to the extracellular domain of IgF‐1 receptor. In adult subjects, IGF1 was dosed mg kg−1 and well tolerated on a weekly and every three weekly administration schedule at doses ranging from 1 to 16 mg kg−1. Dose‐limiting toxicity was not observed, and the maximum tolerated dose was not defined in the adult clinical studies. Then a Phase I clinical trial to study the PK and safety of IGF1 with linear body weight dosing regimen in 31 pediatric subjects was completed. The median age of the subjects was 11.0 (range: 3.2–18) years, the median body weight was 37 (range: 15–82) kg, and the median BSA was 1.2 (range: 0.63–1.9) m2. The results indicated that the pediatric subjects with low body weight were underexposed even after identical adult linear body weight (16 mg kg−1) dosing regimen was used in the study (Figure 13.3a). Population PK analysis using the data from pediatric subjects revealed a less‐than‐perfect relationship between body weight and clearance (θ = 0.708) as follows:
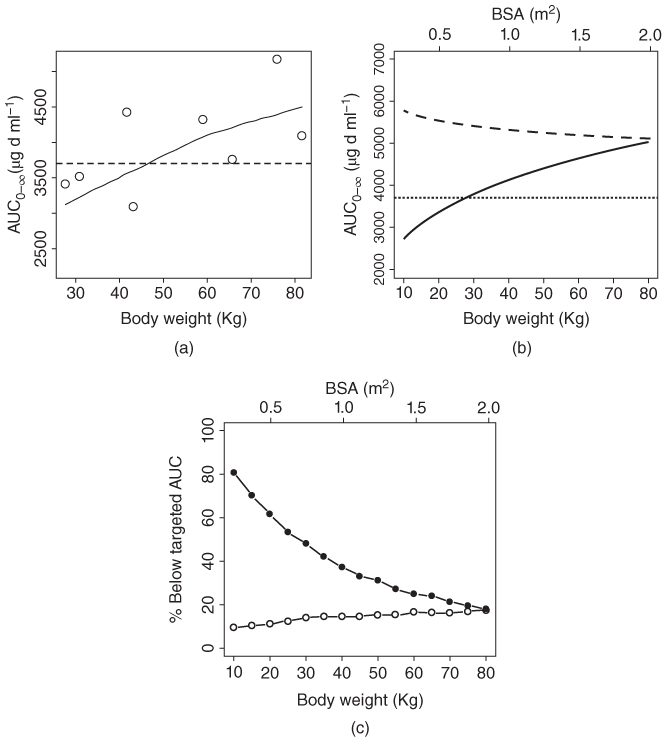
Figure 13.3 (a) AUC0–∞ vs. body weight of the pediatric subjects after 16 mg kg−1 every 3 week dosing of IGF1. Open circle, observed data; dashed line, targeted AUC0–∞ based on adult data; solid line, LOESS smooth line. (b) IGF1 AUC0–∞ after body weight‐ and BSA‐based dosing in typical pediatric subjects with different body weight and BSA. Solid line, body weight‐based dosing; dashed line, BSA‐based dosing. (c) Percent of simulated subjects with IFG1 drug exposures below the targeted AUC0‐∞ after body‐weight and BSA‐based dosing. Solid circle, body weight‐based dosing; open circle, BSA‐based dosing. Number of simulated subjects = 10 000.
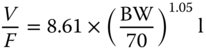
It is interesting to note that in the commonly used Du Bois formula for the BSA calculation, the BSA is related to the body weight with power of 0.425. Therefore, it is possible that the CL scaled based on BSA might obtain the value of θ closer to 1. A further analysis indicated that BSA was indeed a better body size measurement than BW in influencing CL of IGF1 based on standard model selection criteria and the relationships between BSA and clearance was expressed as follows:
The θ of the BSA on CL was 1.06, which was much closer to 1.00 compared to the θ of 0.708 for BW on CL. The simulation results using the developed population PK model showed that the BSA‐based dosing approach was able to maintain drug exposure above the targeted AUC0–∞ in IGF1‐treated pediatric subjects much better than the BW‐based dosing (Figures 13.3 b, c).
13.4 Using mPBPK Model to Study the Effects of FcRn Developmental Pharmacology on the PK of mAbs in Pediatric Subjects
The allometric scaling method has been used in many studies to select optimal pediatric dose regimens of mAbs in pediatric subjects as shown in Table 13.3 . However, one major limitation of combining the scaling factor method with classical compartmental PK model is the lack of biological sense in the analyses and many biological mechanisms of the mAbs disposition are neglected. This biological information can be beneficial to increase our understanding of complex interactions between many physiological factors and the PK parameters, and improve the prediction of mAb disposition in human subjects.
Physiologically based pharmacokinetic (PBPK) modeling has been proven as a powerful method to analyze the disposition of small molecule drugs [55] and mAbs [56,57]. Recently, this modeling approach has gained a lot of intention as a promising method in the drug development process [58,59]. PBPK modeling is more mechanistic and realistic compared to classic compartmental modeling as the anatomical and physiological properties of the subject are incorporated in the model [60,61]. This modeling approach is more comprehensive than empirical methods as they are integrating both drug specific parameters such as FcRn‐binding affinity and system‐specific parameters such as FcRn receptor concentration and blood flow to describe the PK of mAbs [ 59 ,62,63]. Hence, PBPK modeling provides an opportunity to examine the effects of physiological parameters and maturation process on the disposition of mAbs in pediatric subjects. Thus, full PBPK models have been increasingly used to explain the PK of mAbs in preclinical and clinical models [ 34 ,35, 57 63 –65]. It is well recognized that the full PBPK models can describe the disposition of IgGs using physiological characteristics. However, the complexity of the full PBPK model with limited tissue mAb and FcRn concentration data may lead to many unwarranted assumptions that are used to describe the disposition of the antibodies in human. To overcome this limitation, the minimum PBPK (mPBPK) model has been proposed for the PK analysis especially in human when only plasma PK data is available from most clinical studies [ 56 66–68]. However, none of these full or minimum PBPK models have been used to investigate the PK of mAbs in pediatric subjects.
The neonatal FcRn is a major histocompatibility complex (MHC) class I‐like heterodimer protein complex that is widely expressed in endothelial cells and organs such as muscle, kidney, and placenta [ 40 ,69]. The FcRn plays an important role in IgG homeostasis by mediating a pH‐dependent endocytic salvage pathway that prevents IgG degradation, and thus contributes to the prolonged circulating half‐life of IgGs relative to other plasma proteins (except albumin) [70]. The PK of IgG antibodies is affected by modulating the FcRn‐binding affinity at acidic and physiological pH. Correlations between the FcRn‐binding affinity of IgGs and their clearance and terminal half‐life have been reported in preclinical and clinical studies [71–74]. However, unlike the well documented of the age‐dependent CYP‐450‐mediated metabolism for the small molecules [27] , developmental maturity of the FcRn expression and its effects on the IgG catabolism in pediatric subjects is largely unknown and never been reported. Therefore, in the following section of this chapter, we described how to use mPBPK model to investigate the effects of FcRn developmental pharmacology on the PK of mAbs in pediatric subjects.
The two‐pore minimal PBPK model developed by our group was used in this analysis [68] . In brief, the model contains three major distribution sites: plasma, tissue, and lymph node (Figure 13.4). All tissues are merged into one system that consists of vascular space, endothelial space, and interstitial space. The IgG enters the tissue vascular space from the plasma by the arterial blood flow (Q) and exits the tissue vascular space to the plasma by venous blood flow (Q–L). In the tissue vascular space, IgG distributes to the interstitial space by convective transport, which corresponds to the lymph flow (L) and vascular reflection coefficient (σv), and passive diffusion modeled by the two‐pore theory (KTP). The IgG moves from both vascular space and interstitial space to the unbound IgG compartment in the endothelial space by endocytosis rate (Kup). In the endothelial space, IgG may interact and bind to the FcRn receptor and move from unbound compartment to the bound compartment by the association rate (Kon). The binding IgG to the FcRn chain receptor may break and then the unbound IgG move from bound compartment to the unbound compartment by the dissociation rate (Koff). The IgG is cleared from the tissue in the unbound compartment of endothelial space (CL). Exocytosis may recycle back the IgG from bound compartment in the endothelial space to the vascular space (fraction of FR, and rate of Krc) and interstitial space (fraction of [1–FR] and rate of Krc). In the interstitial space, IgG moves to the lymph node by lymph flow L. The model consists of two physiologically equal systems, i.e. endogenous and exogenous native IgG/mAbs. The two physiological systems are connected by the competition for the same FcRn receptor.
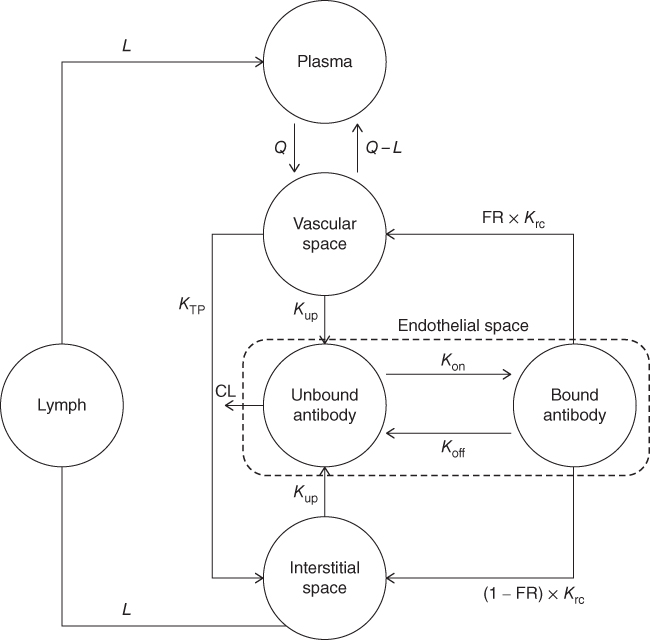
Figure 13.4 The two‐pore mPBPK model for TmAbs. The antibodies are administered into the plasma compartment and distributed to the tissue vascular space by the blood flow. Endocytosis, exocytosis, and FcRn recycling mechanism were implemented. The antibodies are cleared via endothelial space. The model consists of two equal systems, i.e. endogenous IgG and exogenous native IgG/TmAbs, which are connected by the competition to the same FcRn receptor.
The PK data from endogenous/exogenous native IgG and palivizumab were used in the analysis. To our best knowledge, Robbie et al. conducted one of the most comprehensive population PK analyses to study the disposition of mAbs (palivizumab) in 1883 adult/pediatric subjects from 22 clinical studies [17]. Therefore, plasma concentration–time profiles of palivizumab for adults and pediatric subjects with different weight were simulated using a two‐compartment linear PK model with the covariate–parameter relationships proposed by Robbie et al. [17] . In adult subjects, body weights of 50, 60, 70, 80, 90, and 100 kg were used for simulation and fitting. For the pediatric subjects, seven age groups were used, i.e. 1, 2, 3, 4, 6, 10, and 15 years. In each age group, the weight of 5%, 25%, 50%, 75%, and 95% percentile corresponding to age group from the complement‐dependent cytotoxicity (CDC) standard growth chart were used [75]. Ten steady‐state baseline endogenous IgG concentrations were simulated using the reported reference values in adult [76] and pediatric [77] subjects before administrations of single IV bolus dose of 10 mg kg−1 of exogenous IgG or palivizumab (mAb) in order to assess the interaction between the endogenous IgG and exogenous native IgG/palivizumab.
Many age‐/weight‐specific mPBPK model parameters for mAbs in human subjects were not readily available and had to be compiled and derived from diverse sources with different quality. Therefore, in this study, we developed the first evidence‐based rating system to evaluate the quality of the data that used to scale the mPBPK parameters from adult subjects to pediatric subjects for the IgG‐based antibody. This evidence‐based rating system provided a transparent platform and mechanism to allow us to systematically examine and refine the mPBPK model parameters in the case that the mPBPK model is deficient for PK prediction. The data were divided into four different levels of evidence (LOE) based on the methodological quality of the parameters collection (Table 13.4). In brief, the first level (LOE I) represented the highest rank of scientific evidence and mainly consisted of experimental data from human subjects. This level represented a high level of comfort that the data were highly relevant and reliable to be used for scaling of the mPBPK parameters in human subjects. The LOE II data contained data from both human adult subjects and animal species that used to derive the mPBPK model parameters in pediatric subjects with allometric scaling method. In the absence of both LOE I and II data, then the established approaches for PBPK model development in the published literatures were used to scale the data from either human or animal species to LOE III model parameters in pediatric subjects. The assumptions that used to derive LOE IV data were least reliable because no established scaling approach was published in the previous PBPK studies. Thus, the LOE IV parameters in pediatric subjects were assumed to be the same with adult subjects or animal species. In the presence of mPBPK model deficiency in PK prediction, this evidence‐based ranking system allowed us to systematically examine and refine the model parameters to improve the model prediction. As the parameters in the LOE IV parameters were least reliable among the mPBPK model parameters, therefore, these parameters were first to be examined and refined for improving the model prediction. If the model deficiency persisted after the calibration of the LOE IV parameters, the parameters in LOE III and then followed by LOE II and I with increasing quality were then examined and refined in sequential order to optimize model prediction.
Table 13.4 List of mPBPK model parameters based on the level of evidence (LOE).
| LOE | Source data | Scaling method to derive the mPBPK model parameters in pediatric subject from source data | Parameters |
| I | Data from both adult and pediatric human subjects | Allometric function | Vascular volume Vv, interstitial volume Vi, blood flow Q, and plasma volume Vp |
| II | Data in adult human and animal subjects | Allometric function | Lymph volume VL and endothelial volume Ve |
| III | Data in adult human or animal subjects |
|
Lymph flow L, permeability surface area of IgG to the large/small pores PSSL/S, fluid recirculation rate Jiso |
|
Osmotic reflection coefficient of IgG to large/small pores σL/s, fraction of hydraulic conductivity for large/small pores αL/s, fraction of recycling IgG FR, affinity profiles (KD/koff), and lysosomal average time of ingested protein tau | ||
| IV | Data in adult human subjects or animal species | The model parameters in adult subject or animal species are assumed to be the same with pediatric subject | IgG endothelial recycle rate Krc and IgG endothelial uptake rate Kup |
The final mPBPK model was developed using a stepwise approach. First, the model was calibrated using the PK data of endogenous and exogenous native IgG and palivizumab in 77 kg adult subjects as described in our previous study [68] . The model was validated to the published experimental data to determine if the implementation of KD is sufficient to explain the PK of native IgG and palivizumab. The following criteria were used to validate the mPBPK model in adult subject: a mean half‐life of ∼21 days of native IgG [ 56 , 76 ] and palivizumab [17] in adult subjects, a ratio of 0.058 between mAbs concentration in tissue and plasma [57] and a concentration of endogenous IgG in the interstitial space ≥17% of that in plasma [ 56 ,78]. The mPBPK model that passed these validation criteria was used to develop the final mPBPK model for mAbs in both adult and pediatric subjects. The age/weight‐specified mPBPK model parameters listed in Table 13.5 were used for the study in adult and pediatric subjects. Endogenous IgG synthesis rate Ksyn and concentration of FcRn receptor were fitted simultaneously to endogenous IgG and simulated PK data of palivizumab for different ages and weights.
Table 13.5 List of mPBPK model parameters and the allometric setting used for simulation in adult and pediatric subjects.
| Level of evidence (LOE) | Parameters | Allometric function/value | Source |
| I | Vascular volume Vv (l) | 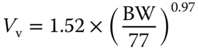 |
[79,80] |
| Interstitial volume Vi (l) | 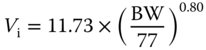 |
[ 79 , 80 ] | |
| Blood flow Q (l h−1) |  |
[ 79 , 80 ] | |
| Plasma volume Vp (l) | 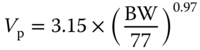 |
[ 79 , 80 ] | |
| II | Endothelial volume Ve (l) |  |
[ 63 , 80 ] |
| Lymph volume VL (l) |  |
[57] | |
| III A | Lymph flow L (l) | 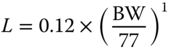 |
[ 34 ,81] |
| Permeability surface area of IgG to the large pore PSL (l h−1) |  |
[ 34 ,82] | |
| Permeability surface area of IgG to the small pore PSS (l h−1) | 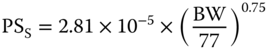 |
[ 34 , 82 ] | |
| Fluid recirculation rate Jiso (l h−1) | 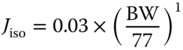 |
[68] | |
| III B | Osmotic reflection coefficient of native IgG to the large pore σL (unitless) |
0.1 σL_Pali = σL × 1.1 |
[ 34
,83] [68] |
| Osmotic reflection coefficient of native IgG to the small pore σS (unitless) |
0.74 σS_Pali = σS × 1.1 |
[ 34
, 83
] [68] |
|
| Fraction of hydraulic conductivity for large pore αL (unitless) |
0.042 αL = 1 − αS |
[35] | |
Affinity parameters:
|
0.737 0.750 36 |
[84] [85] [84] |
|
| Fraction of recycling IgG FR (unitless) | 0.715 | [63] | |
| Endothelial clearance CL (l h−1)b | 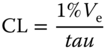 |
[ 56 ,86] | |
| Lysosomal average time of ingested proteins tau (h) | 0.19 | [87] | |
| IV | Endothelial uptake rate of native IgG Kup (1 h−1) |
0.0298 Kup_Pali = Kup × 0.42 |
[88] [68] |
| Endothelial recycle rate of native IgG Krc (1 h−1) |
0.53 Krc_Pali = Krc × 0.42 |
[68]
[68] |
|
| Estimated parameters | FcRn total concentration (μM) | 40 (Ref. adult) | [35] |
| IgG synthesis rate Ksyn per kg (mg (d−1 kg)−1) | 34 (Ref. adult) | [ 76 ,89] |
aThe sensitivity analysis in our preliminary study showed that this parameter slightly affected the simulated plasma kinetics (AUC difference <5%). Thus, the same value of koff was used for both native IgG and palivizumab.
bClearance represents the intrinsic catabolic clearance rate of the antibodies by lysosome in endothelial cells.
The final mPBPK model was able to describe the concentration–time profiles of the endogenous/exogenous native IgG and palivizumab in both adult and pediatric subjects with different ages and weights (Figure 13.5). This result suggested that the FcRn‐binding affinity together with the LOE I–IV parameters used in the mPBPK model were sufficient to explain the PK differences between native IgG and palivizumab in adult and pediatric subjects. The parameters of the final mPBPK model were listed in Table 13.5 , and all coefficient of variations (CVs) of the estimated parameters were <50%. The simulations of mPBPK model in 77 kg adult subjects have passed all validation criteria outlined in this report. The calculated elimination half‐life from both native IgG and palivizumab in 77 kg adult was 23 and 22 days, respectively, which is consistent with the reported values of ∼21 days for these antibodies [ 17 , 76 ]. The ratio of mAb concentrations in tissue and plasma system was 0.062 and the concentration of endogenous IgG in the interstitial space was 20% of that in the plasma, consistent with the reported values from the experimental data [ 56 , 78 ]. The final mPBPK model allowed us to identify the relationships of weight‐ and age‐specific FcRn concentration and PK of palivizumab in human subjects.

Figure 13.5 Observed vs. mPBPK prediction of palivizumab and endogenous/exogenous IgG in both adult and pediatric subjects.
Figure 13.6a showed an age effect on the FcRn concentration, where the weight normalized FcRn concentration was inversely proportional to the age. This result was in agreement with the finding from the rat FcRn mRNA expression study that showed that the weight‐normalized duodenal FcRn mRNA expression level was at maximum between 1 and 19 days of age and decreased afterward [90]. To the best of our knowledge, this is the first report to suggest age‐related FcRn changes in human subjects. A higher FcRn concentration is needed to lower the IgG catabolism by preventing more IgG antibody from endosomal degradation. Therefore, in pediatric subjects with a lower body weight, the age‐related weight‐normalized FcRn concentration has to be higher than that in adult subjects in order to achieve sufficiently high FcRn concentration for the observed lower clearance of palivizumab in pediatric subjects (Figure 13.6 b). There is no available data about the measured Ksyn for endogenous IgG in pediatric subjects. Endogenous IgG level has been shown to have a linear correlation with age in normal healthy subjects [77] . The developed mPBPK model in this study allowed us to uniquely identify the weight‐ and age‐related changes in the elimination of endogenous IgG so we could quantify Ksyn from a given endogenous IgG level across different age groups. The estimated weight‐normalized Ksyn_BW in adults (32–37 mg (kg d−1)−1 obtained in our study is in the range of the reported value by Waldmann and Terry [89] , i.e. 34 ± 11 mg (kg d−1)−1. Our results showed that weight‐normalized Ksyn_BW decreased with increasing weight within each age group in pediatric subjects (Figure 13.6 c), suggesting that the lower clearance and Ksyn both contribute to the observed lower endogenous IgG in younger children.
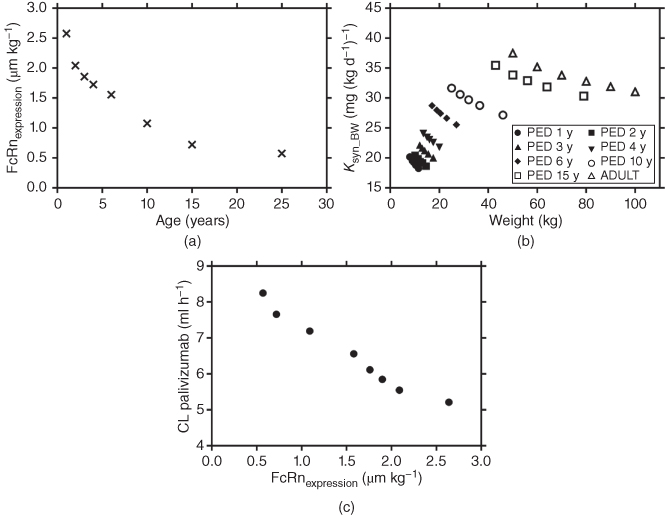
Figure 13.6 (a) Weight normalized FcRn (FcRnexpression) vs. age, (b) CL vs. body weight normalized FcRn (FcRnexpression), and (c) weight normalized Ksyn (Ksyn_BW) vs. body weight.
In summary, the mPBPK model was successfully developed for describing the PK of mAbs and endogenous IgG in pediatric population. This developed mPBPK model has provided important physiological insights into FcRn developmental pharmacology and its effects on the disposition of IgG antibody in human subjects.
References
- 1 Reichert, J.M. (2012). Marketed therapeutic antibodies compendium. mAbs 4: 413–415.
- 2 Edlund, H., Melin, J., Parra‐Guillen, Z.P., and Kloft, C. (2015). Pharmacokinetics and pharmacokinetic–pharmacodynamic relationships of monoclonal antibodies in children. Clin. Pharmacokinet. 54: 35–80.
- 3 Wang, W., Wang, E.Q., and Balthasar, J.P. (2008). Monoclonal antibody pharmacokinetics and pharmacodynamics. Clin. Pharmacol. Ther. 84: 548–558.
- 4 GenEngBio (2018). The Top 15 Best‐Selling Drugs of 2017. https://www.genengnews.com/the‐lists/the‐top‐15‐best‐selling‐drugs‐of‐2017/77901068.
- 5 Igeahub (2017). Top 20 Drugs in the World 2017. https://igeahub.com/2017/08/08/top‐20‐drugs‐in‐the‐world‐2017/ (accessed 03 October 2018).
- 6 Kalorama (2018). Global Monoclonal Antibodies Market Hit $100 Billion in 2017. https://www.kaloramainformation.com/about/release.asp?id=4307 (accessed 03 October 2018).
- 7 Prnewswire (2018). Global Monoclonal Antibodies Market Hit $100 Billion in 2017: Report. https://www.prnewswire.com/news‐releases/global‐monoclonal‐antibodies‐market‐hit‐100‐billion‐in‐2017‐report‐300599684.html (accessed 03 Ocotober 2018).
- 8 Ecker, D.M., Jones, S.D., and Levine, H.L. (2015). The therapeutic monoclonal antibody market. mAbs 7: 9–14.
- 9 EMA PC (2017). Package Insert Qarziba/Dinutuximab. http://www.ema.europa.eu/ema/index.jsp?curl=pages/medicines/human/medicines/003918/human_med_002104.jsp&mid=wc0b01ac058001d124 (accessed 03 October 2018).
- 10 EMA PC (2018). Package Insert Burosomab. http://www.ema.europa.eu/docs/en_GB/document_library/EPAR_‐_Product_Information/human/004275/WC500245537.pdf (accessed 03 October 2018).
- 11 FDA. Drugs@FDA. http://www.accessdata.fda.gov/scripts/cder/drugsatfda/index.cfm?CFID=27729622&CFTOKEN=dde04172480c4c9e‐D1772092‐D394‐B5A6‐256F39805045CED6#labelinfo (accessed 03 October 2018).
- 12 FDA (2015). Package Insert Dinutuximab. https://www.accessdata.fda.gov/drugsatfda_docs/label/2015/125516s000lbl.pdf (accessed 03 October 2018).
- 13 FDA (2017). Package Insert Emicizumab. https://www.accessdata.fda.gov/drugsatfda_docs/label/2017/761083s000lbl.pdf (accessed 03 October 2018).
- 14 FDA (2017). Package Insert Evolocumab. https://www.accessdata.fda.gov/drugsatfda_docs/label/2015/125522s000lbl.pdf (accessed 03 October 2018).
- 15 FDA (2015). Package Insert Mepolizumab. https://www.accessdata.fda.gov/drugsatfda_docs/label/2015/125526Orig1s000Lbl.pdf (accessed 03 October 2018).
- 16 Boeckh, M., Berrey, M.M., Bowden, R.A. et al. (2001). Phase 1 evaluation of the respiratory syncytial virus‐specific monoclonal antibody palivizumab in recipients of hematopoietic stem cell transplants. J. Infect. Dis. 184: 350–354.
- 17 Robbie, G.J., Zhao, L., Mondick, J. et al. (2012). Population pharmacokinetics of palivizumab, a humanized anti‐respiratory syncytial virus monoclonal antibody, in adults and children. Antimicrob. Agents Chemother. 56: 4927–4936.
- 18 Speer, M.E., Fernandes, C.J., Boron, M., and Groothuis, J.R. (2008). Use of Palivizumab for prevention of hospitalization as a result of respiratory syncytial virus in infants with cystic fibrosis. Pediatr. Infect. Dis. J. 27: 559–561.
- 19 Pescovitz, M.D., Knechtle, S., Alexander, S.R. et al. (2008). Safety and pharmacokinetics of daclizumab in pediatric renal transplant recipients. Pediatr. Transplant. 12: 447–455.
- 20 Olski, T.M., Lampus, S.F., Gherarducci, G., and Saint Raymond, A. (2011). Three years of paediatric regulation in the European Union. Eur. J. Clin. Pharmacol. 67: 245–252.
- 21 Xu, Z., Davis, H.M., and Zhou, H. (2013). Rational development and utilization of antibody‐based therapeutic proteins in pediatrics. Pharmacol. Ther. 137: 225–247.
- 22 FDA (2002). How to Comply with the Pediatric Research Equity Act. https://www.fda.gov/downloads/Drugs/DevelopmentApprovalProcess/DevelopmentResources/UCM077855.pdf (accessed 03 October 2018).
- 23 EMA PC (2006). Paediatric Regulation. http://www.ema.europa.eu/ema/index.jsp?curl=pages/regulation/document_listing/document_listing_000068.jsp (accessed 03 October 2018).
- 24 EMA PC (2012). Opinions and Decisions on Paediatric Investigation Plans. http://www.ema.europa.eu/ema/index.jsp?curl=pages/medicines/landing/pip_search.jsp&mid=WC0b01ac058001d129 (accessed 03 October 2018).
- 25 FDA (2018). Reviews of Pediatric Studies Conducted under BPCA and PREA from 2012–present. https://www.fda.gov/Drugs/DevelopmentApprovalProcess/DevelopmentResources/ucm316937.htm (accessed 03 October 2018).
- 26 Abernethy, D.R. and Burckart, G.J. (2010). Pediatric dose selection. Clin. Pharmacol. Ther. 87: 270–271.
- 27 Kearns, G.L., Abdel‐Rahman, S.M., Alander, S.W. et al. (2003). Developmental pharmacology – drug disposition, action, and therapy in infants and children. N. Engl. J. Med. 349: 1157–1167.
- 28 Richter, W.F. and Jacobsen, B. (2014). Subcutaneous absorption of biotherapeutics: knowns and unknowns. Drug Metab. Dispos. 42: 1881–1889.
- 29 Richter, W.F., Bhansali, S.G., and Morris, M.E. (2012). Mechanistic determinants of biotherapeutics absorption following SC administration. AAPS J. 14: 559–570.
- 30 Lobo, E.D., Hansen, R.J., and Balthasar, J.P. (2004). Antibody pharmacokinetics and pharmacodynamics. J. Pharm. Sci. 93: 2645–2668.
- 31 Kagan, L. and Mager, D.E. (2013). Mechanisms of subcutaneous absorption of rituximab in rats. Drug Metab. Dispos. 41: 248–255.
- 32 Frazer, J.K. and Capra, J.D. (1999). Immunoglobulins: structure and function. In: Fundamental Immunology, 4e (ed. W.E. Paul), 37–74. Philadelphia, PA: Lippincot‐Raven.
- 33 Liu, J.K. (2014). The history of monoclonal antibody development – progress, remaining challenges and future innovations. Ann. Med. Surg. (Lond) 3: 113–116.
- 34 Davda, J.P., Jain, M., Batra, S.K. et al. (2008). A physiologically based pharmacokinetic (PBPK) model to characterize and predict the disposition of monoclonal antibody CC49 and its single chain Fv constructs. Int. Immunopharmacol. 8: 401–413.
- 35 Ferl, G.Z., Wu, A.M., and DiStefano, J.J. III (2005). A predictive model of therapeutic monoclonal antibody dynamics and regulation by the neonatal Fc receptor (FcRn). Ann. Biomed. Eng. 33: 1640–1652.
- 36 Rippe, B. and Haraldsson, B. (1994). Transport of macromolecules across microvascular walls: the two‐pore theory. Physiol. Rev. 74: 163–219.
- 37 Tabrizi, M., Bornstein, G.G., and Suria, H. (2010). Biodistribution mechanisms of therapeutic monoclonal antibodies in health and disease. AAPS J. 12: 33–43.
- 38 Darrow, D.C., Soule, H.C., and Buckman, T.E. (1928). Blood volume in normal infants and children. J. Clin. Invest. 5: 243–258.
- 39 Tabrizi, M.A., Tseng, C.M., and Roskos, L.K. (2006). Elimination mechanisms of therapeutic monoclonal antibodies. Drug Discov. Today 11: 81–88.
- 40 Roopenian, D.C. and Akilesh, S. (2007). FcRn: the neonatal Fc receptor comes of age. Nat. Rev. Immunol. 7: 715–725.
- 41 Leabman, M.K., Meng, Y.G., Kelley, R.F. et al. (2013). Effects of altered FcgammaR binding on antibody pharmacokinetics in cynomolgus monkeys. mAbs 5: 896–903.
- 42 Zhang, Y., Wei, X., Bajaj, G. et al. (2015). Challenges and considerations for development of therapeutic proteins in pediatric patients. J. Clin. Pharmacol. 55 (Suppl. 3): S103–S115.
- 43 Sharma, S., Eckert, D., Hyams, J.S. et al. (2015). Pharmacokinetics and exposure–efficacy relationship of adalimumab in pediatric patients with moderate to severe Crohn's disease: results from a randomized, multicenter, phase‐3 study. Inflamm. Bowel Dis. 21: 783–792.
- 44 Kovarik, J.M., Gridelli, B.G., Martin, S. et al. (2002). Basiliximab in pediatric liver transplantation: a pharmacokinetic‐derived dosing algorithm. Pediatr. Transplant. 6: 224–230.
- 45 Kovarik, J.M., Kahan, B.D., Rajagopalan, P.R. et al. (1999). Population pharmacokinetics and exposure‐response relationships for basiliximab in kidney transplantation. The U.S. Simulect Renal Transplant Study Group. Transplantation 68: 1288–1294.
- 46 Kovarik, J.M., Offner, G., Broyer, M. et al. (2002). A rational dosing algorithm for basiliximab (Simulect) in pediatric renal transplantation based on pharmacokinetic‐dynamic evaluations. Transplantation 74: 966–971.
- 47 Han, K., Peyret, T., Quartino, A. et al. (2016). Bevacizumab dosing strategy in paediatric cancer patients based on population pharmacokinetic analysis with external validation. Br. J. Clin. Pharmacol. 81: 148–160.
- 48 Fasanmade, A.A., Adedokun, O.J., Blank, M. et al. (2011). Pharmacokinetic properties of infliximab in children and adults with Crohn's disease: a retrospective analysis of data from 2 phase III clinical trials. Clin. Ther. 33: 946–964.
- 49 Lowe, P.J. and Renard, D. (2011). Omalizumab decreases IgE production in patients with allergic (IgE‐mediated) asthma; PKPD analysis of a biomarker, total IgE. Br. J. Clin. Pharmacol. 72: 306–320.
- 50 Mould, D.R. and Green, B. (2010). Pharmacokinetics and pharmacodynamics of monoclonal antibodies: concepts and lessons for drug development. BioDrugs 24: 23–39.
- 51 Shi, R. and Derendorf, H. (2010). Pediatric dosing and body size in biotherapeutics. Pharmaceutics 2: 389–418.
- 52 Wang, D.D., Zhang, S., Zhao, H. et al. (2009). Fixed dosing versus body size‐based dosing of monoclonal antibodies in adult clinical trials. J. Clin. Pharmacol. 49: 1012–1024.
- 53 Ng, C.M., Lum, B.L., Gimenez, V. et al. (2006). Rationale for fixed dosing of pertuzumab in cancer patients based on population pharmacokinetic analysis. Pharm. Res. 23: 1275–1284.
- 54 Ng, C.M., Bruno, R., Combs, D., and Davies, B. (2005). Population pharmacokinetics of rituximab (anti‐CD20 monoclonal antibody) in rheumatoid arthritis patients during a phase II clinical trial. J. Clin. Pharmacol. 45: 792–801.
- 55 Zhuang, X. and Lu, C. (2016). PBPK modeling and simulation in drug research and development. Acta Pharmacol. Sin. 6: 430–440.
- 56 Li, L., Gardner, I., Dostalek, M., and Jamei, M. (2014). Simulation of monoclonal antibody pharmacokinetics in humans using a minimal physiologically based model. AAPS J. 16: 1097–1109.
- 57 Shah, D.K. and Betts, A.M. (2012). Towards a platform PBPK model to characterize the plasma and tissue disposition of monoclonal antibodies in preclinical species and human. J. Pharmacokinet. Pharmacodyn. 39: 67–86.
- 58 Poulin, P., Jones, R.D., Jones, H.M. et al. (2011). PHRMA CPCDC initiative on predictive models of human pharmacokinetics, part 5: prediction of plasma concentration‐time profiles in human by using the physiologically‐based pharmacokinetic modeling approach. J. Pharm. Sci. 100: 4127–4157.
- 59 Rowland, M., Peck, C., and Tucker, G. (2011). Physiologically‐based pharmacokinetics in drug development and regulatory science. Annu. Rev. Pharmacol. Toxicol. 51: 45–73.
- 60 Grime, K.H., Bird, J., Ferguson, D., and Riley, R.J. (2009). Mechanism‐based inhibition of cytochrome P450 enzymes: an evaluation of early decision making in vitro approaches and drug–drug interaction prediction methods. Eur. J. Pharm. Sci. 36: 175–191.
- 61 Thygesen, P., Macheras, P., and Van Peer, A. (2009). Physiologically‐based PK/PD modelling of therapeutic macromolecules. Pharm. Res. 26: 2543–2550.
- 62 Aarons, L. (2005). Physiologically based pharmacokinetic modelling: a sound mechanistic basis is needed. Br. J. Clin. Pharmacol. 60: 581–583.
- 63 Garg, A. and Balthasar, J.P. (2007). Physiologically‐based pharmacokinetic (PBPK) model to predict IgG tissue kinetics in wild‐type and FcRn‐knockout mice. J. Pharmacokinet. Pharmacodyn. 34: 687–709.
- 64 Chen, Y. and Balthasar, J.P. (2012). Evaluation of a catenary PBPK model for predicting the in vivo disposition of mAbs engineered for high‐affinity binding to FcRn. AAPS J. 14: 850–859.
- 65 Chetty, M., Li, L., Rose, R. et al. (2014). Prediction of the pharmacokinetics, pharmacodynamics, and efficacy of a monoclonal antibody, using a physiologically based pharmacokinetic FcRn model. Front. Immunol. 5: 670.
- 66 Cao, Y., Balthasar, J.P., and Jusko, W.J. (2013). Second‐generation minimal physiologically‐based pharmacokinetic model for monoclonal antibodies. J. Pharmacokinet. Pharmacodyn. 40: 597–607.
- 67 Cao, Y. and Jusko, W.J. (2012). Applications of minimal physiologically‐based pharmacokinetic models. J. Pharmacokinet. Pharmacodyn. 39: 711–723.
- 68 Hardiansyah, D. and Ng, C.M. (2018). Two‐pore minimum physiologically‐based pharmacokinetic model to describe the disposition of therapeutic monoclonal IgG antibody in humans. Pharm. Res. 35: 47.
- 69 Burmeister, W.P., Huber, A.H., and Bjorkman, P.J. (1994). Crystal structure of the complex of rat neonatal Fc receptor with Fc. Nature 372: 379–383.
- 70 Raghavan, M., Bonagura, V.R., Morrison, S.L., and Bjorkman, P.J. (1995). Analysis of the pH dependence of the neonatal Fc receptor/immunoglobulin G interaction using antibody and receptor variants. Biochemistry 34: 14649–14657.
- 71 Borrok, M.J., Wu, Y., Beyaz, N. et al. (2015). pH‐dependent binding engineering reveals an FcRn affinity threshold that governs IgG recycling. J. Biol. Chem. 290: 4282–4290.
- 72 Hinton, P.R., Johlfs, M.G., Xiong, J.M. et al. (2004). Engineered human IgG antibodies with longer serum half‐lives in primates. J. Biol. Chem. 279: 6213–6216.
- 73 Hinton, P.R., Xiong, J.M., Johlfs, M.G. et al. (2006). An engineered human IgG1 antibody with longer serum half‐life. J. Immunol. 176: 346–356.
- 74 Robbie, G.J., Criste, R., Dall'acqua, W.F. et al. (2013). A novel investigational Fc‐modified humanized monoclonal antibody, motavizumab‐YTE, has an extended half‐life in healthy adults. Antimicrob. Agents Chemother. 57: 6147–6153.
- 75 CDC (2010). Growth charts@cdc. https://www.cdc.gov/growthcharts/ (accessed 03 October 2018).
- 76 Waldmann, T.A. and Strober, W. (1969). Metabolism of immunoglobulins. Prog. Allergy 13: 1–110.
- 77 Jolliff, C.R., Cost, K.M., Stivrins, P.C. et al. (1982). Reference intervals for serum IgG, IgA, IgM, C3, and C4 as determined by rate nephelometry. Clin. Chem. 28: 126–128.
- 78 Granger, D.N. and Taylor, A.E. (1980). Permeability of intestinal capillaries to endogenous macromolecules. Am. J. Physiol. 238: H457–H464.
- 79 (ICRP) ICoRP (2002). Basic Anatomical and Physiological Data for Use in Radiological Protection: Reference Values, ICRP Publication 89, vol. 89. Amsterdam: Elsevier Science.
- 80 Bjorkman, S. (2005). Prediction of drug disposition in infants and children by means of physiologically based pharmacokinetic (PBPK) modelling: theophylline and midazolam as model drugs. Br. J. Clin. Pharmacol. 59: 691–704.
- 81 Guyton, A.C. (2006). Textbook of Medical Physiology, 11e. Elsevier.
- 82 Rippe, B. and Haraldsson, B. (1987). Fluid and protein fluxes across small and large pores in the microvasculature. Application of two‐pore equations. Acta Physiol. Scand. 131: 411–428.
- 83 Taylor, A.E. and Granger, D.N. (1984). Exchange of Macromolucules Across the Microcirculation. Bethesda, MD: American Physiology Society.
- 84 Abdiche, Y.N., Yeung, Y.A., Chaparro‐Riggers, J. et al. (2015). The neonatal Fc receptor (FcRn) binds independently to both sites of the IgG homodimer with identical affinity. mAbs 7: 331–343.
- 85 Suzuki, T., Ishii‐Watabe, A., Tada, M. et al. (2010). Importance of neonatal FcR in regulating the serum half‐life of therapeutic proteins containing the Fc domain of human IgG1: a comparative study of the affinity of monoclonal antibodies and Fc‐fusion proteins to human neonatal FcR. J. Immunol. 184: 1968–1976.
- 86 Logan, R., Kong, A., and Krise, J.P. (2013). Evaluating the roles of autophagy and lysosomal trafficking defects in intracellular distribution‐based drug‐drug interactions involving lysosomes. J. Pharm. Sci. 102: 4173–4180.
- 87 Stehle, G., Sinn, H., Wunder, A. et al. (1997). Plasma protein (albumin) catabolism by the tumor itself‐‐implications for tumor metabolism and the genesis of cachexia. Crit. Rev. Oncol. Hematol. 26: 77–100.
- 88 Haigler, H.T., McKanna, J.A., and Cohen, S. (1979). Rapid stimulation of pinocytosis in human carcinoma cells A‐431 by epidermal growth factor. J. Cell. Biol. 83: 82–90.
- 89 Waldmann, T.A. and Terry, W.D. (1990). Familial hypercatabolic hypoproteinemia. A disorder of endogenous catabolism of albumin and immunoglobulin. J. Clin. Invest. 86: 2093–2098.
- 90 Martin, M.G., Wu, S.V., and Walsh, J.H. (1997). Ontogenetic development and distribution of antibody transport and Fc receptor mRNA expression in rat intestine. Dig. Dis. Sci. 42: 1062–1069.