11
Pharmacokinetics‐Based Dosing for Therapeutic Monoclonal Antibodies in Inflammatory Bowel Disease
Niels Vande Casteele and William J. Sandborn
University of California San Diego, Inflammatory Bowel Disease Center, Division of Gastroenterology, Department of Medicine, La Jolla, CA, 92093, United States
11.1 Inflammatory Bowel Disease
Crohn's disease (CD) and ulcerative colitis (UC) are two forms of inflammatory bowel diseases (IBD) that are characterized by flares and remission phases [1,2]. Uncontrolled intestinal inflammation leads to disease progression and subsequent disability (e.g. stricture formation in Crohn's disease or colectomy in ulcerative colitis) [3]. Treatment regimens typically consist of two phases: first, to induce and second, to maintain remission over a prolonged period of time. Control of active inflammation is paramount to avoid long‐term bowel damage and therefore, an approach of “treat‐to‐target” is applied to treat patients with IBD [4]. Patients can be stratified according to the risk of disease progression and disease severity, after which an individual treatment target is chosen accordingly. The target is based on assessing disease activity on a regular basis by using (a combination of) objective clinical, biologic, endoscopic, or histologic outcome measures. For example, in the short term, treatment targets may be different between individual patients depending on disease severity and history. A therapy is then chosen according to the risk of disease progression and treatment target. After a predefined timeframe, the target is reassessed and changes to the treatment are made if the target is not met, or treatment and target surveillance is continued when the target is met.
For patients with moderate‐to‐severe Crohn's disease or ulcerative colitis, an important class of drugs are the biologics. There are four tumor necrosis factor (TNF) antagonists available to treat patients with IBD: infliximab, adalimumab, certolizumab pegol, and golimumab. More recently, two other classes of biologics were introduced; the integrin antagonists, including natalizumab (targeting the α4 subunit) and vedolizumab (targeting the α4β7 heterodimer) and the interleukin (IL) antagonists, including ustekinumab (targeting the p40 subunit of IL‐12/23). Although their mechanism of action is distinct, what these molecules have in common is that considerable inter‐ and intra‐individual variability in pharmacokinetics (PKs) and pharmacodynamics (PDs) is observed for treating patients with IBD [5].
11.2 Population Pharmacokinetics
Population pharmacokinetic (PopPK) models describing the concentration–time data of infliximab, certolizumab pegol, and vedolizumab have been described in the literature. Using a nonlinear mixed effects modeling approach, these models characterize, within the population, the basic “structural” PK parameters such as the absorption rate constant, volume of distribution, and clearance, as well as the between‐subject variability (BSV)and between‐occasion variability (BOV) for those parameters. This is distinguished from the random residual error for observed data, e.g. coming from assay variability.
For infliximab, a PopPK model has been described in adult patients with UC [6], and adult and pediatric patients with CD [7]. In both disease types, a two‐compartment PopPK model described the serum infliximab concentration–time data well. In UC, the PopPK estimates were for clearance (CL: 0.407 l d−1), volumes of distribution in the central (V1: 3.29 l) and peripheral (V2: 4.13 l) compartments, and intercompartment clearance (Q: 7.14 l d−1) [6] . Infliximab exhibited interindividual variability for CL and V1 of 37.7% and 22.1%, respectively. Infliximab's elimination half‐life was approximately 14 days. Covariate analysis showed that V1 increased as body weight increased, and CL was higher in patients with anti‐drug antibodies (ADA) and in those with lower albumin concentrations. In CD, the PopPK estimates for a typical child that weighs 42 kg were 5.43 ml (kg d−1)−1 for CL, 54.2 ml kg−1 for V1, 29.2 ml kg−1 for V2, and 3.52 ml (kg d−1)−1 for Q [7] . Corresponding estimates in a typical adult that weighs 68 kg were 5.39 ml (kg d−1)−1 for CL, 52.7 ml kg−1 for V1, 19.0 ml kg−1 for V2, and 2.15 ml (kg d−1)−1 for Q. Infliximab exhibited interindividual variability for CL, V1, and V2 of 30.7%, 12.6%, and 55.3%, respectively. Infliximab's elimination half‐life was approximately 13 and 12 days in children and adults, respectively. The covariate analysis in the combined pediatric and adult CD patient population showed that CL was higher in those with positive ADA or who had lower baseline albumin. In addition, concurrent immunomodulator use (purine antimetabolites or methotrexate) was associated with a 14% decrease in CL [7] . Interestingly, body weight was found to be inversely associated with CL, V1, and V2. The authors attributed this effect to the relatively lower vascularization with increased body fat that may be associated with increased body weight in both adults and children, yet a plausible physiologic explanation for this finding is unavailable.
For certolizumab pegol, two PopPK models have been described in the literature for adult patients with CD, one with baseline values of covariates [8] and a refined model with time‐varying values of covariates [9]. In the first model, the certolizumab pegol concentration‐time profile was described by a one‐compartment linear model with first‐order absorption and first‐order elimination [8] . ADA was treated as a dichotomous (positive = 1/negative = 0) covariate that caused the apparent clearance (CL/F) to increase from 0.685 to 2.74 l d−1. The elimination half‐life of certolizumab pegol in a typical patient with CD was 8 days in the absence and 2 days in the presence of ADA. Furthermore, body surface area influenced both CL/F and V/F in a linear fashion as both structural parameters increased by more than 53% and 49%, respectively, across the range of body surface area measurements in the dataset. Albumin was found to influence CL/F in a nonlinear fashion, showing a decrease from 1.05 to 0.613 l d−1 with increasing albumin concentrations from 32.8 to 49.2 g l−1. C‐reactive protein (CRP) had a borderline influence on CL/F, and CL/F increased by more than 20% across the range of CRP measurements in the dataset. Race had a minor influence on V/F. In the refined model, certolizumab‐pegol concentration–time data were described by a one‐compartment model with first‐order absorption, and both first‐order elimination and time‐dependent elimination using the ADA titer as a continuous variable. As such it was observed that ADA concentration (2.5–214 units/ml) increased the median CL/F by 142–174%. For a typical patient, the increase in body weight from 46.8 to 100.5 kg, increased the median CL/F and V/F from 82% to 120%, the increase in albumin concentration from 32 to 48 g l−1 decreased the median CL/F from 123% to 85%, while the increase in C‐reactive protein concentration from 0.5 to 54.0 mg l−1 increased the median CL/F from 83% to 113%. By incorporating body weight, albumin and C‐reactive protein as time‐varying covariates and ADA as a continuous variable, the unexplained between‐patient variability of CL/F was reduced from 27.5% and 83.6% for ADA‐negative and ADA‐positive patients, respectively, in the original model to overall 19.6% in the refined model. Indeed, as patients respond to therapy, some of the covariates that are associated with the clearance of the molecule are expected to change; for example, the acute phase reactant C‐reactive protein concentrations are expected to decrease and albumin concentrations are expected to increase [10]. Conversely, worsening of disease may result in an increased catabolic state resulting in accelerated clearance of the molecule [11].
For vedolizumab, a PopPK model has been described in the literature for adult patients with UC and CD [12]. The vedolizumab concentration–time profile was described by a two‐compartment model with parallel linear and nonlinear elimination. Using reference covariate values, linear elimination half‐life of vedolizumab was 25.5 days and linear clearance (CLL) was similar for patients with UC and CD (respectively, 0.159 and 0.155 l d−1). V1 was estimated to be 3.19 l and V2 1.66 l. Unexplained interindividual variabilities (% coefficient of variation [CV]) were 35% for CLL and 19% for V1. The covariates albumin and body weight were found to be inversely correlated with CLL potentially leading to suboptimal drug exposure in patients with low albumin and/or high body weight and were identified as potential clinically important predictors of CLL. Unfortunately, samples with ADA were excluded from the PopPK analysis for vedolizumab, so the relative effect of ADA on clearance and elimination half‐life of the molecule couldn't be assessed.
11.3 Exposure–Response
For the TNF antagonists, an apparent association was observed between drug exposure, as measured by serum drug concentrations, and response to therapy in several pivotal clinical trials, indicating that this is a class effect [13–17]. An association between exposure and response has been observed during the induction phase (to induce remission) and maintenance phase (to maintain remission over a prolonged period of time). The causality of that relationship was shown prospectively in the interventional Trough concentration Adapted infliXImab Treatment (TAXIT) trial [18]. Here, a consecutive cohort of patients with CD and UC on maintenance infliximab therapy were screened and dose‐optimized to reach an infliximab trough concentration between the range of 3–7 μg ml−1. In doing so, of the patients with sub‐therapeutic exposure (<3 μg ml−1) at inclusion, a significantly higher proportion achieved clinical remission and lower CRP concentration after dose escalation and reaching a trough concentration within the optimal range. Vice versa, dose‐reduction in patients with supra‐therapeutic exposure (>7 μg ml−1) at inclusion, resulted in a significant decrease in drug costs of 28%, without change in the proportion of patients in clinical remission. At the end of the randomized maintenance phase, there was a numerically higher proportion of patients with de novo ADA formation in the clinically based vs. therapeutic drug monitoring‐based dosing arm. Although this difference was not statistically significant, a recent study corroborates these findings that adequate exposure during infliximab maintenance therapy (trough concentration of ≥3 μg ml−1) may be protective against immunogenicity formation [19].
Albeit evident for the TNF antagonists, the exposure–response relationship for vedolizumab remains to be elucidated. The monoclonal antibody vedolizumab, an integrin antagonist that targets α4β7 integrin, was shown to be effective in inducing and maintaining clinical remission in IBD [20,21]. Whereas TNF antagonists target a cytokine, vedolizumab has a unique mechanism of action whereby it inhibits leukocyte migration to the gut through blockage of the interaction between α4β7 integrin on memory T‐ and B‐cells and mucosal addressin cell adhesion molecule‐1 expressed on the vascular endothelium of the gut. Even though in vitro studies showed a 95% α4β7 integrin receptor occupancy at vedolizumab concentrations of 1 μg ml−1 [12] , there may be a benefit for targeting higher serum vedolizumab concentrations in patients. Indeed, in the GEMINI 1 and 2 trials, it was observed that higher vedolizumab serum concentrations were associated with better outcomes to therapy, which cannot be explained by receptor saturation alone [ 20 , 21 ]. This leads to the possibility that penetration of drug into the tissue may be important for the mechanism of action of vedolizmab therapy. Furthermore, a recent study demonstrated that serum TNF antagonist drug concentration correlated with tissue concentrations in uninflamed tissue, but not inflamed tissue [22]. Serum‐to‐tissue drug level mismatch was greatest in those with active mucosal disease, and was lowest in those in remission. A numerical trend was identified where uninflamed tissue had the highest ratio of TNF‐antagonist‐to‐TNF, while severely inflamed tissue had the lowest (17.8 for no inflammation, 4.2 for mild, 3.8 for moderate, and 2.0 for severe inflammation; p = 0.88). Therefore, in patients with active disease, tissue concentrations of drug may be more than systemic measurement of drug concentrations to guide clinical management in IBD.
For ustekinumab, data on pharmacokinetics and consequently exposure–response in IBD is scarce. In a post hoc analysis of the Phase 3 UNITI trials of ustekinumab in Crohn's disease, it was observed that during induction and maintenance, serum ustekinumab concentrations were positively associated with the proportions of patients achieving clinical remission, and inversely related to CRP levels [23]. Furthermore, there was no relationship between serum ustekinumab concentrations and the incidence of infections, serious infections, or serious adverse events following induction or maintenance therapy.
11.4 Exposure‐Based Dosing Strategies
Given the apparent exposure–response relationship observed for TNF antagonists, various methods have been proposed to optimize dosing to achieve better outcomes. Proactive therapeutic drug monitoring can be done both during induction therapy (to increase primary response and remission rates) or maintenance therapy (to achieve sustained response and avoid loss of response). This is primarily applicable to patients with suboptimal drug exposure in which the dose would be increased or the interval between drug administrations would be decreased.
Different drug concentration thresholds have been proposed in the literature that are associated with outcomes and thus one approach is to change the dose based on the observed systemic drug concentration. This approach was used in the TAXIT trial, and dosing of infliximab was changed according to a predefined algorithm to target trough concentration of infliximab between 3–7 μg ml−1 during maintenance therapy [18] . In short, if concentrations were above 7 μg ml−1, the dose was first decreased to 5 mg kg−1 (if >5 mg kg−1 at start) after which the interval between infusion was increased by 2 weeks. The increase in interval by two weeks was chosen to reflect one elimination half‐life of drug so theoretically patients with an infliximab concentration of >7 μg ml−1 would then fall within the predefined interval. Vice versa, patients with an infliximab concentration <3 μg ml−1 would undergo a decrease of interval between infusions by two weeks (to a minimum of four weeks), after which the dose would be increased from 5 to 10 mg kg−1. By applying this algorithm, 136/148 patients (92%) achieved infliximab trough concentrations within the optimal interval of 3–7 μg ml−1, requiring an average of 2.1 dose adaptations (= two measurements of infliximab serum trough concentrations). The benefit of this approach is that it does not require the identification of underlying factors (i.e. covariates) that affect drug exposure. However, the limitations are that drug concentrations need to be measured at exact time‐points (typically just before the next administration of drug, corresponding to the time‐point at which the “threshold” was defined) and that the current assays for measuring drug concentrations require a turn‐around time of 1–2 weeks, delaying the implementation of the treatment decision. The latter may be alleviated in the future by utilizing a quantitative point‐of‐care assay that can measure drug concentrations in serum within 20 minutes [24].
Another approach is to perform model‐based dosing using prior knowledge of the drug, individual patient demographics, disease activity measures, and measured concentrations. These sources of information can be integrated by using Bayesian forecasting that provides a mathematical rule for revising a forecast, considering the experience (i.e. a PopPK and/or PD model) and new observations. In the absence of any individual data, the concentration predictions are weighted toward the population typical values and as more individual data becomes available, the concentration predictions will approach the individual's “true” values [25]. The updated and individualized predictions can then be used to calculate a dose that would result in drug exposure that is within the predefined target. In an observational study in 50 pediatric IBD patients receiving standard dosing of infliximab (5 mg kg−1) at weeks 0, 2, 6, and 14, a model was used to forecast which patients would require nonstandard maintenance dosing of infliximab to maintain trough concentrations >3 μg ml−1 [26]. When only clinical data at week 14 were included in the model, standard dosing was recommended for 43/50 patients (44%). However, when the measured infliximab and ADA concentration at week 14 were added to the clinical data as input for the model, standard dosing was recommended for only 11/50 patients (22%). An in silico study using a virtual population of patients treated with infliximab compared several maintenance dosing strategies: on label dosing vs. three types of therapeutic drug monitoring‐guided dosing: stepwise dosing (based on a self‐developed algorithm), proportional dosing (based on a calculation assuming linear PK), or model‐based dosing (based on a Bayesian model) [25] . Here, the latter was found to be superior in maintaining target trough concentrations, although all adaptive dosing strategies resulted in a proportion of patients of ≥86% achieving a target trough concentration of >3 μg ml−1 at least once, in approximately three dosing intervals (156 days for stepwise and proportional dosing vs. 140 days for model‐based dosing).
11.5 Discussion
Therapeutic drug monitoring has been used historically for drugs with a narrow therapeutic window (e.g. warfarin), where subtherapeutic drug exposure results in impaired efficacy and is related to toxicity. Emerging evidence for therapeutic monoclonal antibodies shows the importance of adequate drug exposure for achieving outcomes in chronic inflammatory diseases, especially IBD [27]. However, in contrast to compounds with a narrow therapeutic window, there is a lesser risk for treatment‐related toxicity. Instead, there is an opportunity to use therapeutic drug monitoring to improve outcomes and reduce treatment costs [28]. Various approaches have been suggested to perform therapeutic drug monitoring, some of which have been validated in randomized controlled clinical trials [ 18 , 28 ]. To date, a head‐to‐head comparison of therapeutic drug monitoring vs. model‐based dosing in patients is lacking. It also remains unclear what the optimal frequency is to perform therapeutic drug monitoring in patients during maintenance therapy. Indeed, the TAXIT trial showed that there is no additional benefit to continue dosing based on therapeutic drug monitoring within the first year of dose optimization [18] . Also, the role of model‐based dosing during induction therapy with infliximab remains to be assessed, as there the importance of adequate exposure may even have a greater impact, as for ulcerative colitis, adequate drug concentrations of infliximab during induction therapy have been associated with mucosal healing [29]. A possible strategy for personalized dosing of infliximab during induction therapy is outlined in Figure 11.1.
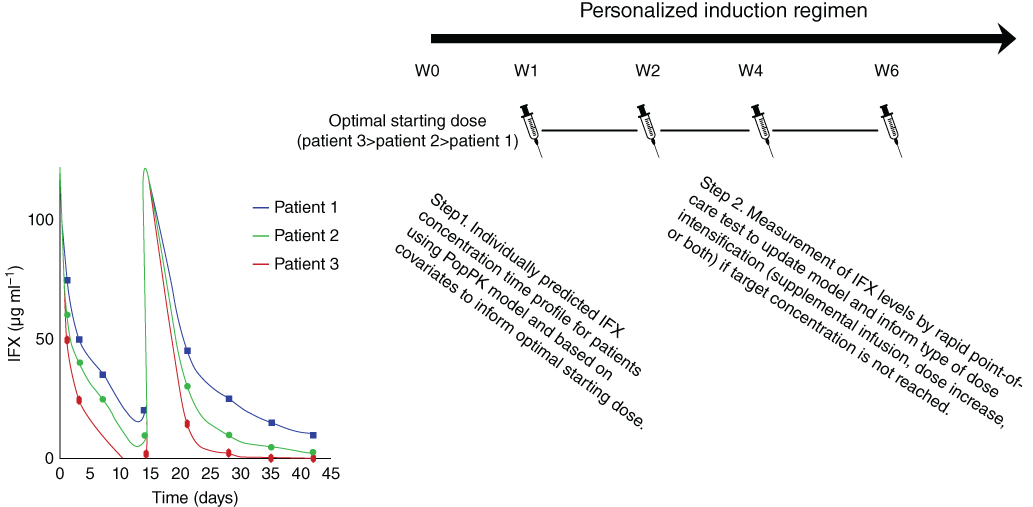
Figure 11.1 Personalized induction dosing of infliximab based on a population pharmacokinetic (PopPK) model including individual covariates to calculate the optimal starting dose (Step 1) followed by routine therapeutic drug monitoring with a point‐of‐care assay to refine the model predictions and dosing regimen (Step 2) in order to achieve infliximab exposure within the range that is associated with clinically important outcomes throughout the induction phase. . (See insert for color representation of this figure.)
Source: Adapted from Hindryckx et al. 2017 [30]
All current adaptive dosing regimens share the inability to define the target, i.e. the exposure threshold that needs to be reached in individual patients in order to achieve a high likelihood of attaining clinically important outcomes. This has also been recognized as a knowledge gap in the recently published guidelines on therapeutic drug monitoring published by the American Gastroenterology Association [31,32]. Thus, there is a need to describe inter‐individual variability in drug and target disposition in patients that will allow for a personalized dosing approach to increase the likelihood of patients responding favorably to therapy. Within that setting, it is equally important to take into account the mechanism of action of these molecules, as some patients may fail to have a (complete) response to therapy because of alternative immunoinflammatory pathways being activated [33].
Future research should continue to focus on the utility of therapeutic drug monitoring of biologics in IBD patients. Learnings in IBD may be applicable to other chronic inflammatory diseases, as well as oncology and may impact clinical development programs of newer molecules. Ultimately, individualized dosing may hold the premise to reduce drug‐related side‐effects and to increase the efficacy and cost‐effectiveness of biologic therapy.
References
- 1 Baumgart, D.C. and Sandborn, W.J. (2012). Crohn's disease. Lancet 380 (9853): 1590–1605.
- 2 Ordas, I., Eckmann, L., Talamini, M. et al. (2012). Ulcerative colitis. Lancet 380 (9853): 1606–1619.
- 3 Pariente, B., Cosnes, J., Danese, S. et al. (2011). Development of the Crohn's disease digestive damage score, the Lemann score. Inflamm. Bowel Dis. 17 (6): 1415–1422.
- 4 Bouguen, G., Levesque, B.G., Feagan, B.G. et al. (2015). Treat to target: a proposed new paradigm for the management of Crohn's disease. Clin. Gastroenterol. Hepatol. (6): 13, 1042–1050.e2.
- 5 Vande Casteele, N. and Gils, A. (2015). Pharmacokinetics of anti‐TNF monoclonal antibodies in inflammatory bowel disease: adding value to current practice. J. Clin. Pharmacol. 55 (S3): S39–S50.
- 6 Fasanmade, A.A., Adedokun, O.J., Ford, J. et al. (2009). Population pharmacokinetic analysis of infliximab in patients with ulcerative colitis. Eur. J. Clin. Pharmacol. 65 (12): 1211–1228.
- 7 Fasanmade, A.A., Adedokun, O.J., Blank, M. et al. (2011). Pharmacokinetic properties of infliximab in children and adults with Crohn's disease: a retrospective analysis of data from 2 phase III clinical trials. Clin. Ther. 33 (7): 946–964.
- 8 Wade, J.R., Parker, G., Kosutic, G. et al. (2015). Population pharmacokinetic analysis of certolizumab pegol in patients with Crohn's disease. J. Clin. Pharmacol. 55 (8): 866–874.
- 9 Vande Casteele, N., Mould, D.R., Coarse, J. et al. (2017). Accounting for pharmacokinetic variability of certolizumab pegol in patients with Crohn's disease. Clin. Pharmacokinet. 56 (12): 1513–1523.
- 10 Sandborn, W.J., Lee, S.D., Randall, C. et al. (2014). Long‐term safety and efficacy of certolizumab pegol in the treatment of Crohn's disease: 7‐year results from the PRECiSE 3 study. Aliment. Pharmacol. Ther. 40 (8): 903–916.
- 11 Vermeire, S., Van Assche, G., and Rutgeerts, P. (2004). C‐reactive protein as a marker for inflammatory bowel disease. Inflamm. Bowel Dis. 10 (5): 661–665.
- 12 Rosario, M., Dirks, N.L., Gastonguay, M.R. et al. (2015). Population pharmacokinetics–pharmacodynamics of vedolizumab in patients with ulcerative colitis and Crohn's disease. Aliment. Pharmacol. Ther. 42 (2): 188–202.
- 13 Sandborn, W.J., Feagan, B.G., Marano, C. et al. (2014). Subcutaneous golimumab maintains clinical response in patients with moderate‐to‐severe ulcerative colitis. Gastroenterology 146 (1): 96–109.e1.
- 14 Mostafa, N.M., Eckert, D., Pradhan, R.S. et al. (2013). P333 exposure–efficacy relationship (ER) for adalimumab during induction phase of treatment of adult patients with moderate to severe ulcerative colitis (UC). United Eur. Gastroenterol. J. 1 (1 Suppl.): A221–A222.
- 15 Adedokun, O.J., Sandborn, W.J., Feagan, B.G. et al. (2014). Association between serum concentration of infliximab and efficacy in adult patients with ulcerative colitis. Gastroenterology 147 (6): 1296–307.e5.
- 16 Cornillie, F., Hanauer, S.B., Diamond, R.H. et al. (2014). Postinduction serum infliximab trough level and decrease of C‐reactive protein level are associated with durable sustained response to infliximab: a retrospective analysis of the ACCENT I trial. Gut 63 (11): 1721–1727.
- 17 Colombel, J.F., Sandborn, W.J., Allez, M. et al. (2014). Association between plasma concentrations of certolizumab pegol and endoscopic outcomes of patients with Crohn's disease. Clin. Gastroenterol. Hepatol. 12 (3): 423–31.e1.
- 18 Vande Casteele, N., Ferrante, M., Van Assche, G. et al. (2015). Trough concentrations of infliximab guide dosing for patients with inflammatory bowel disease. Gastroenterology 148 (7): 1320–9.e3.
- 19 Brandse, J.F., Mould, D., Smeekes, O. et al. (2017). A real‐life population pharmacokinetic study reveals factors associated with clearance and immunogenicity of infliximab in inflammatory bowel disease. Inflamm. Bowel Dis. 23 (4): 650–660.
- 20 Sandborn, W.J., Feagan, B.G., Rutgeerts, P. et al. (2013). Vedolizumab as induction and maintenance therapy for Crohn's disease. N. Engl. J. Med. 369 (8): 711–721.
- 21 Feagan, B.G., Rutgeerts, P., Sands, B.E. et al. (2013). Vedolizumab as induction and maintenance therapy for ulcerative colitis. N. Engl. J. Med. 369 (8): 699–710.
- 22 Yarur, A.J., Jain, A., Sussman, D.A. et al. (2015). The association of tissue anti‐TNF drug levels with serological and endoscopic disease activity in inflammatory bowel disease: the ATLAS study. Gut 65 (2): 249–255.
- 23 Adedokun, O.J., Xu, Z., Gasink, C. et al. (eds.) (2016). Pharmacokinetics and Exposure–Response Relationships of Intravenously Administered Ustekinumab During Induction Treatment in Patients with Crohn's Disease: Results from the UNITI‐1 and UNITI‐2 Studies. Oxford: Oxford University Press.
- 24 Van Stappen, T., Bollen, L., Vande Casteele, N. et al. (2016). Rapid test for infliximab drug concentration allows immediate dose adaptation. Clin. Transl. Gastroenterol. 7 (12): e206.
- 25 Wojciechowski, J., Upton, R.N., Mould, D.R. et al. (2017). Infliximab maintenance dosing in inflammatory bowel disease: an example for in silico assessment of adaptive dosing strategies. AAPS J. 19 (4): 1136–1147.
- 26 Dubinsky, M.C., Phan, B.L., Singh, N. et al. (2017). Pharmacokinetic dashboard‐recommended dosing is different than standard of care dosing in infliximab‐treated pediatric IBD patients. AAPS J. 19 (1): 215–222.
- 27 Vande Casteele, N., Feagan, B.G., Gils, A. et al. (2014). Therapeutic drug monitoring in inflammatory bowel disease: current state and future perspectives. Curr. Gastroenterol. Rep. 16 (4): 378.
- 28 Steenholdt, C., Brynskov, J., Thomsen, O.O. et al. (2013). Individualised therapy is more cost‐effective than dose intensification in patients with Crohn's disease who lose response to anti‐TNF treatment: a randomised, controlled trial. Gut 63 (3): 919–927.
- 29 Papamichael, K., Van Stappen, T., Vande Casteele, N. et al. (2016). Infliximab concentration thresholds during induction therapy are associated with short‐term mucosal healing in patients with ulcerative colitis. Clin. Gastroenterol. Hepatol. 14 (4): 543–549.
- 30 Hindryckx, P., Novak, G., Vande Casteele, N. et al. (2017). Review article: dose optimisation of infliximab for acute severe ulcerative colitis. Aliment. Pharmacol Ther. 45 (5): 617–630.
- 31 Vande Casteele, N., Herfarth, H., Katz, J. et al. (2017). American gastroenterological association institute technical review on the role of therapeutic drug monitoring in the management of inflammatory bowel diseases. Gastroenterology 153 (3): 835–857.e6.
- 32 Feuerstein, J.D., Nguyen, G.C., Kupfer, S.S. et al., American Gastroenterological Association (2017). Therapeutic drug monitoring in inflammatory bowel disease. Gastroenterology 153: 858–859.
- 33 Papamichael, K., Gils, A., Rutgeerts, P. et al. (2014). Role for therapeutic drug monitoring during induction therapy with TNF antagonists in IBD: evolution in the definition and management of primary nonresponse. Inflamm. Bowel Dis. 21: 182–197.