
HOUR 22
Network Troubleshooting
What You’ll Learn in This Hour:
• How to monitor router performance
• How to monitor server performance
• How to use Internet software tools to diagnose TCP/IP problems
Even the best designed network can experience problems. There can be connectivity issues on the network because of problems such as a faulty network interface card (NIC) or a malfunctioning router. Problems accessing important network services can also crop up because of hardware issues on a server. In this hour, we look at some of the tools and procedures for troubleshooting a network. We examine strategies that allow you to analyze problems before they become unmanageable.
Before going into these details, we introduce two more subjects that are keys to the management of computer networks: Management Information Bases (MIBs) and the Simple Network Management Protocol (SNMP).
MIBs and SNMP
An MIB is a database containing information about key software and hardware components in a network. It’s used to monitor and manage these components. An MIB identifies each management component as a managed object with a registered Internet identifier. For example, the official identifier for an Ethernet interface is 1.3.6.1.2.1.2.1.3. An MIB also defines the values that you can associate with a managed object, such as a MAC address for a PC attached to an Ethernet LAN and the traffic that this node has processed.
Examples of permissible values that can describe an Ethernet interface are “up,” “down,” “testing, “time of change in operational status,” “number of packets sent and received during a measured time,” “number of packets discarded and the reasons,” and scores of other important pieces of network management information. In addition, each of these values is identified with a unique Internet ID.
The result of using standardized MIBs is the transparent transmittal and reception of network management information between different machines, perhaps containing vendor-specific hardware and software components. For example, if a Windows server sends an alarm message to say, a Cisco router, it doesn’t matter if the two nodes are vendor specific. The message is standardized down to the bit level. It’s the responsibility of Windows and Cisco software to make whatever translations are needed to allow this transparency. But then, that’s the idea of standardized protocols in the first place.
The Internet publishes hundreds of MIBs and defines thousands of objects. Most software and hardware vendors support them. After all, why reinvent the wheel, especially a wheel that won’t work on another chassis? For a look at the prevalence of MIBs, go to www.cisco.com/public/sw-center/netmgmt/cmtk/mibs.shtml.
SNMP is the second major Internet network management tool you should know and use. In fact, SNMP and MIBs are inseparable partners. The MIB defines the information about managed resources, and SNMP is the L_7 protocol that carries this information between nodes. SNMP operates over Transmission Control Protocol (TCP) or User Datagram Protocol (UDP) with Internet port numbers 160, 161, and 162.
SNMP defines the type, structure, and format of the network management messages. For example, one type of SNMP message is an alarm (reporting on an unusual condition); another is a get, which asks another node for some network management information.
Troubleshooting Routers
If your organization has installed its own routers, it’s likely they’re Cisco routers. If your network is small (perhaps a small business or a home network), it’s probable that your broadband Internet service provider (ISP) shipped a router (or routers) to you. In the former situation, you’ll be tasked with troubleshooting. In the latter situation, your ISP will handle this chore.
As we’ve learned in previous hours, most of the router’s operations take place at the lower three layers of the Open Systems Interconnection (OSI) model. These operations are rich in function, and some are complex in their implementations. For example, subnetting must be done carefully; otherwise, incorrect IP addresses can cause routing and forwarding errors.
You can use the Cisco Discovery Protocol (CDP)1 to obtain protocol addresses of neighboring devices and discover the platform of those devices. You can also use CDP to show information about the interfaces that your router uses. CDP is media- and protocol-independent and runs on all Cisco-manufactured equipment, including routers, bridges, access servers, and switches.
1 Sourced from www.cisco.com/en/US/docs/ios/12_1/configfun/configuration/guide/fcd301c.html.
Use of SNMP with the CDP MIB allows network management applications to learn the device type and the SNMP information of neighboring devices and to send SNMP queries to those devices.
Each device configured for CDP sends periodic messages, known as advertisements, to a multicast address. Each device advertises at least one address where it can receive SNMP messages. The advertisements also contain Time to Live (TTL) information, which indicates the length of time a receiving device should hold CDP information before discarding it. Each device also listens to the periodic CDP messages sent by others to learn about neighboring devices and determine when their interfaces to the media go up or down.
Cisco offers its CDP to help you in your troubleshooting endeavors. It can transmit network management messages on all active interfaces to confirm the correct operations of network devices, the operating system (OS) version, and associated Internet Protocol (IP) addresses. It can operate alongside various Network Operating Systems (NOSs) and OSs. You can determine if your Windows software has CDP loaded by clicking Control Panel, Device Manager, View, Devices by Connection, Show Hidden Devices.
A recent addition to CDP is on-demand routing (ODR). You can use it to discover other Cisco devices, the device type, and the IP address. ODR allows routing information to be contained in its messages. This feature simplifies your job of running and managing routing protocols, such as the Internet’s Open Shortest Path First (OSPF), which is a widely used route discovery protocol.
Monitoring Server Hardware
There’s an old sport adage that the best defense is a good offense. In terms of networking, it means a network administrator must be proactive and attempt to anticipate potential problems on the network before they affect network services. Because network servers are by definition mission critical, it’s important to monitor server performance.
You can use tools to track a server’s performance over time and determine if a computer component, such as a hard drive or server memory, will become a possible bottleneck under high network traffic (a bottleneck being an impedance to server performance, which can slow a service and user access to that service).
Before we look at some of the different tools that the various NOSs discussed in this book provide, a few words should be said about baselines. When you first deploy your network or a new server on the network, you should record a set of baseline readings for the server’s hardware (using the performance monitoring tools the NOS supplies). This allows you to then monitor the server’s performance over time as it relates to specific server hardware, such as the drive array, and allows you to tweak server software settings, such as the amount of virtual memory configured on a server (which can be an issue with a server running Windows Server 2003).
As mentioned, the different NOS platforms offer various types of monitoring tools. However, no matter what tools are available, you should monitor certain hardware components on a server over time (using your baseline as a starting point) to avoid bottlenecks. We’ll look at these components and at specific tools from some selected NOSs that allow you to monitor server performance.
Processor Performance
Servers are outfitted with fast processors. For example, many server vendors provide high-end servers that take advantage of Intel’s Xeon 7460 processor that runs at 2.66GHz. Many servers also offer a motherboard that can take more than one processor. As well, upper-end NOSs are set up to run on multiple processors. For example, Microsoft’s Enterprise Edition supports up to 8 processors.
![]()
When you put together the specifications for a new server, the processor you select is as important as the number and size of the disk drives and the amount of RAM. Intel-based servers are available with Celeron, Pentium, and Xeon processors. A small office situation might only require a basic server running a Celeron processor (but be careful about choosing low-end processors). Larger companies might require Pentium IV and might require a server that allows for multiple processors.
In terms of processor performance, a bottleneck can arise when the processor (or processors) can no longer keep up with the system calls it gets from the different software processes running on the server. You can monitor processor performance by reviewing various performance parameters, such as the number of events that are waiting in line to be acted upon by the processor or the time spent on a particular thread (a thread being a particular part of a program that can execute independently).
Each NOS allows you to view counters (often in a chart format) that relate to processor (CPU) performance. For example, Novell NetWare (eDirectroy 8.8) provides the Server Health table that you can access using the web-based NetWare Remote Manager (meaning that you can monitor server health from any client on the network). Figure 22.1 shows the Server Health table for a NetWare server. Not only does this table allow you a quick view of server status issues such as CPU utilization and failed logon, but any problems (if they exist) are flagged with a red icon in the Status column.
FIGURE 22.1 The NetWare Health table allows you to view CPU utilization and other server performance parameters.

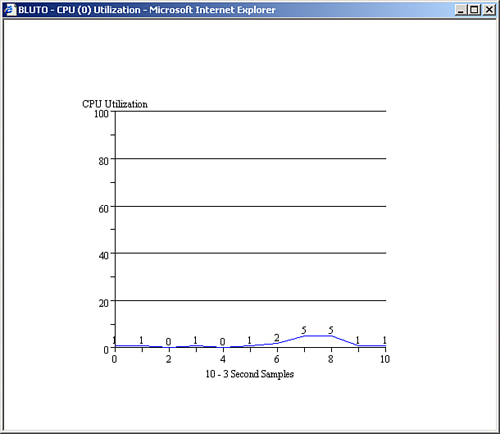
In terms of CPU utilization, it’s also helpful to be able to see a graph of CPU utilization over time. By clicking the CPU Utilization link on the Server Health table, you can view a chart as shown in Figure 22.2.
FIGURE 22.2 You can view server performance in a chart format.
Windows Server 2003 also provides counters that you can view to monitor processor performance (and set up your initial baselines for the server). You can view these counters using the Windows Performance Monitor:
• %Processor Time—This counter, found under the Processor object, is a measure of the time that the processor is executing a nonidle thread. If it’s consistently around 75–80%, you might need to upgrade the processor on the server or add another processor if the motherboard allows for dual processing.
• Interrupts/sec—This counter, found under the Processor object, is the average number of interrupt calls that the processor is receiving from hardware devices, such as a network card or modem. If it increases beyond 3,500 and the %Processor Time counter doesn’t increase, the problem might not be the processor but a device that’s sending spurious interrupts to the processor, such as a bad network or small computer system interface (SCSI) card. This can be caused by the device itself or the driver you’re using for the device.
• Processor Queue Length—This counter, found under the System object, measures the number of threads waiting to be processed. If it reaches a value of 10 or more, the processor might be a bottleneck. This means you should go to a faster processor or upgrade to a multiprocessor motherboard on the server.
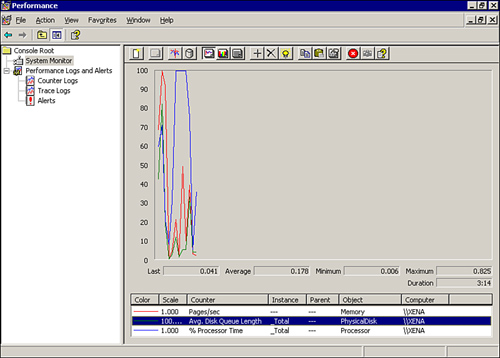
Figure 22.3 shows the Windows Performance Monitor in the graph view. You can configure multiple counters in the monitor window, allowing you to track multiple hardware performance issues with one quick view.
FIGURE 22.3 You can view CPU and server performance in a chart format.
![]()
In some situations, a faulty line of code or corrupted software can monopolize a server’s processing, resulting in poor server performance. In addition, a bad hardware device, such as a malfunctioning NIC, could be sending interrupts to the processor. Most of the tools used for monitoring CPU performance also allow you to view the CPU’s interaction with individual threads, which can help in diagnosing whether the problem is bad software (or hardware) rather than the CPU itself.
If you determine a server is slowing network services because of a processor issue, you’re faced with the possibility of replacing the processor (or adding another processor if possible), adding an additional server, or upgrading the entire server. If one server is providing multiple services (such as a server that is providing DNS, DHCP, and perhaps other services), you can cut down on the number of services that the server is required to supply and deploy another server to pick up the service that was removed.
The bottom line pertaining to server hardware performance boils down to planning. If you planned well up front and determined the potential growth of the network, you probably purchased servers that will provide services effectively even when you have growth spurts (in terms of users) on the network.
Hard Drive Performance and Space
Another area related to server performance that you should monitor is related to the server’s hard drive (or drives). Not only is drive performance important, but the amount of available space is an issue, particularly on mail and file servers.
Server drives come in many sizes and speeds. You want to outfit your servers with high-performance drives. Servers that experience traffic of any consequence need to be configured with multiple SCSI drives that can be configured in a RAID array. (RAID is discussed in Hour 5, “Network Concepts.”)
The types of events important to monitor are the time that the drive is occupied with read/write functions, the size of the disk’s queue, and the amount of free space on the drive.
A drive that’s constantly busy with read/write functions is experiencing some type of problem. In some cases, it might help to defragment the drive. However, in most cases, you need to replace the drive with a faster one or replace the drive with a RAID stripe set that supplies faster read/write capabilities.
Another drive performance parameter that can tip you off to a potential drive problem is the disk queue length for the drive. If the queue contains numerous requests for access to the drive, your users are going to experience lag time in accessing and saving their files to the volume. Again, you might have to replace the drive or take advantage of a RAID array. Look back at Figure 22.3, which shows how disk queue length is monitored on a Windows Server using the Performance Monitor. (The Disk Queue Length counter is shown in the monitor window.)
It’s a matter of common sense for a network administrator to keep track of the amount of free space on server drives. For example, if a file server’s drive is filling up fast, you need to take action. You might add a drive to extend the size of a particular volume or set restrictions of the amount of drive space that you allocate to network users.
![]()
Many network servers are now available (at reasonable prices) with hot swappable drives. The drives are accessed through the front of the server box, and you can add or replace drives while the server continues to run. These servers make an administrator’s life much easier.
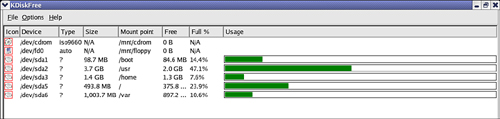
Figure 22.4 shows a simple Linux utility called Kdiskfree. This GUI tool presents statistics on disk usage and the percent of free disk space.
FIGURE 22.4 Utilities, such as Kdiskfree, allow you to keep track of drive utilization.
Memory Utilization
Another key resource on a network server is the server’s memory. Although NOS vendors supply customers with specifications related to the amount of memory needed to run the operating system (OS), you should configure the server with enough memory to do its job. In most cases, this is going to be much more memory than the specifications recommend.
When a server uses its available memory, it resorts to a paging file that enables the server to temporarily dump some processes to the server hard drive. (In the Windows environment, the paging file is often referred to as virtual memory.) If you have a server that too often relies on the paging file (because of low available memory), the server is going to slow down and become a potential bottleneck on the network. In most cases, you can remedy this problem by adding more RAM to the server.
Performance counters you can use to track memory usage and health on a server are the number of bytes available to running processes and the number of times the computer must rely on the paging file. Each NOS includes different methods of tracking memory usage statistics. For example, Windows Server 2003 and 2008 provide the following memory counters:
• Available Bytes—If this counter (a measure of the physical memory available to running processes) consistently falls to less than 4MB, you need more memory on the server.
• Pages/Sec—This counter measures the number of times the computer must rely on the paging file (dumping items in RAM to the hard drive temporarily). This event is known as a page fault. If this counter consistently reads 20 on the System Monitor, you should add more RAM. Excessive page faults can cause system-wide delays in terms of server access.
• Committed Bytes—This counter shows the amount of RAM being used and the amount of space needed for the paging file if the data has to be moved to the disk. You should see a value on this counter that is less than the RAM installed on the server. If the value is more than the RAM, you’re using the paging file too often; add more memory.
If you look back at Figure 22.3, you can see the that Performance Monitor has been configured to track the Pages/Sec counter. On a UNIX or a Linux system, you can use the command line tool vmstat. Vmstat can provide such information as the amount of free memory and statistics related to the swap file (page file).
The Linux environment also has a system monitor that allows you to view memory and swap usage in a GUI format. Figure 22.5 shows the System Monitor and the counters that it provides.
FIGURE 22.5 Utilities such as the Linux System Monitor allow you to track memory usage.

![]()
Most NOSs allow the network administrator to configure performance or event alerts. For example, you can set a particular threshold value for a particular parameter such as CPU utilization or hard drive free space. When the threshold that you have set is exceeded, the server’s performance utility alerts you to the fact.
Using Event Logs to Track Problems
Another useful tool for tracking server problems is the system log. Each NOS provides tools to record logs on the server. Periodically viewing these logs (even when a problem hasn’t been reported or become obvious on the network) can help you nip a problem in the bud and keep important services running on the network.
These logs also show when a process has failed, and, in most cases, the logs can be configured to accumulate specific information related to the server. NOSs provide different types of event logs. System logs track events related to system services and resources. Application logs record events related to the applications running on a server. Security logs record events related to user behaviors such as failed logons or events that you configure, such as the auditing of user access to a particular volume or resource on the server.
You can access event logs via the command line or by using a GUI utility (depending on the NOS). For example, on a server running Red Hat Linux, you can access system logs using the System Logs GUI utility shown in Figure 22.6.
FIGURE 22.6 You can view system logs on a Red Hat server using the System Logs utility.
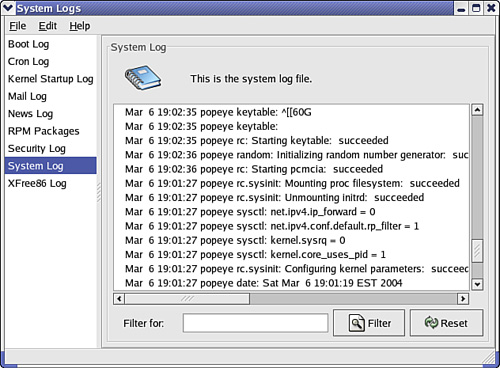
The System Logs utility allows you to view the system log, security log, and other logs configured on the system. You can filter and reset logs in the utility window.
When you view a system log, you’re looking for red flags. You want to know if a particular process has failed or if a particular service on a server is having a problem. Examining Figure 22.6 again, notice that a kernel module failed when the server was booted.
![]()
For you to use system logs effectively as a diagnosis tool related to server performance, you need to understand what you’re looking at. Each NOS has a unique way of recording and specifying log events. It’s a good idea to spend time with your NOS documentation to gain an understanding of what a particular event entails and how you might remedy it.
The Windows Server 2003 NOS (as well as Vista) includes the Event Viewer, which allows you to track events contained in an application log, a security log, and a system log. The Event Viewer employs a system of icons that helps you determine whether there has been a critical event on the server:
• The Information icon—Denotes the logging of successful system events and other processes
• The Warning icon—Shows a noncritical error on the system
• The Error icon—Indicates the failure of a major function (such as a driver failure)
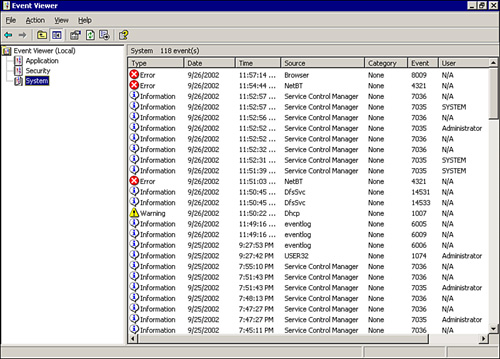
Figure 22.7 shows the system log in the Windows Event Viewer. Note that NETBT has error icons. This means that there’s a problem with the configuration of NetBIOS over TCP/IP on the server (which is also causing the browser error shown in Figure 22.7).
FIGURE 22.7 The Windows Event Viewer uses a system of icons to categorize events shown in the various system logs.
Event logs grant a method of tracking system issues and problems after they’ve happened. It’s important to take the information you find in system logs and use it to fine-tune your server’s configuration before you face a major problem. Using event logs in conjunction with performance monitoring (as discussed in the previous section) should aid you in keeping up with server issues before you experience a major network meltdown.
TCP/IP Connectivity Command-Line Tools
So far, we’ve examined tools that allow you to monitor router and server hardware and software performance and pinpoint real-time hardware and software errors using system logs. Another potential problem area that you’ll have to deal with is the realm of connectivity issues. Connectivity problems can occur because of physical cabling or device malfunctions on the network. They may also be attributable to incorrect software configurations. Because practically every data network uses TCP/IP, it makes sense to look at some of the command-line tools you can use to help diagnose connectivity problems on a TCP/IP network.
The great thing about these command-line tools, such as FTP, ping, and traceroute, is that they’re available no matter what NOS you’re using. Each NOS platform also offers command-line diagnostic tools particular to that platform. Understanding the use of some of the basic TCP/IP-related commands discussed here will help you as you begin to develop your own strategy for diagnosing connectivity issues.
Ping
The ping command is useful for checking the connection between a computer and a remote host or server. Ping uses Internet Control Message Protocol (ICMP), a companion protocol of IP, to determine whether another computer is on the network and whether you can reach it.
To use the ping command, simply type the following:
ping the.remote.ip.address
such as
ping 172.16.0.12
This returns one of several types of values. First, if your computer is capable of connecting to the computer it’s pinging, it looks like the following:
C: >ping 172.16.0.12
Pinging 172.16.0.12 with 32 bytes of data:
![]()
Ping statistics for 172.16.0.12:
Packets: Sent = 4, Received = 4, Lost = 0 (0% loss),
Approximate round-trip times in milliseconds:
Minimum = 0ms, Maximum = 0ms, Average = 0ms
This means your computer is capable of sending 32-character packets to the remote computer. The time it takes to send and receive a packet is 255 milliseconds. The stats on the bottom tell you whether you had errors or packet loss.
Now, if you can’t connect to a particular computer, you get a different message:
C: >ping 172.16.0.13
Pinging 172.16.0.13 with 32 bytes of data:
![]()
Ping statistics for 172.16.0.13:
Packets: Sent = 4, Received = 0, Lost = 4 (100% loss),
Approximate round-trip times in milliseconds:
Minimum = 0ms, Maximum = 0ms, Average = 0ms
In this case, you’re sending packets, but no one’s replying. Consequently, four packets it sent were lost. This means that the computer you want to connect to isn’t on the network—or the computer you’re using to ping isn’t on the network.
You can also use the ping command to determine whether you can get to a particular network:
C: >ping 156.234.84.95
Pinging 156.234.84.95 with 32 bytes of data:
![]()
Ping statistics for 156.234.84.95:
Packets: Sent = 4, Received = 4, Lost = 0 (0% loss),
Approximate round-trip times in milliseconds:
Minimum = 0ms, Maximum = 0ms, Average = 0ms
The Destination host unreachable message means your computer’s default gateway doesn’t know how to get to the address at the other end. This message might mean that your router needs some attention.
You can also use ping commands to see whether a particular computer has a functioning NIC or TCP/IP configuration. This is done by pinging the loopback address 127.0.0.1. Figure 22.8 shows the results of pinging the loopback address on a Windows XP computer.
FIGURE 22.8 You can also use ping to check an NIC on a computer.

![]()
On Windows-based servers and clients, the ipconfig command is useful. You can use it to check the TCP/IP configuration of a computer and to release (ipconfig/release) and renew (ipconfig/renew) the TCP/IP configuration for the computer as supplied by the network DHCP server.
FTP
File Transfer Protocol (FTP) is a widely adopted Internet tool for moving files around on a TCP/IP network. That’s what it’s intended for, and it’s what FTP is usually used for.
But FTP has an odd characteristic that makes it useful for system administrators. While it’s transferring files across the network, it measures the throughput of the network, so you can learn how efficiently the network is operating. If you can ping another computer but everything is running slowly, use FTP to send a file to it.
Start with a file that’s about 1 megabyte (MB) in size. That’s big enough to measure throughput, but it’s small enough not to cause the network problems. Send or receive the file from another machine. (You’ll need to have an FTP server on at least one of the machines to do this.)
To use FTP, you need to get to the FTP prompt. Type FTP at the command line of your OS, press Enter, and you’ll have access to the FTP prompt, as shown in the example that follows. You can then use the FTP command get to download a file.
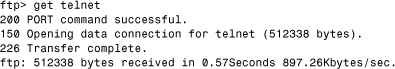
Note that this file shows that I received a 512 kilobyte (KB) file (half a megabyte) in about half a second, and then the system showed how fast the file transferred. There’s a catch—the transfer speed is in bytes, which are equivalent to 8 bits each. So, you have to multiply the speed by 8 to get the correct measure.
![]()
This is another use for FTP that isn’t usually mentioned in teaching texts, but it’s a great tool. If the network is slow, this can help quantify how slow.
Traceroute
Networks can become congested with excessive traffic or with faulty components. Sometimes packets seem to be taking 10 times as long as they should to get from point A to point B.
Traceroute (or tracert on Microsoft systems) is a utility that enables you to learn how packets are being routed across the network. This is helpful if you want to determine specifically which route your packets take. It’s also useful if you want to see whether your packets are timing out on the network because they’ve gone through too many routers.
To use this utility, type the following:

In this case, traceroute/traceert completed the trace, and I can see all the routers (14 of them) between my network and sams.com. If you’re timed out, or if you get starts in place of the times, that node is usually where your problem is occurring. Consequently, traceroute/tracert is useful for settling disputes with ISPs and network providers over the quality of your service.
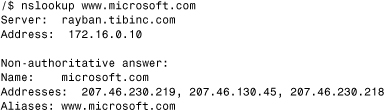
Nslookup
Sometimes, you need to use an IP address instead of a name (the DNS hostname). Other times, you don’t know the IP address for the name. Nslookup (short for name server lookup) is a utility that can help you figure out what IP address is associated with a particular name. Here’s an example:
Clearly, these four tools don’t compose a whole suite of diagnostic tools, but they come with your OS and can give you a place to start when you’re having network problems. It’s important that not only do you know how to use ping, FTP, and these other commands effectively, but you become familiar with the other command-line tools that your NOS offers. You’ll find them to be of great assistance to you and your staff.
Summary
In this hour, we examined key tools that can help you identify and possibly diagnose problems with server hardware, software, and general network connectivity problems. We learned how to use performance monitor data to establish baselines and monitor potential bottlenecks. We learned that event logs allow the network administrator to pinpoint problems. In addition, we learned that command-line tools, such as ping and traceroute, can be used to identify connectivity problems on a TCP/IP network.
Q&A
Q. What action should you take when a server hardware bottleneck is identified on your network?
A. You should address the bottleneck by upgrading the server’s hardware configuration (such as more memory or an additional processor) or by replacing the server. In some situations, you might be able to deploy a “helper” server—as in the case of services such as DNS, in which a second server can take some of the workload off the server with the bottleneck problem.
Q. How should baseline information for your servers be stored?
A. You can capture and store baseline information for servers in numerous ways. For example, in the Windows environment, you can create log files using the Performance Monitor. You can also print hard copies of initial logs, but make sure that you date the printouts. Finally, you can store baseline data and subsequent readings in a simple spreadsheet format in any spreadsheet software.
Q. If you’re having problems with an Internet connection, how can you diagnose the issue?
A. The first thing you can do is use the ping command to check your default gateway. If there’s a problem with the router, ping can help you quickly determine whether the computer can even communicate with the router. If the router is okay and the Internet problem relates to the World Wide Web, you might be dealing with a DNS server issue. Again, you can use ping to see whether the computer with the problem can communicate with the DNS server.