Hour 7. Debugging, Securing, and Measuring Our App’s Performance
What You’ll Learn This Hour:
• How to debug an app
• How to use JSLint
• How to turn on JavaScript exceptions in Visual Studio
• How to break on JavaScript exceptions
• How to use the JavaScript console
• How to debug JavaScript promises
• How to pass information securely between local and web context
• How to scrub all input
• How to store data securely using the PasswordVault
• How to measure performance of apps with the Visual Studio profiling tools for JavaScript
• Performance tips when writing JavaScript
This is the last hour of Part I, “Building the Foundation.” We have spent a lot of time working on the foundation of what makes a Windows Store app. Microsoft’s slogan during Build 2011, “Windows Re-imagined,” is definitely fitting. This system has a lot going on. Even with all the pages and time we’ve spent so far, we’ve merely just mentioned many components. This hour will be the same way, but we need to be aware that apps must be secure and also “fast and fluid,” another key phrase from the Build 2011 conference.
During this hour, we discuss tips on debugging apps. Clearly, we do not want our apps to crash or throw exceptions. We need to be diligent in keeping our apps free of bugs. The last two hours, we have discussed ways to make our apps look good. This hour we look at using Visual Studio to help debug JavaScript code.
Besides being a well-functioning app, an app needs to be secure. We cannot allow a user’s personal information be shared with unauthorized entities. When users use apps, they trust them. A single mishap can cause irresoluble harm. We need to make sure we are protecting ourselves and our users from any evildoers seeking to gain access to information they shouldn’t have.
Finally, we discuss performance during this hour. Performance isn’t something that can be addressed after the fact. It is important to understand where the pitfalls are located and how we can navigate around them. It is less about addressing preoptimization than measuring our apps and making sure they stay fast and fluid.
Debugging Apps
To start with, we need to know the best ways to debug JavaScript apps. The simplest problems are syntax problems, such as a misplaced comma, strings not enclosed in quotation marks, and a new line after a return. In many languages, syntax errors are easy to find and correct because JavaScript is a strongly typed language; it is also a dynamic language, which makes it extremely flexible. But this flexibility can cause us pain sometimes when we don’t type our code exactly right. JavaScript then tries to determine what we mean and doesn’t require us to explicitly state our intention. Sometimes it gets our intent right; sometimes it doesn’t. It is our responsibility as developers to explicitly state to the language the exact task we are trying to accomplish.
Being Productive When Programming in JavaScript
Because the JavaScript language does contain some bad parts, it can be easy to get tripped up, especially for developers coming from a language with a similar syntax. Fortunately, tools can help us as we try to master this flexible language.
Strict Variant
We talked about the first line of defense during Hour 3, “Exploring the Windows Runtime (WinRT) and Windows Library for JavaScript (WinJS),” in declaring strict mode. Refer back to the “Using the JavaScript Strict Variant” sidebar in the “Understanding the Windows Library for JavaScript (WinJS)” section of the hour.
JSLint
A tool that can help with some syntax issues is JSLint. Douglas Crockford, mentioned during Hour 1, “Getting a Refresher on JavaScript, HTML5, and CSS3,” created the JSLint tool (see http://jslint.com/). A similar project, called JSHint, can be found at www.jshint.com/. These code-analysis tools try to keep us from using the bad parts in JavaScript. They can help identify problems with syntax that can cause unexpected results when we run the app.
Turning On JavaScript Runtime Exceptions in Visual Studio
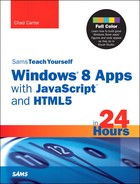
When writing JavaScript code, especially asynchronous JavaScript code, it is important to turn on first-chance exceptions in Visual Studio. We can then see exceptions without needing to do anything else to handle them. This is done by going to the Debug menu and select Exceptions (or pressing Ctrl+Alt+E). On the Exceptions dialog box that comes up, we need to make sure that the JavaScript Runtime exceptions are selected to be thrown. (Figure 7.1 shows this dialog box.) Then when we run the app in debug mode and an exception is thrown, we will see a message box that displays the error. This kind of dialog box appears only when the app is running while connected to the Visual Studio debugger. Users won’t see these exceptions.
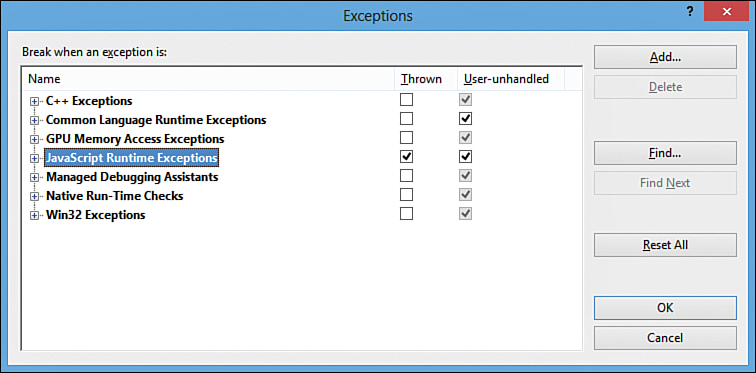
Figure 7.1. The Exceptions dialog box inside Visual Studio enables us to have JavaScript Runtime exceptions be thrown.
Debugging JavaScript with Visual Studio
We can debug JavaScript with Visual Studio just as we can debug any other language. We can start debugging by pressing F5, or the “play” button, on the toolbar. (If we want to run without debugging, we can press Ctrl+F5.) A handy Refresh button shows up on the toolbar, beside the Stop button, when the app is running. The hotkey is Ctrl+Shift+F5. This allows changes to be made in the code (HTML, CSS, or JavaScript), and the app then can be refreshed to grab the latest changes. This ultimately accomplishes quicker iterations of our code.
Another helpful feature is the Simulator. We dig into using the Simulator during Hour 9, “Working with Location and Hardware Sensors,” and Hour 13, “Working with Fullscreen, Filled, Snapped, and Portrait Views.” However, the Simulator can easily be used by changing the deploy target in Visual Studio from Local Machine to Simulator. The deploy target can be changed via the toolbar or through the app properties page. Using the Simulator is extremely beneficial when only one display is available; it makes switching between the app and Visual Studio much easier.
We can create breakpoints and inspect the value of variables. We can reset values on-the-fly and even skip entire blocks of code as we step through the code in debug mode. We have the capability to put a condition on the breakpoint so that it will break into the code only if the condition is met. For example, we can decide that we want to break execution and pass control back to Visual Studio only if the value of a variable is greater than 500. To do this, we simply need to set the breakpoint as normal by either pressing F9 on the line in question or clicking inside the gutter. Right-clicking the actual breakpoint circle and selecting Condition in the context menu brings up the dialog box shown in Figure 7.2. There we can set a condition expression and then break if the condition is true or the value has changed.
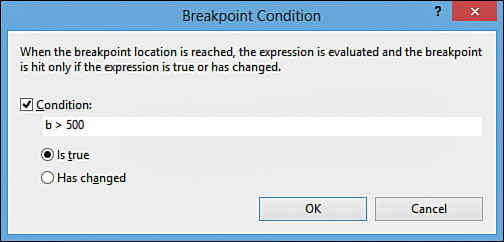
Figure 7.2. Visual Studio can break execution when a certain condition is met.
When debugging hybrid apps—apps written in JavaScript and consuming WinRT components written in other languages—we need to do script debugging separately from native/managed debugging. Native/managed debugging can be done during the same session, but debugging JavaScript must be done separately. The debugger attaches to the JavaScript code by default. To debug the Native C++ code or the Managed C#/VB code, we must select Mixed (Managed and Native) from the Debugger Type list on the Debugging property page of the app project.
Figure 7.3 shows different inspectors in a scratch pad throwaway project that was created. All the important code appears in the screenshot:
var a = "400";
var i;
for (i = 0; i < 600; i++) {
var b = a - i + (a * 2);
storeValue(b);
}
var storage = [];
function storeValue(val) {
storage.push(val);
}
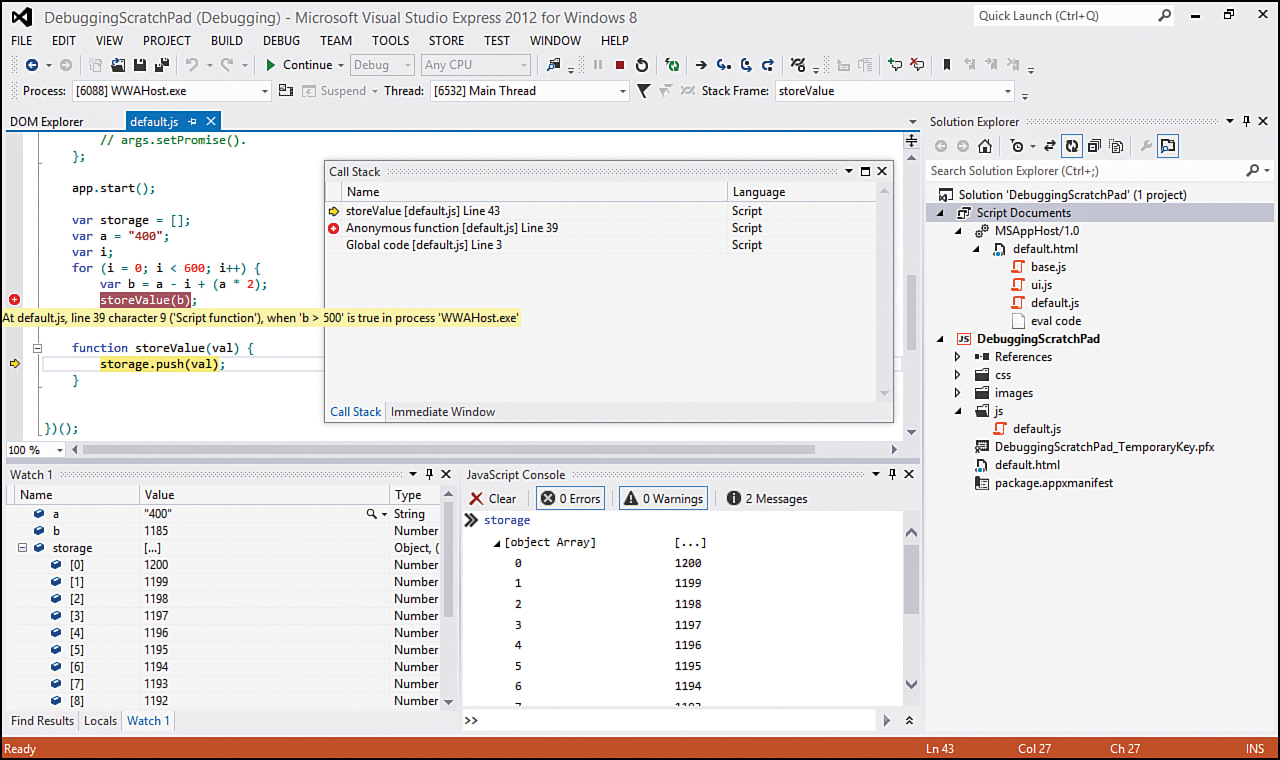
Figure 7.3. With Visual Studio, we can see a Watch window, a Call Stack window, and a JavaScript Console window, as well as step into and out of functions when debugging apps.
The code itself doesn’t serve any purpose, other than to provide something to debug. The breakpoint created is a conditional breakpoint that breaks only when b > 500. In this example, the first value of b is 1200, so it breaks into the debugger immediately. Visual Studio enables us to step into a function by pressing F11 or selecting the ToolTip highlighted along with the ToolTip being displayed in the top toolbar. The next button or pressing F10 enables us to step over a function. The last blue arrow icon enables us to step out of the function; it can also be invoked by pressing Shift+F11. Stepping over a function (F10) enables us to execute a function without actually stepping through each line of code in the function. Stepping into a function drills into the function and enables us to step through each line of code inside the function. In Figure 7.3, we have stepped into the storeValue function from the breakpoint we set. Finally, if we don’t want to continue to step through a function line-by-line, we can step out of the function by pressing Shift+F11.
The next window we can see in Figure 7.3 is the Call Stack window. This window is typically beside the JavaScript Console window. We have pulled it out in this figure to simplify the screenshot. The Call Stack window displays each function that has been called to get to the line of code that is currently being examined. The global code being executed from default.js calls an anonymous function, which then calls the storeValue function. Having this information can be helpful in seeing the path the code took to the point at which an error occurred.
At the bottom left of Figure 7.3 is the Watch window, which is populated manually. The Locals window displays all variables that are currently in scope. For the Watch window, the variables a, b, and storage were explicitly added. The storage array is expanded so that we can see each element of the array.
Debugging Using the JavaScript Console
The last item in Figure 7.3 is the JavaScript Console window, at the bottom right. This console window enables us to execute JavaScript code while our application is running. We can execute JavaScript while the app execution is stopped or even while the app is actively running. This can be beneficial to do some debugging on-the-fly.
Inside the Console, we can probe objects and values at runtime to see what is happening with each. In this example, the variable storage was simply typed into the console window. After Enter was pressed, the Console executed the statement and provided the contents of the storage variable. Instead of just printing everything to the window, it printed the [object Array] and also provided a way for it to be expanded. This way, we can easily expand and collapse objects we examine in the Console window.
The JavaScript Console window supports both single-line and multiline input. To toggle the input prompt, press Ctrl+Alt+M.
Besides probing objects and values, we can actually inject items directly into a running app. For example, we can execute the following code inside the JavaScript Console window while an app is running and immediately see the running app update with what we just executed:
var d = document.createElement("div");
d.innerText = "Hello, from the Console Window...";
document.querySelector("body").appendChild(d);
Figure 7.4 shows the results of the app, along with the JavaScript Console window superimposed (using Paint.NET) on the Windows Store app. We were able to create a new div element and set the inner text of that div. Finally, we appended the div to the bottom of the body element in the DOM. The app was running when this code was executed. This enabled us to quickly iterate and try different things while the app is running, as well as inspect and even modify objects or values. The JavaScript Console window is a handy and powerful tool when it comes to debugging JavaScript apps.
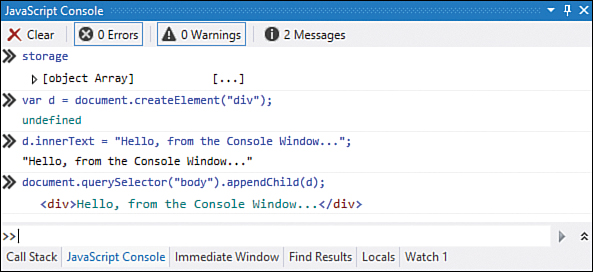
Figure 7.4. The JavaScript Console enables us to inspect and modify objects and values while the app is running. This figure shows how to inject a new div into the DOM.
Debugging Asynchronous Functions and Promises
Hour 1 explained promises, which provide a great pattern for asynchronous programming in JavaScript. When using the proper pattern, error handling becomes more simplistic. As discussed during Hour 1, we can use the following pattern, which provides a single error handler in the done method:
//an async call
oneAsync(data)
.then(function (data2) {
//another async call
return twoAsync(data2);
})
.then(function (data3) {
//another async call
return threeAsync(data3);
})
.done(function (finalData) {
//last call
finish(finalData);
},
function (error) {
console.log("ERROR: " + error);
});
Sometimes we need to debug an error thrown by an asynchronous method in the Windows Runtime. It might not be obvious that an asynchronous function was even called because it could have happened in the call stack. When an error such as this occurs, the JavaScript Error object contains two properties, Error.asyncOpType and Error.asyncOpSource. The Error.asyncOpSource.originatingCall property displays the call in the code that started the asynchronous operation. The properties can be used to find the name of the asynchronous function and the part of the code that caused the asynchronous call. More information can be found at http://msdn.microsoft.com/en-us/library/windows/apps/hh994690.
Remote Debugging
Visual Studio enables us to run an app on a remote machine and also debug an app running on a remote machine. This can be handy when trying to see how the app functions on a different form factor. Standalone tools enable us to easily install and debug Windows Store apps running on a machine without Visual Studio 2012. We do not discuss remote debugging in this book, but the upcoming “Further Exploration” section includes sources for more information.
Securing Apps
After squashing any bugs in the code, the next hurdle to overcome is securing our apps. Fortunately, Windows 8 has been designed with security in mind. Creating secure applications is easy if we follow some best practices. The elements of a secure Windows Store app are as follows:
• Segregates untrusted content from trusted content where possible
• Validates untrusted data to identify and remove code
• Protects customer data with secure storage methods
• Ensures the privacy and integrity of networked data using SSL
Most apps work with data of some sort. If the data didn’t come from within the app itself, it cannot be trusted. Even if we are obtaining data from our own server through a web service, we need to treat the data as untrusted because data could have been injected during transit. In addition to segregating trusted data from untrusted data, we must sanitize any untrusted data before working with it. This sanitization process includes removing any potentially malicious JavaScript code that is intermingled with our data.
Our apps must protect sensitive data. Using SSL is a must when sending data back and forth to remote servers. Many attack tools enable people to sniff and even modify data that is not sent over a secure connection. We can force all connections to be made over HTTPS by adding the following meta element to our page:
<meta name="ms-https-connections-only" value="true"/>
If the previous meta tag is present and a non-HTTPS navigation occurs, an error is thrown to protect the user. Windows 8 provides support for private certificate bundling with an application package. This means that a Certificate Authority certificate does not need to be purchased if one isn’t already set up.
We can restrict the domains our app navigates to inside the application package. We can explicitly set in that manifest file the exact domains our app can retrieve data from. This way, if the app executes any malicious code and tries to connect to another server, the request fails.
During Hour 2, “Trying Out File | New | Project,” we discussed the different security contexts within a Windows Store app. Rereading the section “Navigating to Content in Any Location” might be beneficial at this point. We discussed in Hour 2 how the web context and local context are separate but can communicate with each other. We discussed how an iframe can be decorated with the sandbox attribute to make it even more restrictive for when we do not trust the content that will be displayed within the iframe.
With the information we covered during Hour 2, we now can create a demo app that utilizes both the local context and the web context and sends data across the boundaries.
Try It Yourself: Creating a Naïve App That Includes the Local Context and Web Context
1. Create a new Blank App project called ContextExample.
2. Inside default.html, add the following iframe elements to the end of the body element and assign an id to the p element called content:
<p id="content">Content goes here</p>
<iframe id="localContext" src="ms-appx:///localcontext.html"></iframe>
<iframe id="webContext" src="ms-appx-web:///webcontext.html"></iframe>
3. As discussed during Hour 2, we have two contexts available. We can force content that is bundled in our app to be treated as if it were coming from the web. This is done by setting the protocol to ms-appx-web:// instead of ms-appx://. Again, the three forward slashes are a shortcut to get to the root of the app package instead of having to enter the app package id.
4. Now we can create the localcontext.html file directly in the root of our solution. The contents of localcontext.html are as follows:
<!DOCTYPE html>
<html>
<head>
<title></title>
<script src="/js/localcontext.js"></script>
</head>
<body>
<p>This content is the local context.</p>
<p>Data set to Local Storage: <span id="lcData"></span></p>
</body>
</html>
5. Similarly, we can create the webcontext.html file directly in the root of our solution. The contents of webcontext.html are as follows:
<!DOCTYPE html>
<html>
<head>
<title></title>
<script src="/js/webcontext.js"></script>
</head>
<body>
<p>This content is in the web context.</p>
<p>Data from local storage: <span id="wcData"></span></p>
</body>
</html>
6. Next, we can create the localcontext.js file under the /js subfolder. The JavaScript in the file appears here:
(function () {
"use strict";
//we obtained this data from somewhere -- maybe a database
//maybe from some service over the interwebs
var data = "Data set in <b>local context</b>";
addEventListener("DOMContentLoaded",
function (evt) {
var lcData = document.getElementById("lcData");
lcData.innerHTML = data;
var target = "ms-appx://" +
Windows.ApplicationModel.Package.current.id.name;
window.parent.window.postMessage(data, target);
}
, false);
})();
7. We are simulating getting the data from some outside source. We are simply hardcoding it to some text that is bolded. This is modified later to inject some bad script to see how our naïve app holds up. Next, we hook up an event for when the content is loaded. When the page is loaded, we set div lcData to contain the data that was just “obtained.” Then we send this data in a message to our app; we send it to our local context by using the ms-appx:// protocol. We are using the WinRT ApplicationModel namespace to get our current package id name. This defaults to a globally unique identifier (Guid) value, but it can be changed in the appxmanifest package file under the Packaging tab. The post message simply sends the default page the data that was “obtained” by getting its own iframe window’s parent (default) and then the window object of the default page. This was discussed during Hour 2, in the section “Communicating Between Our Local Context and web Context.”
8. We can add an event listener to our default.js file, which is always in local context. It listens for the message event we just kicked off in the localcontext.js file. The following event handler can be added right after the app.start(); call in default.js:
//listen for a message
window.addEventListener("message", function (evt) {
//now that we have received the message we are going to
//turn around and send it to the web context
var target = "ms-appx-web://" +
Windows.ApplicationModel.Package.current.id.name;
//get the message data passed to us
var data = evt.data;
var webContext = document.getElementById("webContext");
//call postMessage on the webContext iFrame
webContext.contentWindow.postMessage(data, target);
var content = document.getElementById("content");
content.innerHTML = data;
}, false);
9. When we get a message, we turn around and send it to the webContext iframe. We set the target to use the ms-appx-web:// protocol. We store the data being passed to us from the event in a local data variable. Then we get the webContext iframe element and post a message to that iframe window.
10. Next, we can create the webcontext.js file under the /js subfolder. The JavaScript in the file appears here:
(function () {
"use strict";
window.addEventListener("message",
function (evt) {
var wcData = document.getElementById("wcData");
wcData.innerHTML = evt.data;
}, false);
})();
11. Our web context iframe also has an event handler for the message event. When the default window posts a message to the web context, we receive it and then set the wcData element’s innerHTML to the data that was passed to us.
12. After changing the style to light in default.html, we can run this app to see if it is functioning as we expect. Figure 7.5 shows the results. Even though it is functional and doing what we want, the app is very insecure.
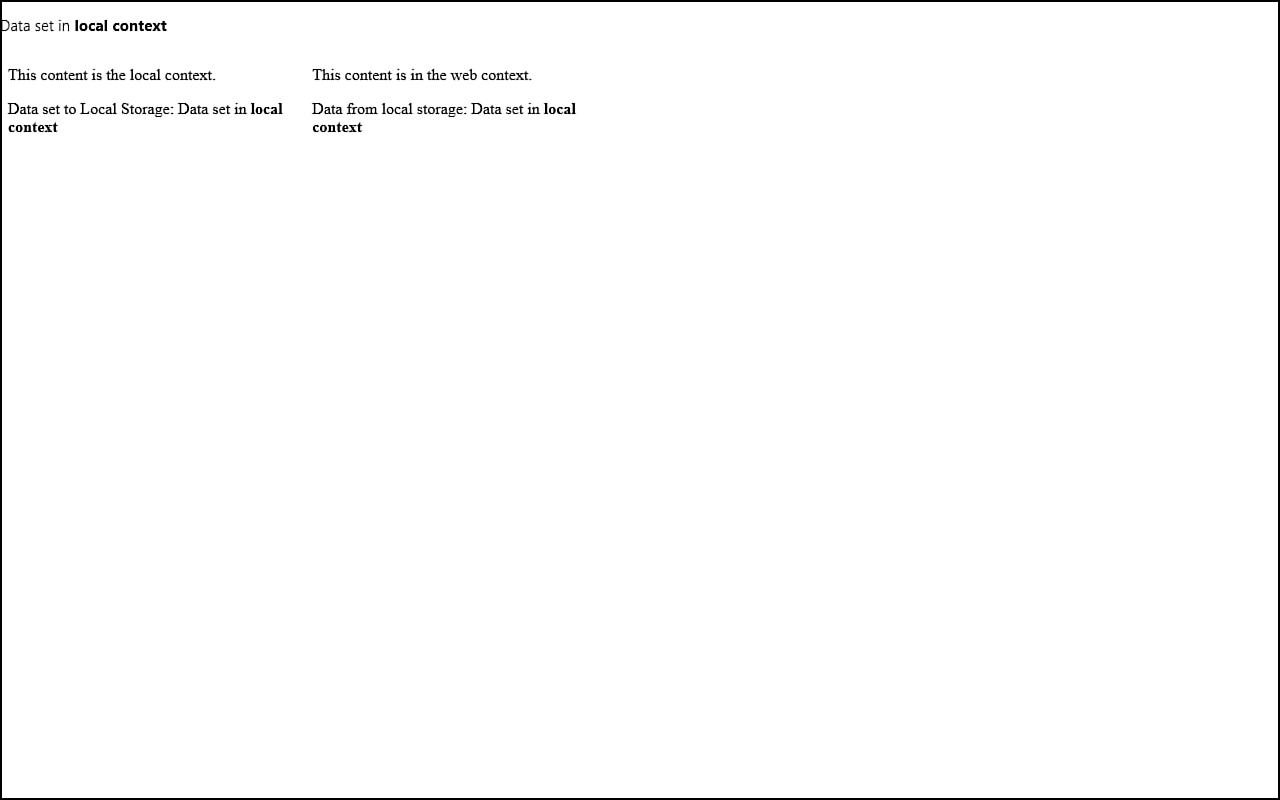
Figure 7.5. The app is functioning as we expect. The data is being passed to each context and then is displayed, but it is far from secure.
Checking the Security of the Demo Project
At this point, we have added two iframe elements to our local context default page. One iframe is also in local context, and the other is in the more restricted web context. The local context iframe obtains data, writes it to a div, and then posts a message to the default page containing the same data. The default page listens for the message event and retrieves the data posted. It then displays the data on the screen and also posts a message containing the data to the web context iframe we created. Finally, the web context iframe displays the data as well. We could say “Ship it!”, but we had better take a closer look at what is happening and check to see what happens if we receive some malicious data.
Everywhere we displayed the data on the screen, we used the innerHTML property of the element so that we could see the data “Data set in local context” with the markup that made local context bold. If we didn’t need to pass the markup inside the message, we would have changed all three innerHTML statements to innerText (see Figure 7.6).
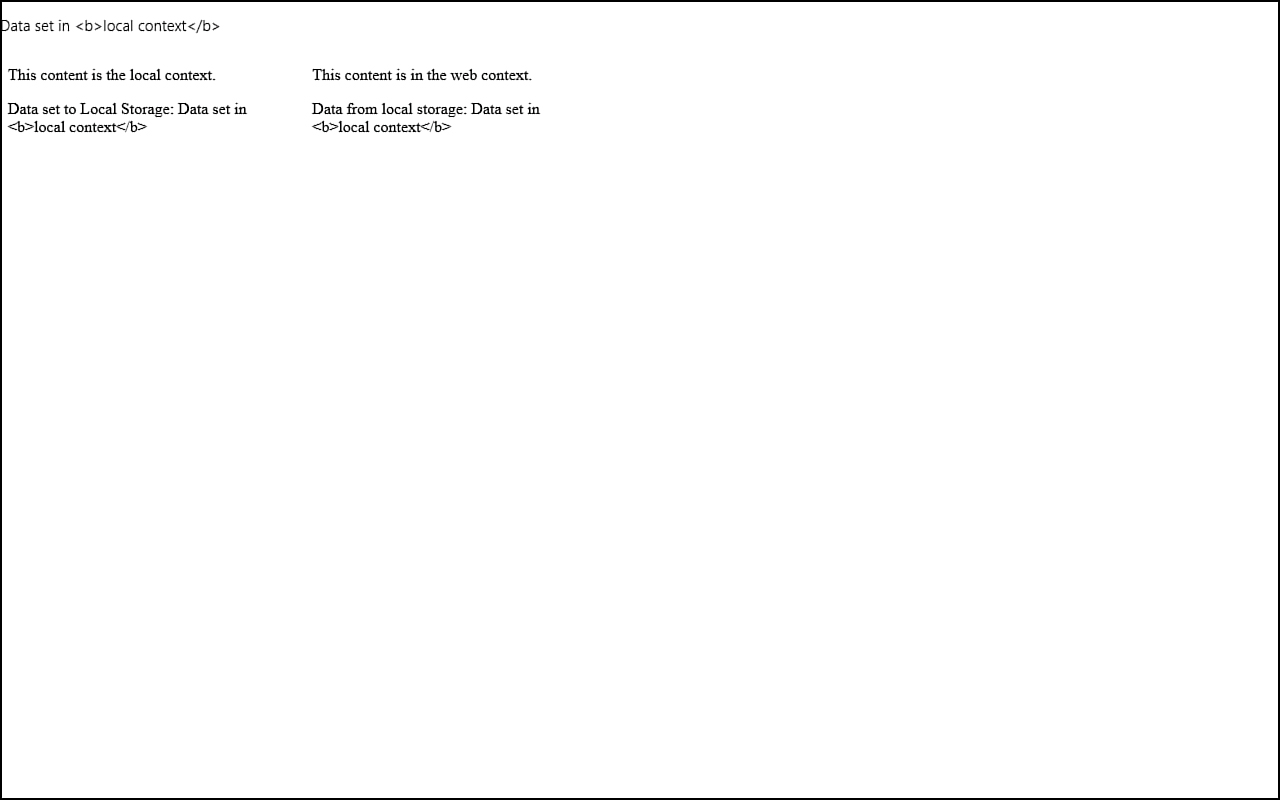
Figure 7.6. Replacing innerHTML with innerText enables us to keep any bogus data from being injected into our page. However, this might not meet the functionality needs of the program: We might need to display HTML.
Although this keeps any bad scripts from being injected into our app, we also lose the functionality of not being able to display HTML markup in the data on our page. We can change the innerText properties back to innerHTML because our requirement is to display the markup.
To demonstrate the issue, let’s replace the declaration of the data variable in localcontext.js from
var data = "Data set in <b>local context</b>";
to
//bad code was injected into the data
var data = "<span onmouseover='(function (event) { " +
"var div = document.createElement("div");" +
"div.innerText = "Hacked!!!"; " +
"div.style.width = "100%"; div.style.height = "100%"; " +
"div.style.backgroundColor = "#F00"; " +
"div.style.fontSize = "120px"; " +
"document.getElementsByTagName("body")[0].innerText = ""; " +
"document.getElementsByTagName("body")[0].appendChild(div); " +
"})()'>Data set in <b>local context</b></span>";
We are simulating that we retrieved this data and that, at some point before it got to our app, malicious JavaScript was injected into the data. This particular script simply creates a div element and styles it so that it takes up the entire display area. It sets the font size to a large 120 pixels and sets the background color to a scary red. Finally, the word “Hacked!!!” is the content of the div. The script itself thus isn’t really doing anything to our app or the system, but if a hacker could inject this code into our app, he could inject much more malicious code to gain access to a user’s information.
After updating our app, if we run it now, we will get a JavaScript error in our local context code. Windows helps by throwing an exception if it sees a script injection attempt. This is good, in the sense that the script was not able to run in our local context, but it is also bad, in that our app just crashed because we didn’t sanitize the data we received before displaying it on our page. Figure 7.7 shows the result.
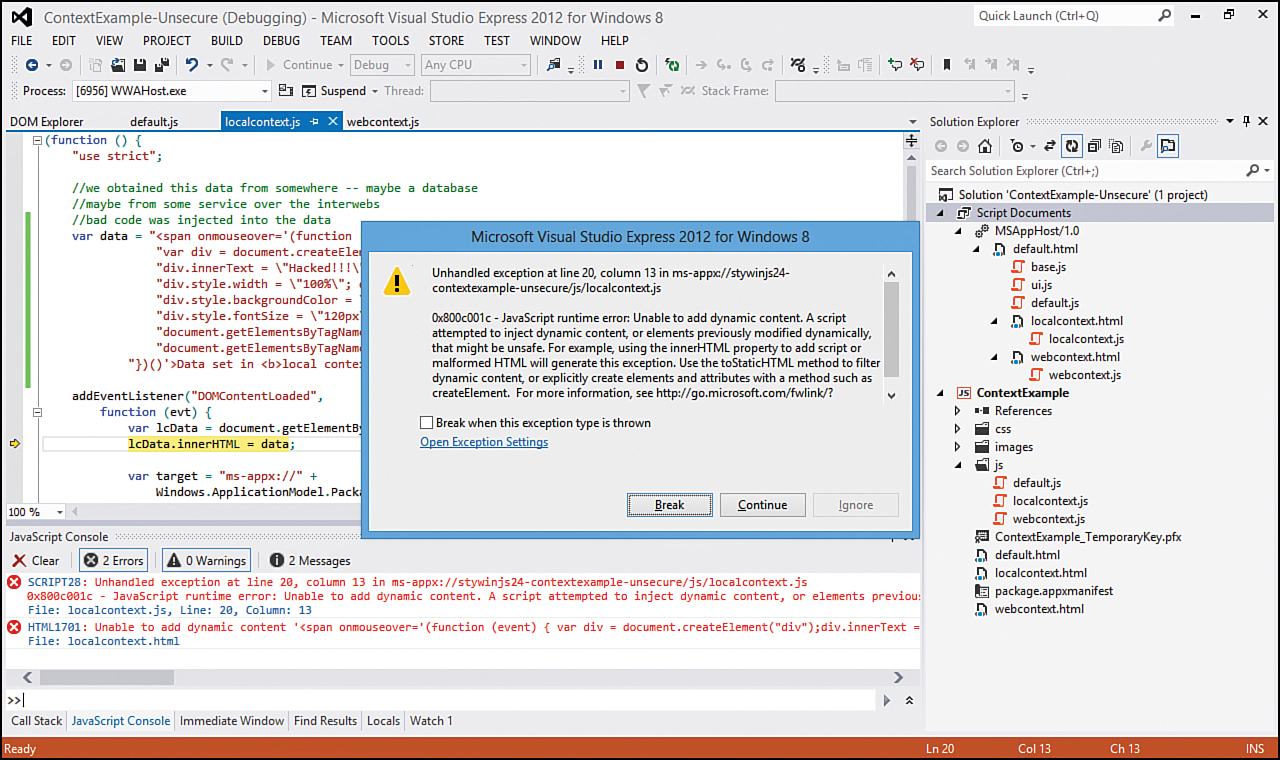
Figure 7.7. Windows helps when possible by throwing exceptions when it thinks a script injection occurred.
The error is helpful because it tells us this information:
0x800c001c—JavaScript runtime error: Unable to add dynamic content. A script attempted to inject dynamic content, or elements previously modified dynamically, that might be unsafe. For example, using the innerHTML property to add script or malformed HTML will generate this exception. Use the toStaticHTML method to filter dynamic content, or explicitly create elements and attributes with a method such as createElement. For more information, see http://go.microsoft.com/fwlink/?LinkID=247104.
Securing the Demo Project
We discussed the toStaticHTML function during Hour 2 in the section “Running in Local Context.” We want to utilize toStaticHTML in our case because we want all the rich HTML markup in the data being sent to us, but we do not want any scripts in the data. We can thus wrap the data in a call to window.toStaticHTML and change the code to this:
lcData.innerHTML = window.toStaticHTML(data);
This strips out any script and leaves the HTML markup intact. If we run our app again, we are greeted with the same exception message, but this time it comes from our default page, which is also in local context. We can fix that problem by replacing the line of code in default.js to this:
content.innerHTML = window.toStaticHTML(data);
Now when we run our app, it runs. It looks like everything is okay. But it isn’t. If we hover our mouse over the span, we can see that the script is executed and our web context has been hacked. Fortunately, this isn’t as bad as if the local context had been compromised, but it is still very bad. Windows does not throw an exception when we try to inject script into a web context because that is a pretty common scenario. We have to understand how any data we are using in our app will be handled.
We can secure our web context as well by changing the code to this:
wcData.innerHTML = window.toStaticHTML(evt.data);
At this point, our code is secure. But sometimes we want to dynamically bring in script from another source. In such a case, it is critical that we scrub the data. Microsoft provides a way for us to override this behavior, but it really opens up the app for an attack if we don’t scrub the scripts being passed in. We can bypass the automatic check Windows does for us in the local context is by wrapping code that is a security risk inside MSApp.execUnsafeLocalFunction:
MSApp.execUnsafeLocalFunction(function () {
var unsafeContent = document.getElementById("content");
unsafeContent.innerHTML = data;
});
Adding that code to the bottom of our default.js file we would hand over the entire app to the attacker (see Figure 7.8).

Figure 7.8. If we override the security measures, Windows can’t help us.
In general, if HTML isn’t needed, innerText should be used instead of innerHTML or comparable ways of setting data. If HTML is needed but scripts aren’t, window.toStaticHTML should be used. If both HTML and scripts are needed, sanitizing the scripts is vital. The execUnsafeLocalFunction is helpful when we want to use a library that generates markup.
The following APIs operate on markup and script and are automatically validated with the engine for window.toStaticHTML:innerHTMLouterHTMLinsertAdjacentHTML
document.write
document.writelnDOMParserpasteHTML
Each of these APIs throws an exception inside the local context. The following script sinks are not filtered and do not throw an exception:evalexecScriptsetTimeoutsetInterval
function
MSApp.execUnsafeLocalFunction
The script sinks that are not filtered should be called only on trusted content. Trusted content is only the content that is hard-coded or specifically included in the app. Everything else is untrusted. In general, if a doubt ever arises over whether the content is trusted, consider it untrusted.
When dealing with untrusted data, we can either make the data static with createTextNode or innerText, or we can filter the dynamic content using window.toStaticHTML. If we pass JSON data to our app from an external source, we should never use the eval function to parse the data. This actually executes the object, and if any JavaScript were injected in the data stream, we would get hit. Instead, we need to use the JSON.parse function. We must make sure that all data being passed around is being transferred over a secure connection using HTTPS.
Storing Data Securely
We discuss ways to save data locally during Hour 11, “Storing Data Locally.” For this discussion, we talk about ways to keep our user data from prying eyes. With Windows Store apps, we can connect to online services and access the user’s data. We want to make sure that our app doesn’t grant a hacker access to these services. We also want to make sure that we do not store raw or unencrypted data and credentials, in case a compromise does occur. If we store data in clear text, it can lead to private information leaks. Fortunately, Windows has a password vault that we can access in this way:
var passwordVault = new Windows.Security.Credentials.PasswordVault();
The password vault provides a place for us to store small pieces of information, such as a username, password, authentication token for an online service, and other personal information. We can store up to 5KB of data for roaming scenarios or 32KB if we aren’t roaming the data to other machines. We discuss roaming during Hour 11.
This provides an easy way of storing encrypted data. If a security breach occurs, the user data thus isn’t available in clear text and will be much more difficult for the attackers to utilize.
Measuring the Performance of Our Apps
We have discussed how to debug apps and make them more secure. Now we look at performance. Before we write our code, we need to have an end goal to reach. As Stephen Covey stated in his book The 7 Habits of Highly Effective People, we need to “begin with the end in mind.” We have discussed this several times during the course of the foundation hours in this book. From designing our apps so they truly are a Windows Store app, to making sure our animations are being added toward the beginning of the development cycle, to considering security as we write our apps, we need to think about the end goal and what we can do to make our apps look well and perform well.
In real estate, they say what matters is location, location, location. In the performance realm, what really matters is to measure, measure, measure. How else can we know whether we are meeting our goals if we do not take the time to measure along the way?
The 80–20 Rule
More than 100 years ago, Vilfredo Pareto, an Italian economist, made the statement that 80% of Italy’s wealth was distributed among only 20% of the people. He observed the same in other countries’ economies as well. Variations of this 80–20 Rule abound: We’ve heard statements such as “Twenty percent of the people do 80% of the work.” Successful leaders spend 80% of their time cultivating 20% of their people. Understanding exactly why this principle works is difficult, but it does work. The same is true when it comes to performance of our applications: Twenty percent of the code needs optimization because it is the most critical to the overall performance of the application. Because 20% of our code will do 80% of the work, this makes sense.
As we discuss performance measurement in this chapter, keep in mind that we need to be concerned about performance as we write our code, but we should not get bogged down and try to perform micro-optimizations too early. Sir Tony Hoare is famous for the often-quoted saying, “Premature optimization is the root of all evil.” Most of the time when this quote is used, it is suggested that performance measurement is not important. However, the opposite is true: Nothing is worse than coming to the end of a software development cycle and realizing that the app is not performing well.
When we develop any app, we need to avoid falling into the trap of thinking that optimization is the root of all evil. It is not. This works a lot like people misquoting the Bible, saying, “Money is the root of all evil.” Money is not the root of all evil; the love of money is the root of all evil. Likewise, in software development, optimization is not the root of all evil; premature optimization is the root of all evil.
So at what point in the development life cycle is it safe to be concerned about performance? At one extreme, critics say that “premature” refers to anything before the end of the development cycle. Others fall into the trap of doing micro-optimizations using microbenchmark testing before designing their application. Of course, the ideal time to optimize code is somewhere between these two extremes.
The key really is measurement. We do not know what needs to be optimized unless we measure. There is no reason to try to make a particular function blazing fast if it is called only once when the application starts. Of course, if the load time is too long, we would want to take a look at what is happening—and that method might not be one we were concerned about to begin with. The point is, we do not need to assume that the function needs optimization until we measure and see that it is causing a problem.
As we develop any app, we should do performance checks throughout the process to see how we are doing relative to our performance goals. If something is taking some time but we are still within our performance goals, we can make a note of it and ignore it for the present. We might not need to waste time optimizing that part of the code. If during measuring we see that we need to make something perform faster, we can make the changes then. We need to focus on the 20% of the code that needs optimization and pursue it only after measuring it and confirming that it truly is the bottleneck.
Measuring the Performance of Our Apps
Visual Studio includes a profiler we can use with our apps. To utilize this excellent tool, we need to make sure that we are deploying to our local machine. We can press Alt+F2 to start the app and the profiler. Then we put the app through its paces. Finally, when we are done, we press Ctrl+Alt+F2 or click Stop Profiling to stop the profiler and terminate the app.
We can then look at the valuable information the profiler reports about our app. Figure 7.9 shows an example profile report. We can see which functions took the most amount of time and which functions did the most individual work. These handy reports start to tell us what 20% of our app is being utilized 80% of the time.
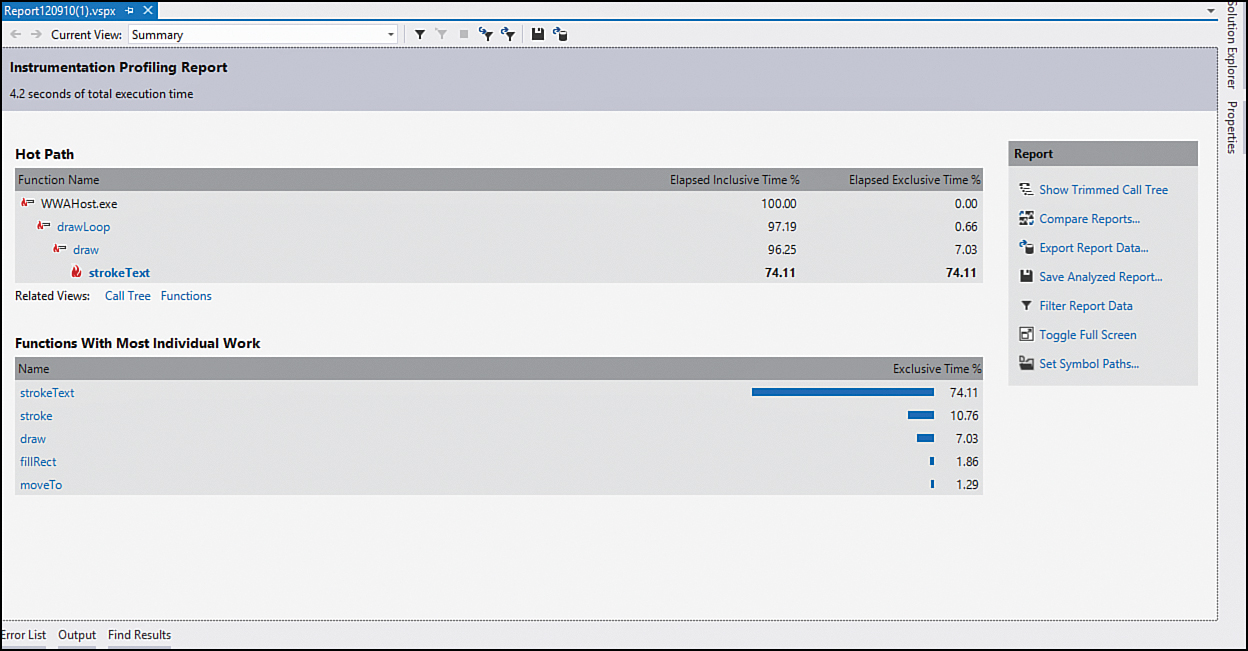
Figure 7.9. Visual Studio includes a profiler that provides excellent information about our app’s performance.
We can even profile our apps again after we make modifications, to see how the two reports compare. We can get great feedback about how many times a function is called and how long it takes to complete. We can see where the code is spending time so we can direct our attention to the functions that are having the most overall impact on performance.
Writing Well-Performing JavaScript
Developers have many things to consider when writing Windows Store apps using JavaScript, HTML, and CSS. We touch on just a few points to watch for. The upcoming section “Further Exploration” includes more resources.
Working with the DOM
One point that might not be immediately obvious is that we should avoid unnecessary interactions with the DOM. The question then becomes, what is avoidable? The key is caching. If we can cache the value of the DOM object we are looking at, we should do so. If we are accessing the DOM inside a nested inner loop and that DOM can be accessed outside the loop altogether, we can store the value of the element in a local variable and reference that inside the nested inner loop instead of inspecting the DOM element itself every time.
Avoiding Embedded Scripts
Scripts should be written in separate files. Although writing JavaScript inside script tags in the HTML document is perfectly legal, it causes the parser to switch context between the DOM and the JavaScript interpreter. This context switching takes time. A better solution is to load all script at one time.
Declaring Properties in the Object’s Constructor
When working with properties on an object, a best practice is to set all the properties in the constructor of the object instead of adding them to the object after it is initialized. The reason is that the internal JavaScript engine can efficiently access properties if an internal inferred type system can be used. The system can use this type system when the object is created consistently. If we have an object called foo that has a property of min and max, and we are going to use a collection of foo objects but we set only the min property consistently and set the max property on just a few of the items, JavaScript cannot perform the inferred type optimization. Instead, it must perform a dictionary lookup for each property retrieval because each object has a different property makeup.
Prefer Integer Arithmetic
When possible, we should use integer arithmetic. JavaScript does not distinguish between integers and decimals. Integer math is quicker, and if it can infer that the value will be an integer, the engine will use integer math. However, when we need to do division, JavaScript uses slower floating-point operations. We can overcome this by doing a bit Or operation of 0. Bit operations actually modify the bits of the data. They are beyond the scope of this book, but for this performance tip, it is important to know that we can perform a bit Or operation in JavaScript by using the pipe character (|). So if we wanted to put this in practice, we could write the following:
var a = 50;
var b = 10;
var c = (a / b) | 0;
Without the | 0 on the end, the JavaScript engine would do floating point math. Doing a Bit Or (|) operation on the result enables JavaScript to see that the result will always be an integer. Thus, it treats the division as integer division.
Drawing to the Screen No More Than Needed
When writing games, developers commonly draw to the screen 30 or 60 times a second. Sometimes code is written that will draw to the screen more often than the actual display refreshes. This is wasted because the user will never see those frames. When we are actively drawing to the canvas many times a second, we can utilize the requestAnimationFrame function to throttle the number of times our drawing code is actually called, to match our refresh rate on our display. Many examples show setTimeout to draw to the screen. However, this draws to the screen many more times than needed. Instead of using this:
setTimeout(drawFrame, 0);
we should use the following:
requestAnimationFrame(drawFrame);
Using Image Sprites
When drawing an animation to the screen in a game, it is much better to have a single image with multiple cells containing the animation than to have individual images files for each animation. Images are loaded to the GPU, and the GPU would rather have fewer larger images than many smaller images. The context drawImage function enables us to specify portions of an image to draw in one of the overloads. Consider an example:
ctx.drawImage(sprite, offsetX, offsetY, sizeW, sizeH, sX, sY, sizeW, sizeH);
In the previous code example, the sprite is the actual image that has each sprite in the spritesheet. offsetX and offsetY tell the function to move in the source image. So if we had a sprite sheet of six animations on a single row, the offsetX would continue to increase by the width of each cell, whereas the offsetY value would remain at 9. sizeW and sizeH are the width and height of the cell. sX and sY are where we want to put the image on the canvas. (sizeW and sizeH are passed in again because the image could be scaled differently on the canvas. In this case, the width and height are simply the same values of the sprite’s width and height.)
Reducing an App’s Load Time
When our app first loads, we have only 15 seconds to display the screen. After that, Windows terminates the app. It is important that our apps load quickly. To help with this, we should have as much content as possible actually bundled with the app. Pulling everything over the network goes much more slowly than reading from disk. This means that items that can be bundled in our package need to be bundled in our package.
JavaScript is an interpreted language. Typically, browsers load JavaScript files and then process the file into bytecode. The bytecode is a format of JavaScript that the browser can run. The process of converting to bytecode is done for every JavaScript file. Windows 8 does this processing when the app is first installed. This allows the system to perform bytecode caching for JavaScript that is included in the app package. To reap the benefits of bytecode caching, we need to make sure our JavaScript files are UTF8 encoded with a byte-order mark (BOM) and that each JavaScript file is statically referenced in the root of the HTML start page.
Another way we can reduce our app’s load time is by loading only what we need up front. So although we should reference all of the JavaScript files we have inside the default.html page, we can set the ones that aren’t going to be used immediately to deferred loading. This is done by adding the defer attribute to the script element:
<script src='/pages/some/some.js' defer='defer'></script>
Any scripts that are needed to execute for our page to load successfully cannot be decorated with the defer attribute.
Further Exploration
When discussing three big topics such as debugging, security, and performance, it is impossible to cover everything. Each topic itself could take more than an hour to discuss. However, the tips in this hour should help as we continue our app-writing journey.
An excellent resource in the Microsoft documentation that discusses debugging JavaScript Windows Store apps can be found at http://msdn.microsoft.com/en-us/library/windows/apps/6d156cff-36c6-425a-acf8-e1f02d4f7869.
The Remote Tools for Visual Studio 2012 that help us debug our apps on remote machines that do not have Visual Studio installed reside at www.microsoft.com/visualstudio/11/downloads#remote-tools. To get started debugging apps on a remote machine, the following resource is handy: http://msdn.microsoft.com/en-us/library/windows/apps/hh441469.
Some Windows Store apps can benefit from having background tasks. This book mentions background tasks a couple times but devotes no time to them. If background tasks are needed, debugging them most likely will be needed as well. Information on debugging background tasks can be found at http://msdn.microsoft.com/en-us/library/windows/apps/jj542415.
When talking about secure apps, a great resource in the Microsoft documentation can be found at http://msdn.microsoft.com/en-us/library/windows/apps/hh849625. When thinking about context, the following article has information about which WinJS controls have limited or no functionality in a web context: http://msdn.microsoft.com/en-us/library/windows/apps/hh465373.
The only Windows SDK sample of interest for this hour is the Credential Locker Sample. This sample shows how to save data to the PasswordVault so that the data will be encrypted when it is stored.
When it comes to performance, the following article has links to profiling Windows Store apps on the local machine and a remote machine. It also links to the best way to analyze the performance data recorded by the Visual Studio profiling tools: http://msdn.microsoft.com/en-us/library/windows/apps/hh696636.
Writing efficient JavaScript is important when it comes to performance. More information on the topic is located at http://msdn.microsoft.com/en-us/library/windows/apps/hh781219. The following article has more information about reducing the loading time of apps: http://msdn.microsoft.com/en-us/library/windows/apps/hh849088.
Summary
We discussed three important topics this hour. To successfully write apps, we need to be able to debug our code efficiently. We offered some tips that help us debug our code when using Visual Studio. We discussed ways to secure apps and showed how it all centers on sanitizing the inputs to the app. We created a functioning app that passed messages to different security contexts. We then saw that although it worked, it was not secure, and we went through the code and handled the unsecure input. Finally, we discussed ways to optimize the JavaScript code so that the JavaScript engine can make certain optimizations to make the code run faster.
Q&A
Q. Can I debug my app using the Simulator?
A. Yes, apps can easily be debugged regardless of whether they are is deployed locally or through the Simulator.
Q. If I scrub data before I put it into a database, do I still need to treat that data as untrusted and scrub it again when I read it back out of the database?
A. If the only way data can get into the database is through the validation process when it is inserted or updated, then it doesn’t have to be sanitized when it is read back out. However, it is still good practice to do so, in case the database is compromised in some way and malicious data was inserted from another means. It is best to consider even database data untrusted.
Q. Should I sacrifice code readability for performance?
A. Rarely should code readability be sacrificed for performance reasons. Only if a function is within a nested loop that is called many times a second may it be appropriate to lose some readability to make the code perform better. Most of the time, readability need not be sacrificed.
Workshop
Quiz
1. The JavaScript Console window enables us to inject new DOM elements while the app is running. True or false?
2. What setting can make debugging errors that occur in asynchronous easier?
3. As long as the toStaticHTML function is used, no additional sanitation of input is required for the local context. True or false?
4. Loading scripts dynamically causes our apps to load faster. True or false?
Answers
1. True. We can use the JavaScript Console window to inspect objects and values while the app is running. We can even inject new DOM elements or modify current values without having to break out to the debugger.
2. We can turn on first-chance exceptions in Visual Studio to help us debug issues within asynchronous calls.
3. True. In the local context, if malicious content is passed to the toStaticHTML function, only the static HTML markup is applied to the element.
4. False. It is better to declare all the scripts statically so that the scripts can be turned into bytecode and then cached.
Activities
1. In the ContextExample, create a third iframe. The iframe should be in the local context. Have the web context iframe send different data to the newly added local context. The local context needs to display the data on the screen with any HTML elements intact.
2. Pick an existing project, either from this book or from another source, and run it through the Visual Studio profile tools. Then look for ways to improve the performance of the project and run it through the profile tools again. Compare the results produced from each run.