
5 Measuring Global Irradiance
This instrument, as its name (from the Greek, fire, up, a measure) indicates, is intended to measure the heat equivalent of radiation received from or going out toward the complete hemisphere above the plane of the measuring surface.
C. G. Abbot and L. B. Aldrich
The Pyranometer: An Instrument for Measuring Sky Radiation, 1916
5.1 Introduction to Global Horizontal Irradiance Measurements
Global horizontal irradiance (GHI) is the total solar flux available from the hemispheric sky dome that is incident on a horizontal surface. By convention global irradiance implies a hemispheric, 2n steradian, field of view on any surface. GHI is the sum of the solar radiation coming directly from the solar disk, also called the direct normal irradiance (DNI) or “beam irradiance,” which is normal to the rays from the sun, projected (Equation 5.1) onto a horizontal plane and the solar radiation coming from all other directions of the sky dome, or “sky irradiance” (Figure 5.1). The solar radiation coming from all parts of the sky dome other than directly from the sun is called diffuse horizontal irradiance (DHI). Planar surfaces of any orientation receive solar radiation directly from the sun plus diffuse radiation from the sky and reflected radiation from the ground Historically, this has been termed total solar radiation on a tilted surface Those involved with photovoltaic systems refer to this total irradiance as plane of array (POA) irradiance. Studies of the thermal performance of buildings rely on the amount of solar irradiance on various parts of a building envelope and refer to this total irradiance as global irradiance on tilted surfaces Traditionally, the study of nonconcentrating thermal collectors has also relied on global irradiance available to tilted flat plate collectors In this book global horizontal irradiance (GHI) will refer to the total solar irradiance on a horizontal surface. When discussing irradiance on a surface oriented at any angle other than horizontal, the irradiance will be referred to as global tilted irradiance GTI.
Global irradiance is measured by a pyranometer. The root of the word pyrano is derived from the Greek “pyr” meaning fire or heat and “ano” meaning sky Therefore, a pyranometer is a meter for measuring heat from the sky Earlier versions of the pyranometer were referred to as a 180° pyrheliometer, but the terminology was changed to pyranometer to help avoid the confusion with the term pyrheliometer that is used to describe the instrument for measuring the DNI or beam irradiance coming directly from the sun (see Chapter 4).

FIGURE 5.1 Drawing showing the sources of DHI as the DNI passes through the atmosphere. DHI can come from scattering by the constituents of the atmosphere, clouds, and ground-reflected irradiance that is rescattered by the clouds or atmospheric constituents.
As described in Chapter 2, GHI is equal to the DNI projected onto the horizontal surface plus the DHI that is from all other areas of the sky.
where sza is the solar zenith angle of the sun as measured from the vertical (zenith) at the time of interest. Near solar noon, sza is smallest (determined by the location and date), and at sunrise or sunset, sza is 90°. Note that when using angles in the cosine function, most software programs interpret the value in radians instead of degrees For example, one of the most common errors in computing GHI is to use degrees instead of radians when calculating the cosine of the solar zenith angle
On a clear day, the GHI is mainly composed of the DNI projected onto the horizontal surface, and the DHI contribution is often a small fraction of GHI in Equation 5.1. The relationship over a clear day between GHI, DNI, and DHI is illustrated in Figure 5.2. The direct horizontal irradiance is the projection of DNI on a horizontal surface (i e, DNI times the cosine of the solar zenith angle) as shown by the dashed line in Figure 5.2, and this produces the bell-shaped curve seen in time-series plots of GHI. Note that DNI, shown by the dotted gray line, can be greater than GHI, especially in the early morning and late afternoon hours. Depending on the location and season, the DNI can exceed the GHI near solar noon. The cosine of the solar zenith angle is smallest during the morning and evening hours, and the direct horizontal component should always be smaller than GHI, as seen in Figure 5.2.
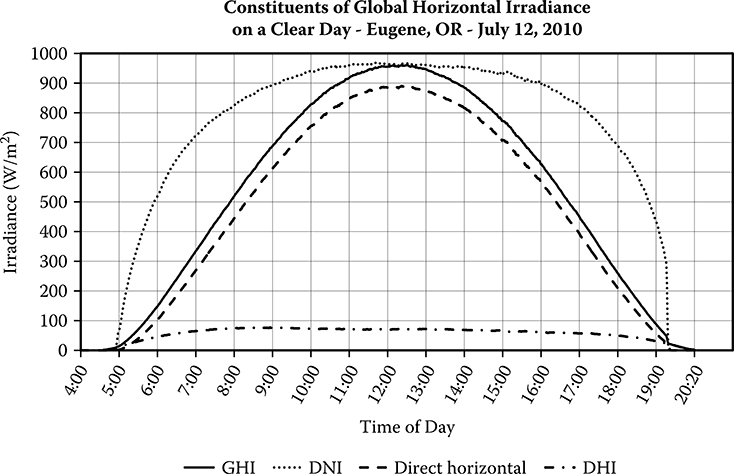
FIGURE 5.2 Plot of 1-minute data for GHI, DNI, and DHI irradiance on a clear day in Eugene, Oregon. GHI is the solid line, the dotted line is DNI, and the dot-dash line is DHI. The dashed line is the DNI projected onto a horizontal surface. Note that DHI is less than 100 Wm–2 and decreases in the afternoon as the water vapor in the atmosphere decreases. At 19:12, the direct sunlight is blocked by an obstruction near the horizon.
As described in Chapter 3, GHI has been measured in many ways during the past 100 years. Abbot and Aldrich (1916) discussed a design for pyranometers. A variety of pyranometers have been developed and used in the field from the Robitzsch actinograph to the more sophisticated Eppley bulb-type pyranometer up to today’s modern designs. A description of these pyranometers from a historical perspective was presented in Chapter 3 This information is useful because a considerable amount of irradiance data has been and continues to be gathered using these historical pyranometers However, pyranometers in wide use today are much more accurate, and they output their data to automated data-logging equipment instead of strip-chart recorders that need to be digitized for analysis
Based on their detector design, three types of pyranometers will be discussed in more detail in this chapter: • •
Black-disk thermopile pyranometers
Black-and-white thermopile pyranometers
Photodiode-based pyranometers
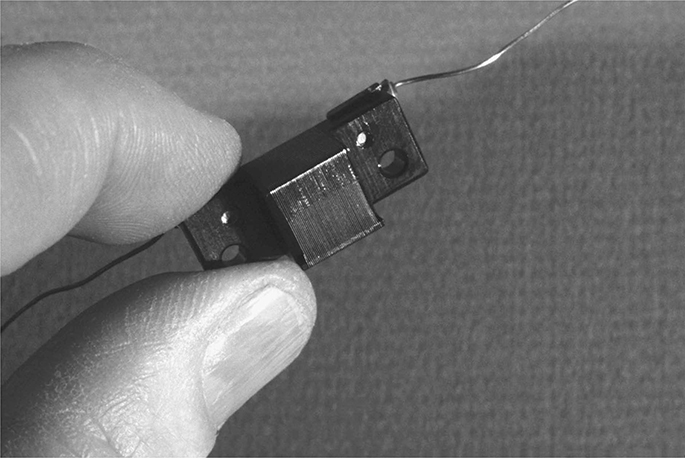
FIGURE 5.3 (See color insert.) Picture of a copper-constantan thermopile manufactured by Eppley Laboratory, Inc. Constantan wire is wrapped around a solid core and then dipped into a copper bath. (Photograph by Warren Gretz, NREL staff photographer.)
The basis for all thermopile radiometers is the thermoelectric effect, the generation of voltage from temperature differences in two dissimilar metals. The thermoelectric effect was discovered in 1821 by Thomas Seebeck, a German physicist. The Seebeck Effect predicts 41 pvolts from junctions of copper and constantan (a copper-nickel alloy) per Kelvin (as determined by T2 - T in Figure 2.16) at room temperature. A number of thermocouples in series form a thermopile. A copper constantan thermopile is shown in Figure 5.3. Constantan wire is wrapped around a solid core and plated with copper. The resulting blackdisk thermopile pyranometer has the hot junction of the thermopile attached to a black-disk that absorbs incoming solar radiation, and the voltage produced is the result of the heat flow between the black-disk and the cold junction that is attached to the body of the pyranometer Some pyranometers have a pair of thermopiles in parallel, called “bucking” thermopiles, with one thermopile being heated by the sun and the other thermopile being shaded from the sun and typically looking at the body of the pyranometer This combination is purported to compensate for the thermal offset experienced by a single thermopile, but the exact details on these instruments are proprietary. The black-and-white or startype pyranometer has thermopiles attached to alternating black (hot junction) and white (cold junction) segments forming the receiver surface, and the difference in voltages produced by the different temperatures of the colored surfaces (i e, thermopiles connected in series) is proportional to the incident radiation (see Figure 5.15 and Figure 5.16).
In 1905, Albert Einstein explained the photoelectric effect as the emission of electrons by a surface, typically a metal, in response to the absorption of photons (i. e., individual quanta of light). The development of photovoltaic (PV) devices, also called solar cells, is based on the photoelectric effect. The photodiode pyranometer uses a solar cell to generate a current across a precision resister to produce a voltage that is proportional to the incident radiation. Each type of pyranometer will be described in more detail in subsections of this chapter
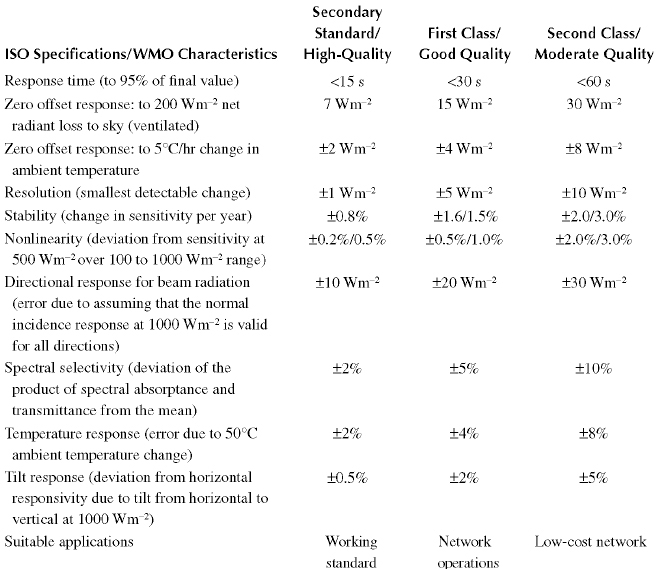
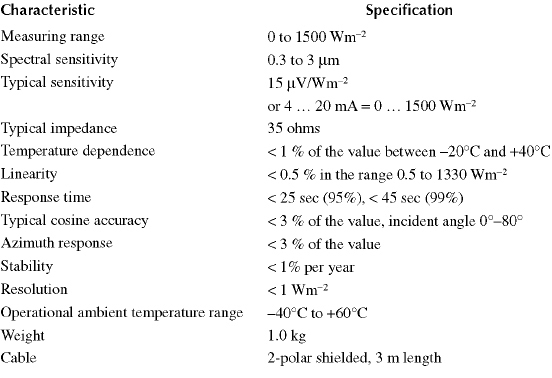
The International Organization for Standardization (ISO) and the World Meteorological Organization (WMO) have undertaken the classification of pyranometers based on their measurement performance characteristics These standards organizations classify pyranometers into three classes: (1) a secondary standard, (2) first class, and (3) second class (Table 5.1). While most of the ISO and WMO standards are identical, the characterizations specified are not the same in all cases When ISO and WMO specifications differ, the ISO specifications will be listed first, followed by a “ / ”, and then the WMO characteristics.
The main difference between the ISO and the WMO standards is in the specification of spectral sensitivity. The WMO standard requires about twice the spectral range that the ISO standard requires. Silicon photodiode-based pyranometers do not respond to solar irradiance with wavelengths beyond 1100 nm, so while some photodiode pyranometers perform better than second-class pyranometers, they technically do not qualify under these WMO or ISO standards. The optical domes for the thermopile pyranometers are used to isolate the thermopile sensor from the environment. The material used in these domes transmits a limited portion of the solar spectrum to the sensing thermopile. Ideally, the spectral transmittance would be the same for all solar irradiance wavelengths (generally 300 to 3000 nm). The domes of several first-class and second-class thermopile pyranometers are made of materials that meet the ISO spectral standards but do not transmit the longer wavelengths and hence do not meet WMO specifications.
TABLE 5.1
Specifications for Pyranometer Classification
|
|
The rational for characterizing the performance of pyranometers in specific categories will become more apparent from the more detailed descriptions found later in this chapter. Four main performance characteristics will help determine the quality of pyranometers:
Deviation from true cosine response of the detector to receive radiation within a 2π steradian field of view
Change in responsivity as a function of ambient temperature
Dependence of pyranometer responsivity on the wavelength of incident solar radiation
Thermal offsets of the pyranometer
The characteristic response of the pyranometers to changes in these factors will be discussed for each of the pyranometer types along with other important factors, such as changes in response as the solar azimuth angle changes These factors all affect the accuracy of pyranometer measurements, and the magnitude of these effects will be used to determine the uncertainty in the irradiance values obtained using the instrument The specifications are one way to differentiate between the capabilities of each pyranometer and to provide guidance in matching the application’s particular solar radiation measurement requirements with suitable a pyranometer
5.2 Black-Disk Thermopile Pyranometers
Major design features of black-disk thermopile pyranometers are as follows:
A single all-black thermopile measures the heat flow between the blackdisk of the receiver and the body of pyranometer.
Two quartz domes reduce convective losses.
Design minimizes azimuth angle dependence.
GHI and DHI measurements suffer from measureable thermal offsets.
Secondary-standard and first-class instruments use the single black thermopile design Single black-disk thermopile pyranometers measure the heat flow between a black-disk receiver exposed to the incident radiation and the body of the pyranometer. Radiant energy is absorbed by the black receiver that is thermally attached to the “hot junction” of the thermopile, while the “cold junction” is connected to the body of the pyranometer The temperature difference between the hot junction of the thermopile and the cold junction produces a voltage typically on the order of 10 mV for a flux of 1000 Wm–2 incident on the detector. This thermoelectric effect was observed by Seebeck, Peltier, and Thomson (Velmre, 2007; Bunch and Hellemans, 2004). Danish physicist Hans Christian 0rsted helped explain this thermoelectric effect (Velmre, 2007).
The voltage created in the circuit is on the order of several μV per Kelvin difference in temperature. In some pyranometers a copper-constantan thermopile is used because copper-constantan has a relatively large Seebeck coefficient of 41 μV K–1 at room temperature. Many thermocouples are connected in series to form the thermopile that produces a larger, more easily measured output voltage
For accurate solar irradiance measurements, the heat flow should be only between the disk and the body of the pyranometer that has considerable thermal mass compared to the disk and acts as a heat sink Heat losses by other means such as convection, advection, conduction, and radiation reduce the accuracy of the measurements Convection is the movement of heat in a medium such as water or air. An example of convention is using a ceiling fan to circulate warm air near the ceiling of a room to the lower part of the room Advection is the process that transfers heat from a surface to a gas or liquid. An example of advection is when a fan is used to blow air across hot elements in a heater, resulting in the transfer of heat to the air Conduction is the movement of heat in a material An example of conduction is when a spoon is put in a hot cup of coffee and the handle of the spoon becomes hot as heat travels up the spoon Heat is also transferred through electromagnetic radiation An example of radiative heating is microwave heating of water or sunlight heating a solar collector to heat water (see Section 2.12 for more information on thermodynamic fundamentals).
To reduce heat losses by convection and advection from wind blowing across the pyranometer receiver, high-quality pyranometers use two glass domes. One glass dome prevents advective heat losses from wind blowing across the pyranometer receiver being heated by the sun. A second glass dome acts much like a double-pane window to reduce the heat loss with a layer of air between the domes acting as a buffer to further reduce convective heat losses.
Conductive heat losses are reduced by isolating the thermopile hot junction from other areas of the pyranometer. The better the thermal isolation, the slower the heat transfers from the pyranometer’s receiver to unintended heat sinks. Ideally only the heat flow from the receiver disk to the body of the pyranometer should be allowed.
Stopping radiative heat loss from a pyranometer is difficult because an accurate pyranometer should pass all solar radiation through the glass domes, including the near-infrared (NIR) radiation to be measured. Therefore, the best pyranometers have precision-ground glass domes that uniformly transmit irradiance from around 300 nm to 3000 nm. However, the receiver disk that absorbs solar radiation also emits thermal infrared (IR) radiation (wavelengths longer than 3000 nm). The glass domes that allow the IR portion of the solar spectrum to impinge on the receiver disk also allow thermal IR radiation to radiate to the dome and then to the sky; this causes the receiver disk to become cooler as it radiates to the cooler sky This is the basis for the so-called thermal offset found in pyranometers designed with a single black disk (Dutton et al., 2001).
As described previously, thermopile-type pyranometers produce a voltage proportional to the energy flow from the receiver disk to the cold junction or body of the instrument At night, the energy flow reverses as the receiver disk and protective domes cool due to exposure to the cold sky, and a negative output voltage from the thermopile results. During the day, there is a similar heat flow (thermal IR radiation) from the sensor disk to the cooler sky. This path to the sky reduces the energy flow through the thermopile and, hence, reduces the voltage that would be produced otherwise. This radiation to the sky is called the IR radiative loss or thermal offset, resulting in a negative bias in the pyranometer readings (Dutton et al., 2001; Gulbransen, 1978).
Because the effective sky temperature varies with the amount and vertical distribution of clouds, atmospheric water vapor, and aerosol loading, the pyranometer thermal offsets vary with location, time of day, and season, making it difficult to account for this thermal offset. It can range anywhere from zero during foggy conditions to as much as –30 Wm–2 for high-altitude clear-sky conditions, depending on the pyranometer construction The use of ventilators will also affect the thermal offset contributions to uncertainties in pyranometer calibration and field measurement performance
Examples of three black-disk thermopile pyranometers in common use are examined here. The Kipp & Zonen model CM 22 pyranometer (Figure 5.4) is considered a secondary standard. The factory specifications for the CM 22 are given in Table 5.2. The CM 22 is similar to the Kipp & Zonen CM 21 except the CM 22 uses an Infrasil II quartz dome and the CM 21 uses a Schott K5 optical glass dome that transmits a smaller range of the solar spectrum in a less uniform manner. The CM 21 is classified as a first-class pyranometer, and its specifications are also given in Table 5.2. Older versions of the Kipp & Zonen CM 11 and CM 21 pyranometers have domes with nonuniform transmission values at the short-wavelength end of the solar spectrum. The 50% transmission point in the older pyranometers started around 310 nm instead of 285 nm for the current versions of these pyranometers.

FIGURE 5.4 (See color insert.) Picture of Kipp & Zonen CM 22 pyranometers in ventilators at SRRL in Colorado.
TABLE 5.2
Specifications of the Kipp & Zonen CM 22 and CM 21 Pyranometers
|

The Eppley Laboratory, Inc. precision spectral pyranometer (PSP) (Figure 5.5) is considered a first-class pyranometer, and its factory specifications are given in
FIGURE 5.5 Schematic drawing of an Eppley PSP pyranometer. Sun shield represented by the dotted oval.
TABLE 5.3
Specification of an Eppley PSP Pyranometer (First Class)
|
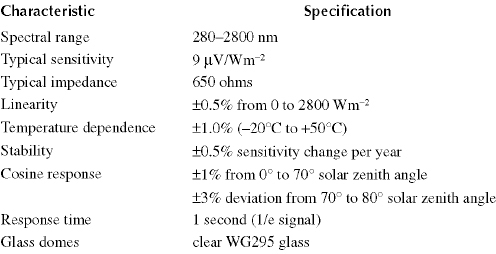
Table 5.3. Note that only some of the factory specifications are described in terms that translate directly into ISO or WMO specifications. In fact, specifications among manufacturers are not uniform. There are many reasons for this diversity in specification, and much of this variance results from the way the manufacturers conduct their standardized tests. Many performance specifications are best determined indoors under controlled conditions Manufacturers also perform outdoor tests to determine the responsivities under conditions experienced in the field. There are many ways to perform tests on pyranometers, and descriptions of factory specifications often relate directly to the testing method that is used Therefore, if manufacturers use different testing methods, it is not always easy to compare specifications because the details in the specifications are different In addition, the performance of various pyranometer models is affected differently by environmental conditions such as air temperature and wind speed The best measurement comparisons are done side by side under conditions likely to be experienced by the pyranometer in the field. Unlike pyrheliometers (described in Chapter 4), no absolute reference pyranometer exists that can be used for calibrations and accurate comparisons. At best a reference GHI value is obtained by projecting the DNI, measured by an absolute cavity radiometer, onto the horizontal surface and adding the diffuse horizontal irradiance obtained by using an offset-corrected secondary standard pyranometer or a second-class black-and-white type pyranometer (because of their minimal thermal offset characteristics) with the direct sun blocked by a shade ball or disk The black-and-white pyranometer will be discussed in Section 5.3.
The following characteristics of a black-disk thermopile pyranometer are discussed in more detail:
Thermal offsets
Nonlinearity
Spectral response
Angle of incidence response
Response degradation over time
Temperature dependence
Ice and snow on dome—ventilator section
An optical anomaly
Care and maintenance
5.2.1 THERMAL OFFSETS
Pyranometer thermal offset is a subtle thermal loss mechanism that can affect the performance of single black detector pyranometers. By design, the black disk is a good absorber of solar radiation as well as a good emitter in the IR portion of the radiation spectrum The body of the pyranometer is generally warmer than the sky Therefore, there is IR radiative transfer from the pyranometer to the sky. The transfer actually consists of several steps with the outer dome of the pyranometer radiating to the sky, the inner dome radiating to the outer dome, and the receiver radiating to the inner dome, lowering its temperature with respect to the body and producing a negative signal (Dutton et al., 2001; Gulbrandsen, 1978; Long, Younkin, and Powell, 2001). Thermal offsets usually vary from minus a few Wm–2 to as much as –20 to –40 Wm–2. During the day, thermal offsets are larger (more negative) than the nighttime values as the ground and the body of the pyranometer are heated by solar radiation (Figure 5.6). This causes the thermal offsets to increase during the day The magnitude of the thermal offset is proportional to the net IR at the time of measurement The net IR is a function of the effective sky and ground temperatures Since the amount of atmospheric precipitable water vapor affects the net IR, and in turn the thermal offset, the offset is related to the station elevation. That is, under cloudless sky conditions, lower thermal offsets can be expected from pyranometers used in Eugene, Oregon, at 150 m (–2 Wm–2 to –10 Wm–2) than the offsets found in measurements made in Golden, Colorado, at 1829 m (–15 Wm–2 to –40 Wm–2). The magnitude of the thermal offsets depends on the difference between the ambient air and sky temperature, and thermal offsets are significantly less during cloudy periods with warmer skies as opposed to clear periods with cooler sky temperatures The body of the black-disk thermopile pyranometer is the cold reference junction and is usually at or near ambient temperature, especially when installed in a ventilator During clear weather, sky temperatures are much colder that ambient surface air temperatures. Because different sites exhibit different ranges of sky temperatures due to elevation and amounts of atmospheric water vapor and aerosols, the thermal offsets will be more severe at some sites than at others The fact that thermal offsets vary from site to site makes it difficult to clearly determine the proper calibration constant of a pyranometer, especially ones that have large thermal offsets. Starting around 2005, some pyranometers have been calibrated to determine both the broadband responsivity and the IR responsivity (Rnet) (Reda et al., 2005).

FIGURE 5.6 Calculated thermal offset for an Eppley PSP pyranometer in Eugene, Oregon, during June 2010. One-minute data for all hours in June 2010 are plotted. Using nighttime readings and pyrgeometer data, the methodology of Younkin and Long (2003) is employed to calculate the thermal offset of the PSP during the day. During cloudy periods there is minimal thermal offset as the sky temperature is similar to the ambient temperature. During clearer weather, the thermal offset reaches its maximum values.
Thermal offsets in pyranometer measurements can most easily be explored with nighttime data. Predominately the negative nighttime values result from thermal offsets The thermal offsets differ depending on whether the pyranometer is ventilated and whether a direct current (DC) or alternating current (AC) motor powers the ventilator. Most ventilators heat the body of the pyranometer exacerbating the thermal offset. For an Eppley PSP with an Eppley ventilator, the thermal offset at night was observed to be –2 to –3 Wm–2 greater, more negative, for pyranometers in ventilators with fans powered by AC motors compared with those powered by DC motors AC motors use more power than DC motors and slightly warm the air.
It is easiest to correlate thermal offsets at night because there is no incoming solar present to heat the receiver and the pyranometer output is expected to be zero. Key to modeling thermal offsets is the use of pyrgeometers from which net IR can be determined from the pyrgeometer thermopile signal Correlations between net IR and thermal offsets, relative humidity, and sky temperature have been developed using nighttime pyranometer values (Younkin and Long, 2003). These correlations can then be used with data gathered during the day to adjust the GHI measurements based on pyrgeometer thermopile signals during the day These correlations are specific to pyranometer and pyrgeometer pairs, and they can be used to produce more accurate measurements of GHI and, in particular, DHI (see Figure 5.6).
Unfortunately, there are a limited number of pyrgeometers paired in the field with pyranometers Some work has been done to estimate the thermal offsets without the pyrgeometer data (Reda et al., 2005; Vignola, Long, and Reda, 2007; Vignola, Long, and Reda, 2008; Vignola, Long, and Reda, 2009), but to date a general meteorological model that can be associated with a pyranometer has not been developed
With thermal offsets changing from site to site, it is very difficult to determine the appropriate pyranometer responsivity without correcting for the thermal offset Systematic errors result if calibration values are obtained from sites where large thermal offsets occur and are then used at locations where the thermal offsets are much less.
Three options are available to address this calibration issue:
Use calibration values determined without consideration of thermal offsets.
Use calibration values determined with mean nighttime offsets subtracted during the day.
Use calibration values determined with thermal offsets corrected.
If one does not have a pyrgeometer and meteorological data necessary to calculate the pyranometer thermal offsets, one should calibrate the instrument and use it at the same location to minimize thermal offset issues.
An alternative that accounts for some of the thermal offsets is to subtract the average nighttime values from the night before and the night after from the daytime values (Dutton et al., 2001). This has been shown to account for roughly half of the thermal offsets during the day (Vignola et al., 2007). If this method is used, the calibration constant should be determined from a calibration that subtracts the nighttime values from daytime measurements In other words, the calibration value used for a pyranometer should be determined in a manner similar to how the pyranometer is used
The best option is if pyrgeometer and other meteorological data are available and one can calculate thermal offsets Then the calibration constant determined with the thermal offsets subtracted should be used
5.2.2 NONLINEARITY
Nonlinearity is the deviation of the radiometer’s responsivity (pV/Wm–2) as the solar irradiance level increases or decreases. The ISO specification for nonlinearity is less than ±0.5% for a first-class instrument. Nonlinearity is defined as the deviation from the responsivity measured at 500 Wm–2 over a range of 100 Wm–2 to 1000 Wm–2. For example, if the measured responsivity at 500 Wm–2 is 8 .00 pV/Wm–2, then the responsivity from 100 Wm–2 to 1000 Wm–2 has to be between 7.96 pV/Wm–2 and 8 .04 pV/Wm–2. Factory specifications for an Eppley PSP indicate a linear response better than ±0.5% from 0 to 2800 Wm–2, whereas Kipp & Zonen models CM 22 and CM 21 claim a linear response better than ±0.25% for irradiances below 1000 Wm–2.
At high levels of solar irradiance, black-disk thermopile pyranometers have a good linear response It is at lower levels of irradiance that the thermopile pyranometers may exhibit nonlinearity problems For example, if a pyranometer exhibits a 20 Wm–2 thermal offset at a solar irradiance of 1000 Wm–2, then its readings are offset by 20/1000, or 2%. If the thermal offset is 20 Wm–2 and the incident irradiance is 100 Wm–2, then the readings are off by 20%.
Consequently, nonlinearity tests are usually performed under indoor laboratory conditions with the instrument and surroundings at a stable (room) temperature Under such conditions, there are no thermal offsets caused by the detector radiating to a colder target A stable lamp with a chopper wheel is used to test for response change with intensity The intensity of light is proportional to the area blocked by the chopper wheel The National Institute of Standards and Technology has developed a more exacting way to test for linearity (see Walker, Saunders, Jackson, and McSparron, 1987). Under laboratory conditions, ISO classification specifies a pyranometer as first class if it deviates from a linear response by less than 0.5%.
5.2.3 SPECTRAL RESPONSE
Pyranometer spectral response is largely determined by the spectral transmission of the material used for the protective and insulating domes and the spectral absorption of the detector coating. Ideally, the pyranometer output should be proportional to the sum of the solar flux across all solar wavelengths. The Kipp & Zonen model CM 22 uses two Infrasil II quartz domes to protect the detector. The transmission of light through the Infrasil II domes changes with wavelength by about 2% from 300 nm to 3000 nm (see Figure 5.7 for transmission through an Infrasil II window that is used on the Eppley normal incidence pyrheliometer [NIP]). The spectral distribution of solar energy changes as sunlight takes a longer path through the atmosphere. The amount of atmosphere through which sunlight passes is called air mass (see Section 12.5.1 for a more detailed discussion of air mass). As air mass increases from 1.5 to 6.0, the percentage of incident solar radiation that is transmitted through each Infrasil II dome increases by ∼0.1% to ∼0.3%. The CM 21 and the PSP use other optical glass whose transmission is less uniform with wavelength. The transmittance of WG295 Schott glass used in the PSP is shown in Figure 5.8. The WG295 glass cuts off some ultraviolet and some IR radiation. Similar transmission properties are seen in the Schott K5 domes.

FIGURE 5.7 Spectral transmission of light through an Infrasil window from 280 nm to 3200 nm. Inset shows transmission from 280 nm to 400 nm. The percent transmission varies from around 89% at 280 nm to around 92% at 1100 nm to 2600 nm. The transmission drops to 80% around 2950 nm and returns to around 90% around 3200 nm. Measurements were made by Fuding Lin at the University of Oregon Support Network for Research and Innovation in Solar Energy.

FIGURE 5.8 Spectral transmission of light through a Schott WG295 glass window from factor specifications. Inset shows spectral transmission form 260 nm to 400 nm.
5.2.4 ANGLE OF INCIDENCE RESPONSE
Ideally, the responsivity of a pyranometer to the solar radiation from any direction within its hemispherical field of view, 2n steradians, is independent of incidence angle. Lambert’s cosine law states that the irradiance received at a surface should be proportional to the cosine of the incident angle. Therefore, a pyranometer with an ideal angular response, or Lambertian response, would respond to incident radiation in accordance with Lambert’s cosine law. When the pyranometer measurements are not Lambertian the instrument’s responsivity is said to vary with incident angle. It is difficult, if not impossible, to produce a pyranometer with a perfect angular response, especially for a pyranometer with a relatively large receiver that is covered by glass domes. In most literature and in this book, angular response is referred to as cosine response and a perfect or Lambertian angular response is called a true angular or cosine response. When describing an instrument’s angular response, the comparison is normalized against the true angular response to emphasize the difference from a perfect response. By making the comparison against an ideal Lambertian response, deviations of a few percent become easier to detect. Optical leveling of the receiving disk is very important, especially at large solar zenith angles where small differences in the angle of incidence can translate into large errors in angular response. The spirit levels used to orient a pyranometer are not always consistent with the optical plane defined by the detector surface. Imperfections in the glass domes and even refraction of light as it passes through the domes can cause some deviations from true cosine (Lambertian) response. For solar irradiance measurements, the sun is considered an idealized point source with the collimated light coming from a given direction.
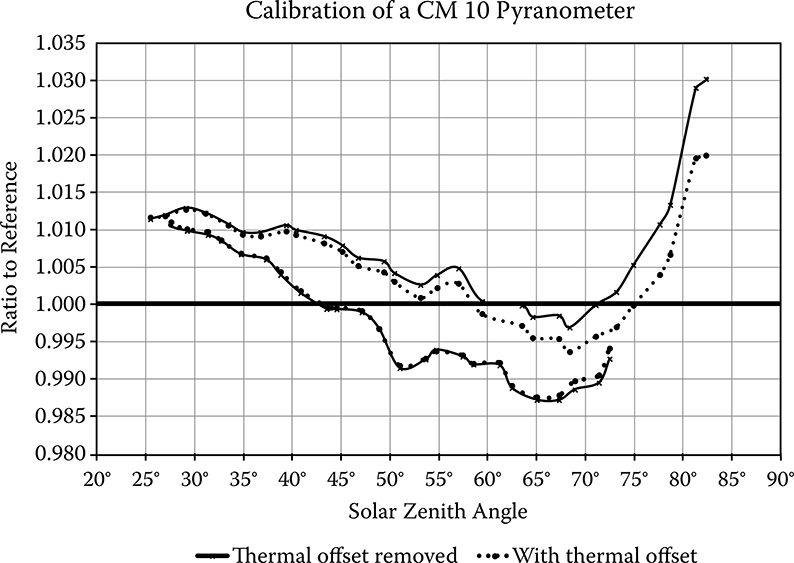
FIGURE 5.9 Cosine response of Kipp & Zonen CM 10 pyranometer. The reference GHI is calculated using the summation technique where the direct-horizontal component, obtained from the DNI by multiplying by the solar zenith angle, is added to the DHI. The DNI is measured using an AHF cavity radiometer and the DHI is measured with a Schenk Star pyranometer mounted on a tracker using a shade ball. The responsivities are shown with and without taking the thermal offset into account (see Section 5.2.1). The results are for morning and afternoon measurements.
Results from a calibration of a Kipp & Zonen CM 10 pyranometer are shown in Figure 5.9. The reference GHI is calculated from the DNI measured with an absolute cavity radiometer (an Eppley automatic Hickey-Friedan [AHF] in this example) projected onto a horizontal surface plus the diffuse irradiance obtained by a pyranometer with minimal thermal offset (a Schenk star or Eppley 8–48 pyranometer) shaded by a shade ball. In this book, the reference GHI is obtained by this method using either an absolute cavity radiometer or a thermopile pyrheliometer for the DNI. The source of the DNI will be referenced for each example. The GHI readings from the CM 10 were divided by the reference GHI measurements and normalized to 1.00 at a solar zenith angle of 45°. During this calibration, there were a limited number of data points near 45° in the afternoon, hence the average at 45° is heavily weighted by the morning data. Since the absolute accuracy of these reference measurements are less than 1%, it will be assumed for these discussions that they are precise; any deviation from the ratio of 1.00 represents deviation from a calibrated instrument with a perfect angular response.
In Figure 5.9, the ratio of the pyranometer output to reference values is plotted against solar zenith angle. While some of the deviation from 1.00 may result from changes in temperature and possibly tilt of the instrument, much of the deviation is associated with a nonperfect Lambertian or cosine response. In Figure 5.9, the correction for thermal offset is up to 0.5%, a small fraction of the deviation from an ideal angular response. Of course, the thermal offset in Eugene is only about –6 Wm–2 due to the amount of atmospheric water vapor.
Understanding the error introduced by imperfect leveling of the pyranometer illustrates the difficulty in obtaining a true Lambertian response. When the sun is at 30° solar zenith angle, a 0.5° error in leveling will change the results by about 0.1%, at 70° angle of incidence it leads to about a 0.6% error in the measurement, and at 80° it leads to a 1.2% error. Therefore, it is important that the pyranometer is leveled at the site and that the platform supporting the pyranometer is securely anchored. It is also prudent to occasionally check the level of the pyranometer as determined by the integral spirit level.
Most of the deviation from true cosine response comes from the detector failing to absorb incident irradiance uniformly at all angles of incidence. The thickness of the glass domes, the variation in the thickness, the concentric alignment of the domes with respect to the receiver disk, the uniformity of the receiver disk coating, the “flatness” of the receiver surface, and optical leveling of the receiver disk within the instrument body all contribute to a non-Lambertian response. Dust or moisture on the dome can significantly contribute to the apparent angular response problem.
Ideally, the receiver should be flat or shaped to give the sensor a better cosine response. One problem that has been observed in a few pyranometers is that the circular receiver disk glued to the thermopile will become deformed and will take on the rectangular shape of the thermopile below. This deformation can be caused during manufacture, by vibrations, or by rough treatment during shipping. If the receiver disk takes on the shape of the underlying thermopile, deviation from a true cosine response becomes pronounced, and the pyranometer should be repaired (see Figure 5.10).
5.2.5 RESPONSE DEGRADATION
The black receiver of the pyranometer is protected from direct contact with the elements but is exposed to global irradiance, and, like paint, the exposure to sunlight, especially ultraviolet (UV) radiation, will change the “color” of the paint and the absorptivity of the receiver over time. In the case of a thermopile pyranometer, the change in detector color is not easily perceived even after many years, but the change in responsivity typically decreases between 0.5 and 1.0% per year. The greater the exposure to sunlight, especially ultraviolet light, the faster the change in responsivity. Wilcox, Myers, Al-Abbadi, and Bin Mahfoodh (2001) showed that the formula used to measure paint aging also works for modeling the change in pyranometer responsivity. Using analyses of clear-sky records and long-term calibration records, Riihimaki and Vignola (2008) confirmed Wilcox et al.’s model and showed this effect continues at a linear rate over the decades that a pyranometer may be in the field.
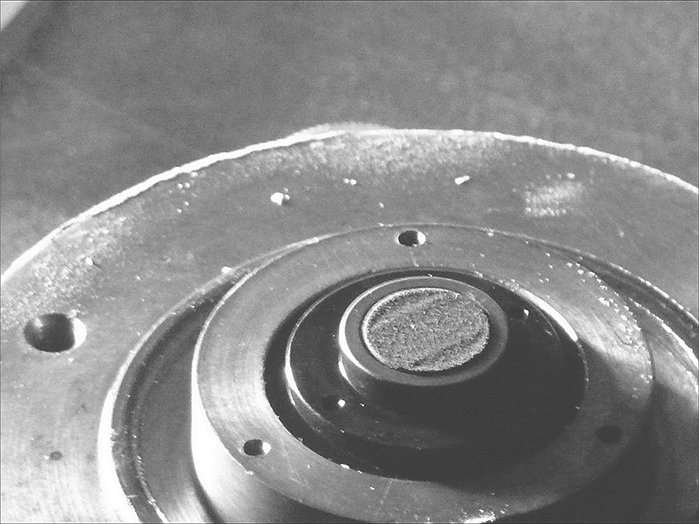
FIGURE 5.10 Figure of an distorted disk on an Eppley PSP pyranometer. The disk should be flat for a good cosine response. This disk has been bent to take on the shape of the thermopile to which the disk is attached.
Reference pyranometers usually have limited exposure to sunlight between calibrations. This greatly reduces the degradation rate of the pyranometer and again confirms the paint-aging hypothesis.
5.2.6 TEMPERATURE DEPENDENCE
All pyranometers exhibit some change in responsivity as ambient temperature changes. Many pyranometer manufacturers provide a temperature response curve for the specific model or model type. Thermopile pyranometers have a temperature dependence even if first-order temperature-compensating circuits are used to minimize the primary temperature effects. However, correcting the temperature response at one temperature will affect the temperature response in a different temperature range. Most first-class pyranometers have a responsivity that changes by less than 1% over the –20°C to 40°C range after temperature compensation circuitry is added. Temperature tests are performed in the laboratory because the responsivity of pyranometers outdoors is dependent on many meteorological variables that are not under the control of those making the test. Examples of the pyranometer temperature dependence are shown in Figure 5.11 for a Kipp & Zonen CM 22 and an Eppley PSP pyranometer.

FIGURE 5.11 Example of the temperature dependence of a Kipp & Zonen CM 22 and an Eppley PSP. These measurements were done in the laboratory under controlled conditions. Each instrument has its own unique temperature dependence. Note that the temperature dependence of both instruments meets the factory specifications.
5.2.7 ICE AND SNOW ON DOME—VENTILATORS
Ventilators are extremely useful for keeping the domes of pyranometers free of moisture, frost, snow, and dust. If obtaining a complete and accurate measurement record is important, a ventilator is a necessary addition for any pyranometer installation.
A ventilator is basically a short cylinder with a fan mounted near the bottom to blow air under the pyranometer shield and across the dome. Three ventilators are shown in Figure 5.12. The ventilator on the left is a standard Eppley model ventilator (VEN) with a clear acrylic plenum surrounding the pyranometer. The ventilator in the middle is a Schenk ventilator, and the ventilator on the right is a Physickalisch-Meteorologisches Observatorium Davos (PMOD) design installed on an Eppley VEN base. The ventilator fans can be AC or DC powered, and some ventilators include a resistive element to heat the air slightly just before it blows across the dome, such as the PMOD and the Schenk ventilators shown in Figure 5.12. This arrangement may be helpful in reducing the temperature difference between the dome and body that is responsible for the infrared losses (thermal offsets) discussed in Section 5.2.1. AC fans generate and dissipate more heat from their motors than DC fans. In conclusion, ventilators can enhance or reduce the thermal offsets experienced by the instrument.
Ventilators usually have a screen beneath the fan to prevent larger debris from being added to the airflow. This screen should be cleaned at least once a year because it can become blocked and hinder the airflow.

FIGURE 5.12 (See color insert.) Three ventilators mounted on a Sci-Tech tracker. Going from right to left, the ventilator on the left is a Swiss PMOD ventilator holding a Kipp & Zonen CM 22 pyranometer. The ventilator is mounted on an Eppley ventilator base so the height of the dome matches the height of the domes of the other instruments. PMOD also makes a base for leveling. The middle ventilator is a Schenk ventilator for Schenk Star pyranometers. The ventilator on the left is an Eppley ventilator holding an Eppley precision infrared radiometer or pyrgeometer.
5.2.8 AN OPTICAL ANOMALY
One anomaly observed with some pyranometers occurs when the sun is at a specific location in the sky. Over a period of about an hour, the irradiance readings first drop and then increase to an anomalously high reading before falling back to normal behavior. This is the result of reflections from the domes that will create a bright spot or “caustic” near the receiver disk. During a specific time of year, this intense spot of light will move across the ring surrounding the disk and illuminate a small portion of the absorbing disk. As the sun moves across the sky, the spot moves off the detector and crosses the metal ring surrounding the detector. When the spot is on the ring, the reading from the pyranometer is low and when the spot is on the detector, the reading can increase by 50% or more. The caustic on an Eppley 8–48 pyranometer is illustrated in Figure 5.13, and Figure 5.14 for a PSP.
Some pyranometers don’t exhibit this effect, while others by the same manufacturer will exhibit this effect at different but specific times of the year at certain times of the day. Dust or film on the dome can cause or enhance this effect. Therefore, it is important to keep the domes as clean as possible. Pyranometers mounted on trackers usually do not exhibit this effect because the angle between the sun and the pyranometer domes never reaches the critical combination of zenith and azimuth angles at which the internal reflections occur. When analyzing pyranometer data to identify problems, one should watch for the occasional clear days that exhibit this anomalous behavior.
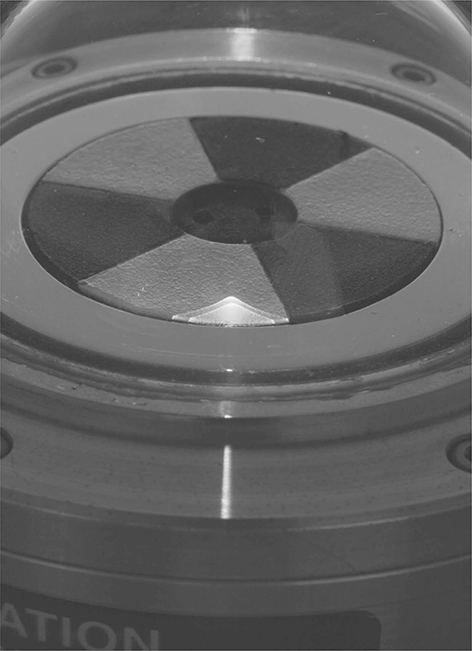
FIGURE 5.13 Photo of a caustic on an Eppley 8–48 pyranometer. Picture is taken in the lab and an image of the light source can be seen in the reflection on the top. The caustic is the array of light on the bottom of the white wedge.
FIGURE 5.14 Photo of the caustic on an Eppley PSP pyranometer. Moisture on the dome focused the light on the receptor disk.
5.3 Black-And-White Pyranometers
Major features of black-and-white pyranometers are as follows:
Use of thermopiles with alternating black and white surfaces
Performance specifications consistent with second-class pyranometers
Responsivity has a measureable temperature dependence
Responsivity varies with azimuth
Responsivity affected by pyranometer tilt
Limited thermal offset
Black-and-white type pyranometers consist of alternating black and white surfaces that are attached to the hot and cold junctions, respectively, of a thermopile. When exposed to solar radiation, the resulting temperature difference between the hot and cold junctions of the thermopile produces a voltage.
5.3.1 CHARACTERISTICS OF BLACK-AND-WHITE PYRANOMETERS
The specifications of the Eppley Laboratory, Inc. model 8–48 (more commonly referred to as a black-and-white pyranometer) (Figure 5.15) and the Schenk Star pyranometer (Figure 5.16) are given in Table 5.4 and Table 5.5, respectively.
Black-and-white pyranometers are classified as second-class pyranometers because the responsivity of the rather large detector surface changes significantly as a function of azimuth angle and tilt. One of the main reasons for this is that their alternating black and white surfaces make them sensitive to the sun’s azimuth position. The responsivity of the pyranometer changes if the sun is directly aligned with a white surface as opposed to being directly aligned with a black surface. This problem can be addressed to some extent by making the surface areas smaller or using other geometric patterns. In addition, if the pyranometer is mounted on a tracker, the pyranometer would always have the same orientation to the sun and thus be less susceptible to azimuth affects.
FIGURE 5.15 Image of Eppley black-and-white type pyranometer.
FIGURE 5.16 Image of Schenk Star type pyranometer.
TABLE 5.4
Eppley Model 8–48 Pyranometer Specifications
|

TABLE 5.5
Schenk Star Pyranometer Specifications
|
Like other pyranometers, black-and-white pyranometers have imperfect angular responses. The receiver tends to be much larger than those found in single black-disk designs, making it more difficult to have a planar surface. The angular response of a Schenk Star type pyranometer is illustrated in Figure 5.17. This particular instrument has an excellent cosine response, increasing by only 2% from a solar zenith angle of 22.5° to 82° with peak responsivity around 72°.

FIGURE 5.17 Cosine response of a Schenk Star pyranometer.
As with other black-and-white receiver designs, the Schenk pyranometer has a single glass dome. Having a single dome also leaves the pyranometer subject to more convective and advective thermal losses.
A major concern with black-and-white pyranometers is that their responsivity changes when they are tilted. Gravity starts to affect the convective heat flow as the pyranometer is tilted. As the pyranometer tilt increases, its responsivity decreases. Therefore, black-and-white pyranometers were not recommended for measuring irradiance on tilted surfaces. Design changes have been made to Eppley 8–48 pyranometers, and these redesigned pyranometers are reported to have a smaller tilt effect (Tom Kirk and John Hickey, personal communication).
The Schenk star is often difficult to level because Schenk’s bubble level is not easy to read. It is often easier to put a level on the metal ring that holds the dome in place. The desiccant is in a container under the pyranometer. This requires lifting the pyranometer from its platform or ventilator to check and replace the desiccant. When the desiccant is examined, the pyranometer has to be releveled. The Eppley black-and-white pyranometer (model 8–48) has its desiccant on the front side of the pyranometer and is therefore easier to view and change.
As with other types of pyranometers, responsivity of black-and-white type pyranometers also changes with temperature (Figure 5.18). Temperature compensation is typically available between –20°C and +40°C.
Black-and-white pyranometers should be mounted in a ventilator or with an air gap between the instrument base and the mounting surface to maintain thermal isolation from the mounting platform.

FIGURE 5.18 Typical temperature response of an Eppley 8–48 (black-and-white) pyranometer.
5.3.2 LACK OF THERMAL OFFSET
For accurate measurements, the heat flow should be between the thermopiles behind the black and white surfaces. Other heat losses, such as from wind blowing across the pyranometer surfaces, reduce the accuracy of the measurements. In addition, temperature-compensating components are added to the detector circuitry to minimize the effect of nonlinear thermopile response to ambient temperature. Conduction losses are minimized by isolating the thermopile from the other components of the pyranometer.
From Kirchhoff’s law, as discussed in Chapter 2, a good absorber of radiation is also a good emitter of radiation, and a good reflecting surface is also a poor emitting surface. At thermal equilibrium, absorption is equal to emission. As a first guess, one might think that the highly reflective white surface would also be a good reflector (poor emitter) at all wavelengths, including infrared. This is not the case because the emittance and reflectance characteristics are dependent on wavelength and the highly reflective white paint used in the black-and-white type pyranometer becomes as good an emitter at the mid-IR wavelengths as are the black surfaces. Thermal losses result from the pyranometer dome radiating to the sky. As the dome cools, the receiver surface cools by radiating to the cooler dome. At ambient temperatures, almost all of this radiation is in the mid-IR. Therefore both surfaces emit nearly the same amount of mid-infrared radiation, resulting in a minimal differential thermal offset.
As discussed in Section 5.2.1, black-disk thermopile pyranometers can have offsets as large as –20 to –40 Wm–2. This can lead to intolerable errors if using these instruments to measure diffuse irradiance that can be on the order of 100 Wm–2 or less on clear days. This radiative loss suggests that black-and-white type pyranometers are superior to black-disk thermopile pyranometers for diffuse measurements unless the latter are corrected precisely for thermal offsets. This issue will be discussed more thoroughly in Chapter 6 on high-quality diffuse measurements.
5.4 Photodiode-Based Pyranometers
Major features of photodiode pyranometers are as follows:
Fast response
Based on short-circuit current from solar cells (silicon photodiode)
Output signal can be monitored either in a current or voltage mode
Responsivity has a temperature dependence
Responsivity depends on the spectral characteristics of the incident radiation
Responsivity not affected by tilt of instrument
Tilted measurements affected by spectral characteristics of ground-reflected irradiance
Understanding the characteristics of the silicon photodiode is helpful in understanding the rationale for methods used to ameliorate the problems faced when using a photodiode pyranometer. The cell used in a photodiode is often enhanced to have a better response to the blue portion of the solar spectrum than a typical solar cell.
Photodiode-based pyranometers use silicon photodiodes similar in design to photovoltaic or solar cells. Photodiodes are used to measure energy flux, and those packaged in a pyranometer are specifically designed to monitor incident solar radiation. Photodiodes measure the incident flux by monitoring the voltage across a low-temperature-coefficient (precision) resistor through which the photocurrent flows. This is equivalent to measuring the short-circuit current of a solar cell. As opposed to photodiodes, the much larger area solar cells are used to convert the incident solar energy into electrical power. Therefore, solar cells are operated differently than photodiodes. While solar cell output is related to incident solar energy, the photocurrent from a photodiode pyranometer is a much more accurate measure of the incident irradiance. The measurement accuracy of a photodiode pyranometer can be enhanced by using a foreoptic to improve the angular response of the instrument.
At first glance it would seem relatively easy to construct a pyranometer using a photodiode. However, the external quantum efficiency of photodiodes that generate the current is dependent on the wavelength of the incident light and photodiodes using silicon-based solar cells respond well to wavelengths between 450 nm and 900 nm but do not respond efficiently to wavelengths shorter than ∼300 nm and longer than ∼1100 nm (see Figure 5.19). The spectral response of silicon is another way of examining the applicability of photodiodes as pyranometers. The spectral response is the amount of current that is produced divided by the energy incident on the cell at a given wavelength. A plot of the spectral response of the same solar cell is given in Figure 5.20. While photons in the 450 nm to 900 nm range produce electrons nearly 90% of the time, any energy above the energy needed to separate the electron hole pair goes into heat. Therefore, the response to higher-energy photons (photons with shorter wavelengths) does not produce a higher current. The closer the photon energy is to the energy needed to cross the band gap, the higher the spectral response. Another way of looking at this is that a photon at a wavelength of 450 nm will produce one electron and a photon at a wavelength at 900 nm will produce one electron. Since the photon with a wavelength of 450 nm has twice as much energy as a photon with a wavelength of 900 nm, the spectral response of the 450 nm photon will be half that of the 900 nm wavelength photon. In most cases these photodiode pyranometers use an acrylic diffuser that limits the response to wavelengths greater than 400 nm. In addition, the dark current (signal generated in the absence of solar radiation) and the photocurrent are affected by the temperature of the photodiode, and, therefore, the response of the photodiode pyranometer varies with temperature. The dark current is minimized in photodiode pyranometers and most of the temperature effect is caused by the change in the band gap with temperature. Photodiode-based pyranometers are used for measuring global irradiance for clear and cloudy skies and are calibrated under clear-sky conditions. The use of these pyranometers in measurement situations that have a different spectral distribution is discouraged. The LI-COR model LI-200 user’s manual states that the pyranometer should not be used under vegetation or artificial lights, in a greenhouse, or for reflected solar radiation. Photodiode pyranometers should not be used for diffuse or direct normal solar measurements without adjustments correcting the responsivity’s spectral dependence (see Chapter 7).

FIGURE 5.19 External quantum efficiency of a solar cell as a function of wavelength. Quantum efficiency is the percentage of electrons produced divided by the number of photons incident on the solar cell. A 90% quantum efficiency means that 90% of the photons of the particular wavelength incident on the material produce an electron. Measurements are made with voltage near zero—short-circuit current.

FIGURE 5.20 A plot of the spectral response of a typical silicon solar cell. Data comes from the same silicon cell used in Figure 5.19. The spectral response is the amount of current that is produced per incident irradiance on the cell. The units are normalized amps/watt. Measurements are made with voltage near zero—short-circuit current.
The peak spectral response of a typical single crystalline silicon solar cell is around 900 nm, and the silicon solar cell doesn’t respond to wavelengths longer than about 1100 nm. The quantum efficiency of the solar cells is highest between 450 and 900 nm but falls off rapidly below 450 nm and above 1000 nm (King and Myers, 1997) (see Figure 5.19).
At higher temperatures, the photodiode is more responsive. The temperature response is actually wavelength dependent with a small, negative temperature dependence below 900 nm and a large positive temperature dependence above 900 nm resulting in a net positive temperature response.
The temperature response of a photodiode is different than the temperature response of solar cells. Photodiodes operate at near short-circuit currents with very little voltage drop in the circuit. Solar panels that are used to produce electricity operate at a max power point that is nearer the open-circuit voltage than the zero voltage of a genuine short-circuit voltage. The open-circuit voltage decreases significantly with temperature, and this causes solar panel output to drop with temperature. The temperature dependence of the maximum power point output of a solar panel is not directly related to the slight increase in short-circuit current as the temperature increases.
PV reference cells are used to compare actual PV system performance with that expected from reference conditions, such as ASTM standard spectra for 1000 Wm–2 and 25°C (ASTM E913–97, 1997). Used properly, PV reference cells should be made of the same material as the PV system being tested. Reference cells are made to test whether system performance is as expected and not to measure the precise irradiance incident on the PV system. Metallic current collection grids on the surface of the cell and antireflective coatings on the protective glazing of the PV cell also affect the cell’s output depending on the angle of incidence of the incoming irradiance. PV reference cells do not make good pyranometers since they have a poor cosine response.
5.4.1 CHARACTERIZING A PHOTODIODE PYRANOMETER
The factory specifications for the LI-COR model LI-200 (Figure 5.21) and the Kipp & Zonen SP Lite (Figure 5.22) pyranometers are given in Tables 5.6 and 5.7, respectively. Photodiode pyranometers do not meet the ISO and WMO specifications as second-class pyranometers because of their limited spectral response. However, these pyranometers may perform as well as many second-class pyranometers in certain applications. In fact, many of the specifications of these photodiode pyranometers are significantly better than second-class specifications and even meet or surpass some of the first-class specifications. For example, the response time of a LI-COR LI-200 is extremely fast (approximately 10 μsec), about five orders of magnitude faster than a thermopile pyranometer. Therefore, photodiode pyranometers are often used when fast response times are required (see rotating shadowband radiometers, Chapter 7).
Pyranometer calibration plots of an Eppley PSP, a LI-COR LI-200, and a Schenk Star are given in Figure 5.23 and summarized in Table 5.8. The data in Figure 5.23 were taken on July 6, 2010, and show the typical cosine response characteristics of each instrument. A calibration ratio is created by dividing the measured GHI of each instrument, using previous responsivities, by the reference GHI calculated from the DNI and DHI. The DNI was measured using an AHF absolute cavity radiometer, and the DHI was obtained from an Eppley PSP shaded by a shade ball. The thermal offset from the Eppley PSP was corrected by use of pyrgeometer and relative humidity measurements (Younkin and Long, 2003). Normally a Schenk Star or an Eppley model 8–48 pyranometer are used for the DHI measurements to minimize the thermal offset issue, but in this case the only available Schenk Star type pyranometer was being calibrated. The responsivities have been normalized to give the calibration ratio of 1 at a 45° solar zenith angle. It is standard practice to specify the pyranometer responsivity at a 45° solar zenith angle (Myers, Stoffel, Reda, Wilcox, and Andreas, 2002; Myers, Reda, Wilcox, and Andreas, 2004). Because the responsivity changes with solar zenith angle, only data taken within +/–1° of 45° were used to determine the instrument’s responsivity at 45°. The data at 44.54° were used to determine the responsivity of the instruments. Typically the variance in the PSP data at each solar zenith angle is less than the LI-200 and Schenk Star pyranometer because the PSP has a large thermal mass and hence is less influenced by rapid changes in the environment. The Schenk Star pyranometer responsivity varies more than the PSP because it has a smaller thermal mass and only one glass dome. However, this instrument has a better cosine response than this PSP at the station. The LI-COR LI-200 pyranometer exhibits more variance because the spectral composition of the irradiance changes, but the average irradiance measured is a good representation of the reference values. The cosine response of the LI-200 pyranometer starts to significantly deviate from true cosine response once the zenith angle is greater than 75°.

FIGURE 5.21 LI-COR model LI-200 pyranometer.

FIGURE 5.22 Kipp & Zonen model SP Lite pyranometer.
TABLE 5.6
LI-COR 200 Pyranometer Specifications
|

TABLE 5.7
Kipp & Zonen SP Lite Pyranometer Specifications
|

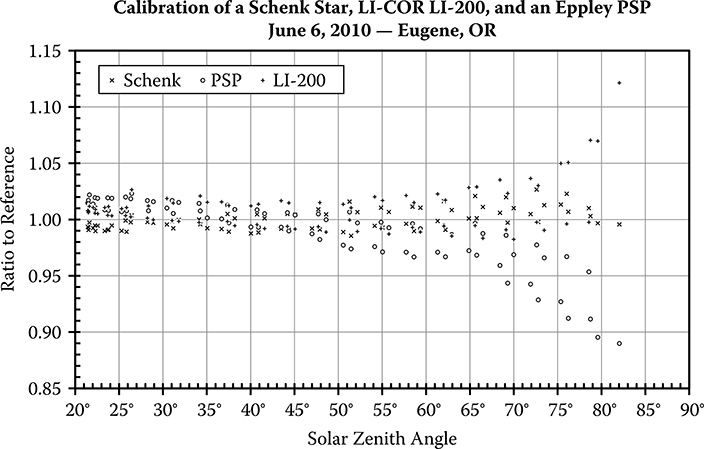
FIGURE 5.23 Calibration ratio data for an Eppley PSP pyranometer, a Schenk Star pyranometer, and a LI-COR model LI-200 pyranometer plotted against solar zenith angle. These are 1-minute data. The reference data are the DNI from an Eppley AHF absolute cavity radiometer projected onto a horizontal surface plus the diffuse irradiance from an Eppley PSP that has been corrected for thermal offsets.
TABLE 5.8
Relative Responsivity of Three Pyranometers Normalized to 1 at sza of 45°
|


FIGURE 5.24 Average calibration ratio plots of 15 LI-200 pyranometers that have been normalized so that the ratio is 1 at a zenith angle of 45°. The oldest pyranometer show the best cosine fit at large angles.
Figure 5.24 shows a calibration ratio plot of 15 LI-200 pyranometers. Some instruments representing the same model do perform slightly better than others, and while the shapes of the cosine response curves are similar among the same model of instrument they do vary. This is especially true at large angles of incidence. The large deviation around 85° is related to the shape of the diffuser and the artificial horizon on the LI-200 pyranometer.
5.4.2 CORRECTIONS MADE TO PHOTODIODE PYRANOMETERS
The designers of photodiode pyranometers consider two factors in their construction (Kerr, Thurtell, and Tanner, 1967):
The diffuser of the pyranometer must be designed to produce, as close as possible, a Lambertian response to the incident solar radiation. With a Lambertian response, the incident energy from a point source is proportional to the intensity of the source times the cosine of the incident angle.
The solar cell chosen needs to have a similar response throughout most of the day to give a better measurement of the incident solar irradiance.
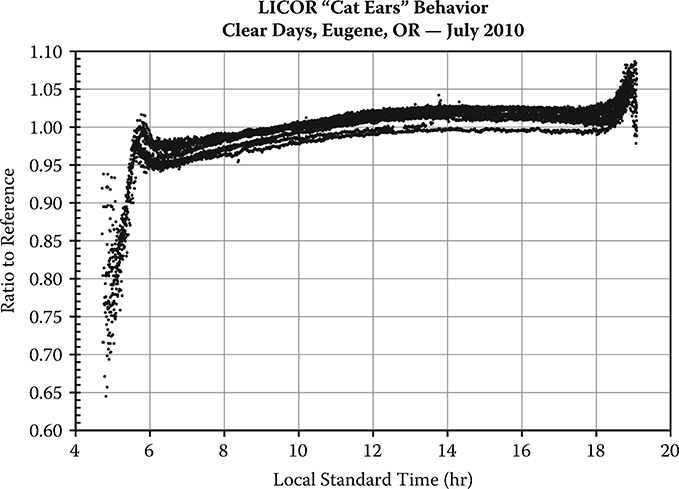
FIGURE 5.25 Plot of the ratio of a LI-COR LI-200 pyranometer divided by GHI calculated from an Eppley NIP for DNI and a Schenk Star pyranometer for the DHI against time. Values are 1-minute averaged data. Clear days in July 2010 were selected for the plot.
The typical responsivity of the LI-COR LI-200 pyranometer is fairly flat across the day and shows sharp spikes in early morning and late afternoon hours (see Figure 5.25). Only clear days were selected for the plot. For LI-200 pyranometers, two peaks in Figure 5.25 are observed. These angles correspond to high solar zenith angles around 85° in the morning and the afternoon. The plot reminded Augustyn et al. (2002) of “cat ears” when he was developing a model to correct the cosine response of the LI-200 pyranometer. The cause of the cat ears effect is the shape of the diffuser that improves the uniformity of the responsivity over much of the day. As with all pyranometers, modifications to correct for one limitation often lead to another limitation in a different situation. Therefore, it is always useful to know how the instrument performs under a wide variety of circumstances.
Notice that there is a distinct slope to the responsivity over the day with the ratio lower in the morning than in the afternoon. Temperature dependence of the pyranometer is likely to be partially responsible for some of this apparent slope. By multiplying the LI-200 pyranometer GHI values by
the shape of the responsivity ratio is more symmetric (see Figure 5.26). The temperature used in the equation is the ambient air temperature in Celsius. An ambient temperature of 25°C was chosen as the reference temperature because it is the standard temperature used when specifying solar cell performance. The temperature data in Figure 5.26 range from 10°C to 35°C.
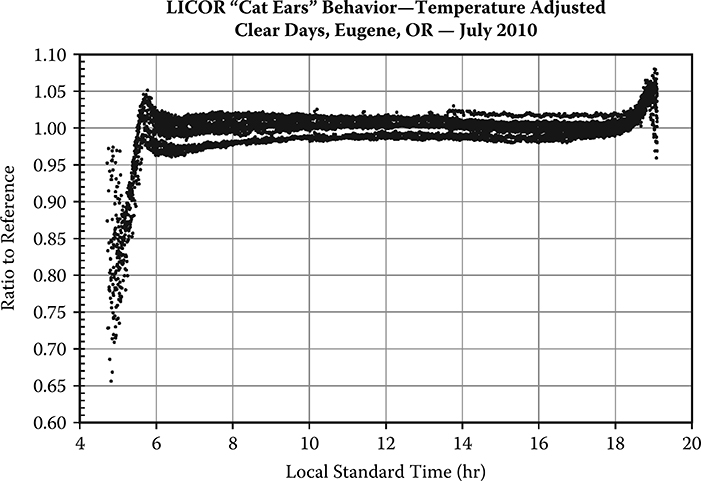
FIGURE 5.26 Plot of the ratio of a LI-COR LI-200 pyranometer divided by GHI calculated from an Eppley NIP for DNI and a Schenk Star pyranometer for the DHI against time. The LI-200 GHI values have been multiplied by 1 – 0.0035*(Temperature – 25°C). Values are 1-minute averaged data. Clear days in July 2010 were selected for the plot.
These corrections are two to four times more than expected for silicon solar cells, indicating that other factors may mimic this assumed temperature dependence (Kerr et al., 1967). For example, the optical alignment of the detector could be partially responsible for the asymmetry seen in Figure 5.25 (Michalsky et al., 1995).
Many other factors can contribute to the shape and distribution seen in Figure 5.25, and care should be taken to untangle spectral change effects from cosine and temperature response effects. It is important to theoretically and experimentally identify the magnitude and direction of such effects on measurement performance before claiming that results show the physical effects of a specific variable. Before applying a correction with confidence, it has to be verified for a wide variety of measurement situations and at a number of different geographic locations.
For solar cells, the temperature coefficient introduces a bias of a few percent in measurements made in the 0 to 40°C range. The temperature coefficient for short-circuit current from silicon solar cells varies from –0.0004/°C to around 0.0015/°C when measured at different wavelengths (see Figure 5.27). A more detailed examination shows that the temperature coefficient for a silicon photodiode is positive in the wavelengths between 850 to 1100 nm and zero or slightly negative for wavelengths below 850 nm (Kerr et al., 1967). To minimize the uncertainty associated with temperature dependence, some photodiode pyranometers are heated to maintain a constant (higher than ambient) temperature, while others measure the pyranometer temperature and apply a correction factor to account for the change in responsivity with temperature. Some of the least expensive photodiode pyranometers ignore the instrument calibration change with temperature.
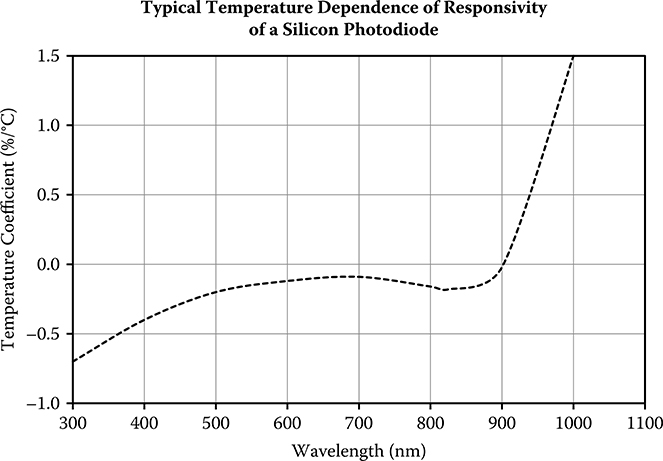
FIGURE 5.27 Typical temperature dependence of the responsivity of a silicon photodiode versus wavelength. The spectral response will vary depending on the processing; however, the general features are driven by the temperature effect on the band gap. (From Myers, D., Energy, 30, 2005. With permission.)
Pyranometers are calibrated during clear days and produce results such as shown in Figure 5.23. The measured irradiance under cloudy conditions compares favorably to measurements made with higher precision pyranometers. Clouds scatter all solar wavelengths nearly equally since the cloud particles are large compared with the solar wavelengths (geometric scattering limit).
Black-disk thermopile pyranometers such as an Eppley PSP have a fairly uniform spectral response over the wavelengths of interest. However, photodiode pyranometers, such as the LI-COR LI-200 and Kipp & Zohen SP Lite have a marked spectral response to the incident solar radiation. As shown in Figure 5.28, the LI-200 has the maximum sensitivity to wavelengths near 900 nm and does not respond to solar radiation with wavelengths over 1100 nm or under 400 nm. The effects of the acrylic diffuser on the LI-200 responsivity can be seen by comparing Figure 5.28 with Figure 5.20, which shows the responsivity for a silicon solar cell without an acrylic diffuser.
King, Kratochvil, and Boyson (1997) provide a good study of the spectral responsivity of the LI-200 pyranometer. They examine the responsivity on a clear day when approximately 90% of the global irradiance came from DNI. The responsivity of the photodiode-based pyranometer to clear-day DHI is significantly different from the responsivity for the DNI (Figure 5.29) (Vignola, 1999). On a clear day, the responsivity of the photodiode to the blue sky dome is about 70% of the responsivity determined for full-spectrum GHI or DNI. The photodiode pyranometers do not respond as well to the blue portion of the solar spectrum as seen in Figures 5.20 and 5.28, and when the diffuse spectrum consists largely of blue light, such as on a clear day, the photodiode will underreport the DHI. The DHI responsivity also changes as the solar zenith angle increases and the diffuse spectrum shifts toward red. The DHI responsivity of the LI-200 increases as the DHI reddens, and at a solar zenith angle of 85° it is about 87% of the responsivity when measuring GHI at 45°. Some of the spread in the responsivity ratios in Figures 5.25 and 5.26 results from different atmospheric composition and hence differences in the spectral characteristics of the incident radiation. The haziest day (as determined by the lowest DNI values and highest DHI values) also has the lowest responsivity ratio values in Figure 5.26.

FIGURE 5.28 Percent relative response of a LI-COR LI-200 pyranometer plotted against wavelength from the LI-200 pyranometer brochure from LI-COR. The percent scale is on the right-hand axis. Also plotted are the extraterrestrial solar radiation curve, solar radiation curve at sea level, and a curve for black-body radiation at a temperature of 5900 K. Peak responsivity of the LI-200 pyranometer is to wavelengths between 950 nm and 1000 nm.
On clear days, the spectral characteristics of both the DNI and DHI are different and their spectral distribution changes over the day. The DNI spectrum shifts toward the IR as the path length through the atmosphere increases and more of the blue portion of the spectrum is scattered from the DNI. The DHI on clear days contains a considerable amount of blue light caused by Rayleigh scattering. Near sunrise or sunset, both DNI and DHI are redder as the blue light has been preferentially removed by Rayleigh scattering. This results in the reddish color of the sun and sky in the morning and evening. This red shift in the morning and evening hours occurs for DHI on cloudy as well as clear days because clouds are neutral attenuators.
On clear days it is difficult to separate angular response problems from spectral response changes. This can be seen in Figure 5.25 where the cat ears effects dominate the change in responsivity at larger solar zenith angles. On cloudy days, the scattering by clouds provides a more uniform distribution of irradiance, and the angular response does not change over the day. Figure 5.30 plots the ratio of DHI from a LI-COR LI-200 pyranometer divided by the DHI from the Schenk pyranometer on cloudy days. This ratio isolates the effects of changes in spectral distribution on the LI-200 responsivity. The angular responses of both instruments affect the ratio, but the effect remains approximately constant over the day because the radiation is coming from all parts of the sky. Note that the responsivities of the instruments for cloudy periods are about the same during most of the day, because the DHI spectrum that the LI-COR LI-200 pyranometer sees is much like the GHI spectrum because the clouds act as neutral filters scattering all wavelengths equally. However, as the solar zenith angle increases, the total spectrum shifts toward red and becomes more like the spectrum that the LI-200 sees on clear days near sunrise and sunset; therefore, the responsivity of the LI-200 decreases to about 85% at 85°, the same value as in Figure 5.29. If the photodiode pyranometer is to be used for DHI measurements, large systematic errors will occur unless corrections are made to account for the changes in the spectral distribution and the resulting changes in pyranometer responsivity.

FIGURE 5.29 Comparison of diffuse measurements from LI-200 pyranometer in a rotating shadowband pyranometer and a Schenk Star pyranometer with a shade ball. Five clear days in August were chosen for the plot. The lowest values occurred on the clearest day. The LI-200 diffuse measurements are around 30% below the measurements of broadband thermopile pyranometers. From Figure 5.22, it can be seen that the photodiode pyranometer responds better to the redder portion of the solar spectrum.

FIGURE 5.30 Plot of the responsivity ratio of a LI-200 pyranometer as a function of zenith angle for periods in July 2010 when the DNI less than or equal to 1 Wm–2. Data are 1-minute values.
The response of the photodiode pyranometer to clear-sky diffuse is about 30% lower than a thermopile pyranometer. Under cloudy skies, the spectral distribution is similar to the GHI solar spectrum because the clouds are neutral scatters. Therefore, the photodiode pyranometer measurement of cloudy sky diffuse is comparable to thermopile pyranometer measurements.
The shade–unshade and summation calibration techniques will be discussed in detail in Section 5.5, but there is a systematic difference in responsivities determined for photodiode pyranometers using the two techniques that result from the different DNI and DHI spectra. The calibration of the photodiode pyranometer by the shade–unshade versus the summation technique is minimally affected by the lower diffuse responsivity since the diffuse component may make up only about 10% of the total irradiance on a clear day. A 30% error in a 10% component is only 3%, which is less than the typical uncertainty of ±5% associated with the calibration of a photodiode pyranometer. The poorer response of the photodiode pyranometer to clear-day DHI results in the responsivity determined by the summation method being about 3% lower than the responsivity obtained by a shade–unshade calibration.
It is recommended that a photodiode pyranometer be calibrated by the summation technique as this is similar to the way the pyranometers are used in the field for GHI measurements. For calibrations where it is not possible to use the summation technique, a side-by-side comparison can be made near a solar zenith angle of 45° with a reference photodiode pyranometer of the same model that has been calibrated by the summation technique. The estimated measurement uncertainties associated with side-by-side pyranometer comparisons are larger than methods referenced directly to pyrheliometer measurements.
Pyranometers operate under all weather conditions, unlike the clear-sky conditions used to calibrate the pyranometers. The absolute uncertainty of a photodiode pyranometer is often quoted as ±5%. In the field, the measurement uncertainty of these devices depends on many conditions, such as air temperature, time of day (solar zenith and azimuth angles), irradiance levels, spectral composition, and soiling or moisture on the diffuser. The temperature response of the LI-200 pyranometer under all sky conditions is illustrated in Figure 5.31. The responsivity of the LI-200 pyranometer in this example appears to increase by 0.3% per °C; however, the temperature dependence of the reference instruments has not been addressed. Other environmental factors may have also influenced the distribution of the data in Figure 5.31. If the temperature dependence of the pyranometer has been accurately determined, these systematic errors may be removed. A multivariate correlation is needed to analyze the true dependence of the responsivity on a variable because some factors can mimic changes seen in other variables. In this case, the temperature dependence of the reference instruments may not be the only contributor.
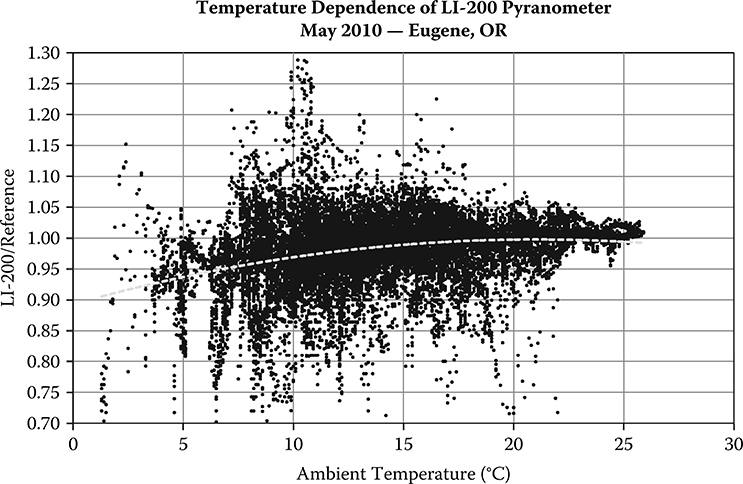
FIGURE 5.31 Ratio of LI-200 pyranometer readings divided by reference global values plotted against temperature. The ratio increases at a rate of approximate 0.3% per degree Celsius.
Figure 5.32 contains a plot of global irradiance measured by a LI-COR LI-200 pyranometer divided by the reference global irradiance plotted against the clearness index for May 2010 in Eugene, Oregon. The clearness index (kt) is computed as the ratio of measured GHI to the corresponding extraterrestrial value. The points with the low response ratios around clearness index of 0.2 occur mostly at zenith angles above 70° and probably represent the same spectral phenomena as shown in Figure 5.30.
5.4.3 REFERENCE SOLAR CELLS
Reference solar cells are sometimes used to check the relative performance of PV systems. Reference solar cells are specially packaged and characterized according to standard practices (ASTM, 2008, 2009, 2010; IEC, 2007), have a high-quality calibration history, and are used to check performance of PV modules made of similar materials when tested in solar simulators. In addition, reference cells are commonly used to adjust and monitor the intensity of solar simulators. The reference solar cells are designed to mimic the performance of PV modules on clear days when the incident angles are not extreme and are not designed to be pyranometers. Reference cells are useful for checking relative performance of PV modules and evaluating the degradation of performance over time, as long as periodic calibrations of the reference cell are maintained.

FIGURE 5.32 Plot of ratio of LI-200 pyranometer data to reference global irradiance plotted against zenith angle. One-minute data from May 2010 were used in the plot. May was a particularly cloudy month. Note that under cloudy conditions (clearness index < 0.4) and zenith angles greater than 70° the LI-200 pyranometer deviates by more than 10% from reference measurements. Reflection off clouds accounts for the high number of data points with a clearness index above 0.8.
Reference cells are normalized to standard operating conditions (an ambient temperature of 25°C, global irradiance of 1000 Wm–2, air mass of 1.5, and no wind). The output of one reference cell is not comparable to a reference cell made with a different cell type, although they should compare well to identical solar cells in identical packaging. Because reference solar cells are behind a flat glazing, they suffer from a non-Lambertian response similar to solar modules. Pyranometers are designed to measure the total solar spectrum from 300 to 3000 nm under all weather conditions. Therefore, a reference solar cell is not a pyranometer and should not be treated as such.
5.5 Calibration of Pyranometers
Proper calibrations depend on traceability to an internationally accepted standard. A critical aspect of pyranometer calibrations is its traceability to the World Radiometric Reference (WRR). The WRR is the internationally recognized measurement reference for solar irradiance (Fröhlich, 2006). A detector-based reference, the WRR is dependent on measurements from the World Standard Group (WSG) of electrically self-calibrated absolute cavity radiometers limited to DNI above 700 Wm–2 under clear-sky conditions. Another important consideration is to calibrate an instrument in the same environment it will be used for routine measurements. Although this concept may not always lead to practical calibration methods, the estimated measurement uncertainties are generally more applicable.
There are two accurate outdoor methods used to calibrate pyranometers. The shade–unshade method uses a DNI measurement with alternate shading and unshading of the pyranometer under calibration. The summation method compares an unshaded pyranometer output signal (microvolts) with the reference GHI calculated from the DNI measurement times the cosine of the solar zenith angle plus the DHI (Equation 5.1). The estimated measurement uncertainty in the pyranometer calibrations is larger than the uncertainty in pyrheliometer calibrations because there is no absolute pyranometer available to obtain a reference GHI measurement. In addition, the responsivity of pyranometers is dependent on additional factors resulting from the 180° field of view. The most noticeable problem with pyranometers is the lack of a true Lambertian angular response (true cosine response) over the range of solar zenith angles experienced during the day. A sample of this angular response for a thermopile pyranometer is shown in Figure 5.23.
5.5.1 SHADE-UNSHADE CALIBRATION METHOD
The most accurate way to calibrate a pyranometer is to use the shade–unshade method (ASTM E913–97, 1997). This is the preferred method to establish reference pyranometers, especially pyranometers used for diffuse measurements. The responsivity (µV/Wm–2) of the pyranometer is determined by subtracting the shaded voltage reading from the unshaded voltage reading and dividing this difference by the reference DNI projected onto the horizontal surface.
The accuracy of the shade–unshade method is dependent on the accuracy to which the DNI is measured. One can use either a high-quality thermopile pyrheliometer or, preferably, an absolute cavity radiometer for the DNI value. A cavity radiometer can measure the DNI to an accuracy of better than 0.5%, whereas a thermopile pyrheliometer has an absolute accuracy of between 0.7% and 1.7% (Michalsky et al., 2011). The field of view of a cavity radiometer is 5°, while that of some thermopile pyrheliometers is 5.7°. A shade disk or sphere has to be built that will shade the pyranometer such that the field of view blocked by the disk is the same as the field of view of the instrument used to obtain the DNI value. For example, a disk with a 4.97 cm radius would be equivalent to the 5.7° field of view for the disk if it was 1 meter away. If the disk was only 50 cm away, the radius needed would be 2.49 cm. For a 5.0° field of view the radius for a distance of 1 meter would be 4.36 cm, and for a distance of 50 cm the radius would be 2.18 cm. The size of the disk should be such that it shades the dome of the pyranometer, and, hence, prevents reflections from the dome impinging on the receiver. The disk should be painted black. Use an ultra-flat black paint such as Rust-Oleum Black to coat the disk and the supports. For information on standards for the shade–unshade calibrations, see ASTM E913–97 (1997) and McArthur (2004).
When performing a shade–unshade calibration, it is necessary to wait until the pyranometer reaches equilibrium when the instrument is shaded and when it is unshaded. For photodiode pyranometers, the response time is ∼10 μ.seconds; therefore, the shade–unshade intervals are very short. For a thermopile pyranometer, the response time may be several seconds depending on the design. Response time is the amount of time it takes for the instrument to respond to a step change in irradiance. In this chapter, response time is the time it takes to be within 1/eth (∼37%) of the new value. Ideally, the reading should be the true value or the equilibrium reading. During a shade–unshade calibration under the required clear-sky conditions, the incident irradiance may change by an order of magnitude from GHI to DHI. It takes between 20 and 60 times the 1/e response time for consistent readings (Reda, Stoffel, and Myers, 2003). It is important to note that it takes three times longer to achieve an equilibrium state when the shaded pyranometer is unshaded and exposed to full sun than when the unshaded pyranometer is shaded for the calibration. At full sun (e.g., DNI = 1000 Wm–2), a reading taken after 60 times the 1/e response time is representative of the true GHI. During the shaded period, it takes 20 time constants for the readings to reach a consistent DHI level (Figure 5.33). The response time is related to the thermal mass, thermal conductivity, and other design elements of the pyranometer. As in Figure 5.33, the best way to determine when the signal has stabilized is to plot the output voltage from the pyranometer when it is shaded and unshaded. Identifying this stable period requires sound judgment and experience to separate voltage creep (or overshoot) due to true irradiance change from instrument stabilization. The data used in determining the responsivity are taken when it is judged that equilibrium has been attained.
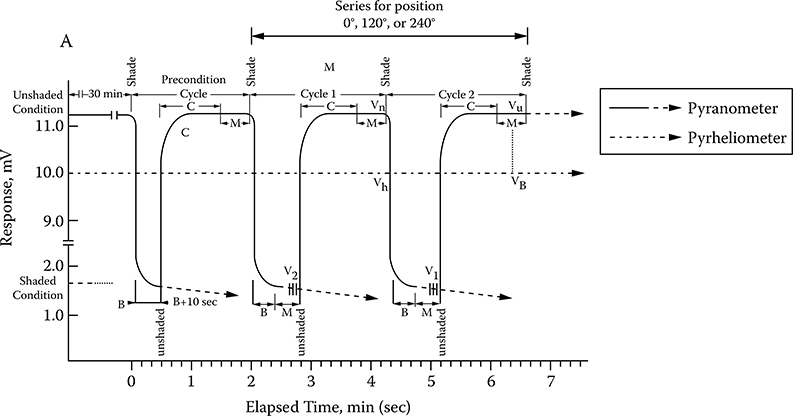
FIGURE 5.33 Schematic for the shade–unshade calibration. The timeline is the bottom axis, and the voltage reading in mV is the vertical axis. The timeline for the shade–unshade method starts 30 minutes after the pyranometer was set outside to reach thermal equilibrium. Three time scales are indicated on the plot, B, C, and M. B is equal to 20 or 30 times the instrument 1/e response time, C is 60 times the instrument response time, and M is a 30-second period when data are collected. The dashed line is the DNI irradiance divided by 100 to be on the same scale as the voltage measurement of the pyranometer being calibrated. The responsivity of the pyranometer is determined by the ratio of the voltage reading at full sun minus the voltage reading when shaded divided by the beam irradiance projected onto a horizontal surface. In this example, the responsivity is determined when the pyranometer is rotated 0, 120, and 240 degrees. This was done to check the azimuthal response of the instrument. (From Reda, I., T. Stoffel, and D. Myers, Solar Energy, 74, 103–112, 2003, and Myers, D., Energy, 30,1517–1531, 2005. With permission.)
When performing a shade–unshade calibration, the timing of the measurements is important to accurately compute the solar zenith angle. One should also measure the ambient air temperature because thermopile-and photodiode-based pyranometer readings have a known dependence on temperature. Shade–unshade calibrations should be made only when the skies are clear of clouds and the DNI readings are stable (e. g., changing by less than 3 Wm–2 during a 1-minute interval). Ideally, the measurements for establishing a reference pyranometer calibration should be repeated over multiple days throughout a year to evaluate the pyranometer’s change in responsivity with different combinations of solar zenith and azimuth angles. In lieu of this challenging requirement it is often better to fit a curve (responsivity as a function of solar zenith angle or air mass) over a few days of calibration data that average the random variations, which makes it easier to detect and account for biases in the pyranometer measurements. One significant advantage of the shade–unshade method is the elimination of the thermal offsets (Section 5.2). Thermopile pyranometers emit IR radiation to the sky, resulting in reduced voltage readings. The thermal offsets during shaded and unshaded measurements are nearly identical. By subtracting the shaded from the unshaded voltage, the offset caused by the thermal offsets is eliminated. Therefore, the responsivity determined in Equation 5.3 is unaffected by the thermal offset.
Of course, when the pyranometer is used in the field, it is subject to the thermal offsets, and these offsets need to be corrected or the irradiance is underestimated. If the summation method, discussed next, is to be used, best practices recommend that the diffuse measurements be made with a reference pyranometer that has been calibrated using the shade–unshade method.
5.5.2 SUMMATION METHOD CALIBRATION
A less tedious and more efficient calibration method is to compare the voltage output from the pyranometers under test with a reference global irradiance determined by a DNI measurement made with an absolute cavity radiometer or a first-class thermopile pyrheliometer and a DHI measurement made with a shade–unshade-calibrated and offset-corrected pyranometer mounted under a shade disk. The DNI value is projected onto a horizontal surface by multiplying this irradiance by the cosine of the solar zenith angle, and the reference GHI value is obtained by adding the DHI value to the direct horizontal value (Myers el al., 2002, 2004; Reda et al., 2003; Wilcox, Andreas, Reda, and Myers, 2002). This method can be automated for the simultaneous calibration of multiple pyranometers with responsivity values obtained throughout the day. Ideally, this should be performed near the summer solstice to allow for the widest range of solar zenith angles, but calibrations can be obtained as long as the solar zenith angle at solar noon is less than 45°. The key to the accuracy of the summation calibration method is to determine the reference GHI value using a DHI value from a pyranometer that has minimal or correctable thermal offset. By design, black-and-white type thermopile pyranometers have minimal thermal offsets. There are also single black thermopile pyranometers that exhibit minimal or correctable thermal offsets.
For consistent responsivity results, pyranometer calibrations are performed on clear days with minimal variations in atmospheric transmission (i.e., aerosol optical depth). There are many ways to specify a stable atmosphere. Instruments with fast response times, like photodiode pyranometers, can be used to check for rapid variations in the GHI due to variations in atmospheric water vapor, aerosols, and thin (subvisual) clouds, or the variability of the DNI and DHI irradiance over sub 1-minute intervals can be used to select the best calibration periods (Reda et al., 2003; Wilcox et al., 2002).
For a comprehensive determination of responsivity, the calibrations should be made over a full day or parts of 2 days and include a wide range of solar zenith and azimuth angles. To understand the change in responsivity of a pyranometer over time, it is important to measure the environmental parameters that influence the instrument responsivity. (See the BORCAL certificate in Appendix G for examples of these parameters.) Specifically, in addition to the irradiance measurements, concurrent ambient temperature, relative humidity, wind speed and direction, and barometric pressure should be recorded. If an initial responsivity is obtained when the ambient temperature is 10°C and an additional responsivity is obtained when the ambient temperature is 25°C, some of the difference between the two measured responsivities may be related to the change in temperature. If it is known how the responsivity varies with temperature, the change in responsivity over time can be better estimated by adjusting the responsivities to a standard temperature. Influence of wind speed, downwelling infrared, spectral distribution of the incident radiation, and other factors influence the responsivity of the pyranometer. It is not straightforward to separate the influence of these factors on the responsivity because the effects are often small, and they may be inseparable. For example, wind speed affects the temperature difference between the dome and body of the pyranometer, and relative humidity affects the thermal offsets and the advective efficiency of wind on heat transfer. Therefore, calibrations should be performed over a wide variety of meteorological conditions.
A single responsivity can be assigned to a pyranometer for all measurements, or, for more accuracy, a responsivity that is a function of the primary variables that affect the responsivity can be used. A prime example of the latter is a pyranometer responsivity that varies with solar zenith angle. Generally, a single responsivity of the instrument, near 45°, is used to specify the calibration for irradiance measurements. An example of a pyranometer responsivity changing over a day is given in Figure 5.34, and the responsivity plotted against the solar zenith angle is illustrated in Figure 5.35.
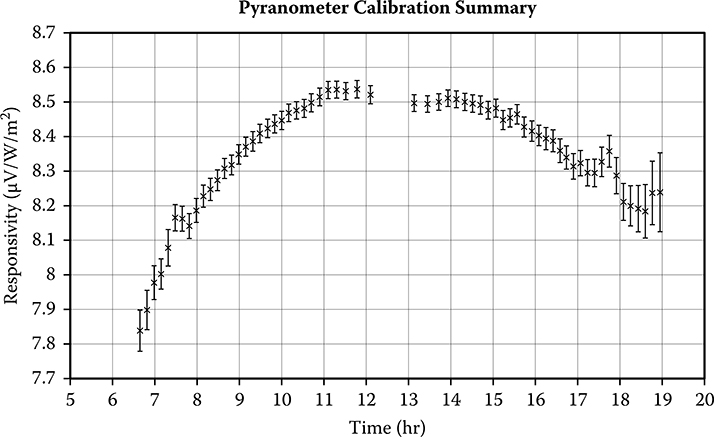
FIGURE 5.34 Plot of 1-minute responsivity data against time of day. An ideal pyranometer would have a constant responsivity over the day. Often the deviation from a flat responsivity is attributed to imperfect Lamberian (or cosine) response. Note: thermal offsets and other factors also play a role in the deviation from a true cosine response.
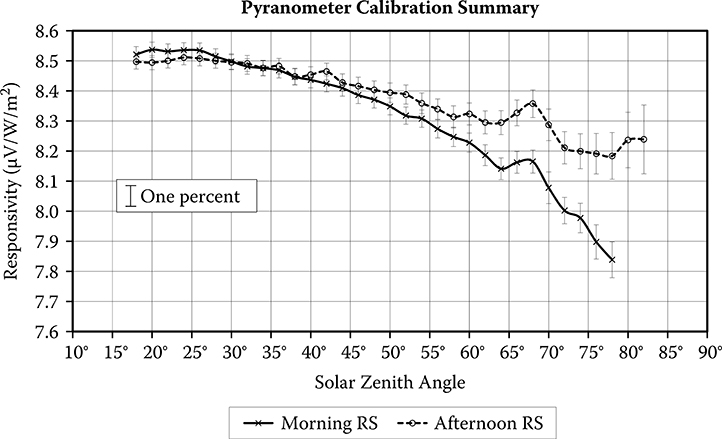
FIGURE 5.35 Same data as in Figure 5.28 with the responsivity plotted against zenith angle. A true cosine response would yield a straight line. Note that there is an asymmetry between the morning values and the afternoon values. Leveling and other factors such as changes in the azimuth response of the pyranometer and temperature effects on the responsivity can contribute to this asymmetry.
5.6 Pyranometer Calibration Uncertainties
As discussed in Chapter 4, the Guide to the Expression of Uncertainty in Measurements (GUM; JCGM, 2008) presents the GUM protocols that specify a uniform manner for obtaining uncertainties. With a set of measurements, one can determine the mean and standard deviation of the data set with respect to a reference value. This information provides only a subset of the uncertainties. Many other factors contribute to the uncertainty such as the calibration of reference instruments and accuracy of the measured radiometer output voltages, for example. The GUM protocols help classify the uncertainties and prescribe a methodology for combining the uncertainties to give an overall uncertainty of the measured values. Estimated measurement uncertainty is a very important part of understanding and applying radiometer data. Uncertainties as applied to the calibration and use of pyranometers are covered in this section (the GUM procedure was applied in Chapter 4 to pyrheliometer measurements). Uncertainties as applied to pyranometers are more complex and will be approached from a slightly different perspective than covered in Chapter 4. A brief review of the GUM procedure will be followed by examples of uncertainties calculations taken from the National Renewable Energy Laboratory (NREL) calibration procedures for broadband radiometer calibration (Myers et al., 2004).
The GUM procedure can be summarized in five steps:
Determine the measurement equation.
Calculate or estimate the standard uncertainty for each variable in the measurement equation.
Calculate the sensitivity coefficients.
Calculate the combined standard uncertainty (uC).
Calculate the expanded uncertainty (UE) by multiplying the combined standard uncertainty by the coverage factor (k), typically by applying student’s t-distribution factors for 95% or 99% confidence.
There are two types of uncertainties in a measurement. Type A uncertainties are those that can be calculated from a series of observations (labeled uA). Type A analysis is statistical in nature and determines the random errors associated with any measurement. Type B uncertainties are all of the other uncertainties that are not subject to the statistical analysis of the observations (labeled uB). Type B uncertainties are associated with a variety of effects that can affect the measurements and add uncertainty. This type of uncertainty includes the meteorological and situational influences that affect the measurement, systematic errors caused by the data logger used for the voltage measurement, and uncertainties in the calibration system used to calibrate the pyranometer.
GUM (JCGM, 2008) treats the two uncertainty types separately and then determines a combined uncertainty (uC). Uncertainties with a small “u” refer to uncertainties that are within one standard deviation (a 68% confidence level), while uncertainties labeled with a capital “U” refer to uncertainties at the 95% level of confidence. For uncertainties that are from a Gaussian (or “normal”) distribution with a large number of data points, 68% of the data points lie within 1 standard deviation of the mean, while 95% of the data points lie within 1.96 times the standard deviation (see Table 5.9 for the relationship between multiples of the standard deviation and the confidence levels for a Gaussian distribution). The ustd is the estimate of an equivalent standard deviation (of a specified distribution) of the error source (Stoffel et al., 2010). The combined uncertainty (uC) is computed from the Type A and Type B standard uncertainties summed in quadrature. When terms are added in quadrature, the sum of the square of the terms is calculated, and the square root of the total is the combined standard uncertainty of all terms. It is important to use the same confidence level for all the uncertainty terms. If one term is assigned at 68% confidence level (1 standard deviation), then all terms should be referenced to the 68% confidence level. When the square root of the sum of the squares is determined, the confidence level can be expanded. In the GUM methodology, the expanded uncertainty, UE, is determined from the combined uncertainty uC determined at the 68% level of confidence and multiplied by a coverage factor k to obtain the desired level of confidence:
TABLE 5.9
Standard Deviation and Confidence Level for a Gaussian Distribution
|
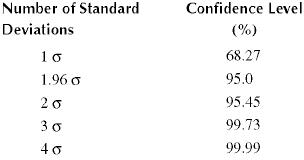
For a large enough statistical sample, a coverage factor of 1.96 is used to obtain a 95% level of confidence or a coverage factor of 2.58 is used to obtain a 99% confidence level. This all-inclusive uncertainty is called the expanded uncertainty (UE).
To be more precise, the combined standard uncertainty for a measurement is obtained from the square root of the sum of the variances of the variables that affect the measurement, weighted according to how the measurement results change with changes in these quantities; that is, by sensitivity coefficients. These sensitivity coefficients are explained in the example uncertainty analysis given in the next section.
5.6.1 UNCERTAINTY ANALYSIS APPLIED TO PYRANOMETER CALIBRATION
The procedure for determining the uncertainty in calibrating a pyranometer based upon the summation technique will be illustrated. This example is taken from Reda et al. (2008). For calibrating pyranometers with a thermal offset, the equation for the responsivity is
where
R = responsivity in [μV/(Wm–2)]
V = thermopile output voltage in (μV)
offset = the offset voltage determined from nighttime measurements of the pyranometer offset as a function of the net radiation measured by an infrared radiometer (pyrgeometer); the pyranometer responsivity to net IR irradiance Rnet, thus established, can be used during the daytime with net infrared measurements Wnet to derive the offset, which will equal Rnet. Wnet
Rnet = longwave net responsivity of the pyranometer in [μV/(Wm–2)]
Wnet = infrared net irradiance measured by collocated pyrgeometer in (Wm–2) DNI = direct normal irradiance measured by the reference pyrheliometer in (Wm–2) sza = solar zenith angle
DHI = diffuse horizontal irradiance measurement (Wm–2)
Thermopile pyranometers are subject to an IR radiative loss or thermal offset. As discussed in Section 5.3.2, black-and-white pyranometers have a minimal thermal offset. Sometimes it is possible to determine both the broadband solar and IR respon-sivities (Rne) for the pyranometer. The instrument-specific Rnet can be measured in a black-body chamber (Reda et al., 2005). Generic offsets have been determined using a black-body chamber for Eppley and Kipp & Zonen pyranometers by model, but there are still some variations within model types. The Rnet is typically 10% or smaller than the broadband solar responsivity (R). Having Rnet is useful only when pyrgeometer data are available to determine net IR flux and compute the thermal offset for a specific or generic pyranometer. If a pyrgeometer is not present, one can average the nighttime thermal offsets from the night before and night after the daytime measurements to estimate an offset correction. This will, of course, carry a larger uncertainty than the measured offset estimate (Dutton et al., 2001; Vignola et al., 2007).
The sensitivities of the coefficients in Equation 5.5 to changes in the variables are found by calculating partial derivatives of the responsivity (R) with respect to each of the variables:
Table 5.10 contains the Type B standard uncertainties for the variables in Equation 5.5. All of these uncertainties are assumed to come from rectangular distributions implying that any value between plus or minus the u-value in column three of Table 5.10 is equally likely. For this type of distribution the standard uncertainty is calculated as
![]() .
.
The pyranometer responsivity using the data in Table 5.10 and Equation 5.5 is 8.0736 μV/Wm–2. The combined uncertainty of the calibration is determined by combining the standard uncertainties with sensitivity coefficients applied in quadrature
Using the data in Table 5.10, uB is calculated to be 0.022 μV/Wm–2. The uncertainties of Type A arise from statistical sampling of the measured voltage V and the measured irradiances DNI and DHI used in the determination of R. Therefore, an equation of the form
determines the combined uncertainties of the Type A variables. The total combined uncertainty is computed from the Type A and Type B standard uncertainties by adding them in quadrature. A coverage factor k is applied to the combined uncertainty
TABLE 5.10
Estimated Standard Uncertainties of Type B
|
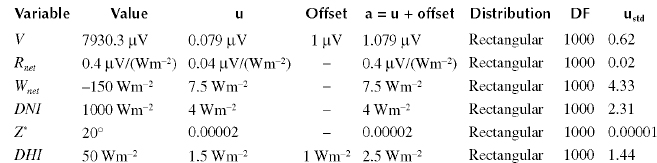
* Since the uncertainty in Z is 0.003°, at 20° the uncertainty is cos(Z + 0.003) – cos(Z).
to determine an expanded uncertainty, usually, a 95% confidence interval or a 99% confidence interval
The expanded uncertainty (UE) is defined as the interval that is expected to contain 95% (k ≅ 2) or 99% (k ≅ 3) of the values from measurements. Note that the +UE and-UE can be different values as some errors do not have symmetrical distributions. Understanding the GUM procedure requires some statistics background, especially for determining the coverage factor. For example, a student’s t-distribution should be used to determine k when the number of samples is small (n < 30) and the distribution is nearly normal. For a large number of samples, the student’s t-distribution yields a coverage factor of 1.96 for 95% uncertainty as it would be for a Gaussian distribution of an infinite number of samples.
5.6.2 AN EXAMPLE OF THE GUM PROCEDURE APPLIED TO THE CALIBRATION UNCERTAINTIES OF A PYRANOMETER
The responsivity of pyranometers changes as a function of solar zenith angle. The responsivity behavior is similar among pyranometers of the same model. Because of this change with solar zenith angle, it is necessary to be specific when stating a single calibration constant for a pyranometer. The NREL has a calibration procedure based on the summation method called Broadband Outdoor Radiometer CALibration (BORCAL) (Myers et al., 2002). Pyranometers calibrated with the BORCAL method are assigned the responsivity determined when the solar zenith angle is 45° with the expanded uncertainty based on the calibration results for solar zenith angles between 30° and 60°. Responsivities are also reported at 2° solar zenith angle increments, and a composite responsivity based on all the solar zenith angles in the calibration is reported (see Appendix G for a sample BORCAL report). The responsivity and the uncertainty associated with each method of calculating the responsivity are different because the responsivity is characterized over different solar zenith angle ranges.
In Section 5.6.1 the Type B uncertainties were discussed in detail. Examples of the Type A uncertainties will be discussed here for two different methods of defining the pyranometer responsivity.
As shown in Figures 5.34 and 5.35, the responsivity of a pyranometer changes over the day with the solar zenith angle. For the uA uncertainty for the responsivity at 45°, a simple standard deviation is determined for the data used to obtain the responsivity. The combined uncertainty is obtained by adding in quadrature the uB determined in Section 5.6.1 with the uA determined by the statistical analysis. The expanded uncertainty (UE) is obtained by multiplying the combined uncertainty by the coverage factor.
The Type A uncertainties for the responsivity data binned by solar zenith angle are determined in a similar manner to the Type A uncertainty determined for the responsivity at 45°. These uA uncertainties are the statistical uncertainties of the data used to obtain the responsivity for the given 2° solar zenith angle bin.
The complexity starts to enter when looking at the combined uncertainty over the full range of solar zenith angles or over a given range of solar zenith angles. The first task is to create a spline fit through the data points
This is a third-degree polynomial through four data points. A natural cubic spline interpolation is a piecewise cubic fit that is twice differentiable and the second differential is zero at the end points. The aj are determined by the spline fit to the nearest data points. With the spline responsivities determined for each measurement, the root mean square error can be calculated for all data. The root mean square error is the difference between the measured responsivity and the responsivity determined for each bin by the piecewise fit.
where r2 represents the sum of the squares of the AM and PM residuals with respect to the spline fit divided by the total number of data points. The number of responsivity data points in the AM is m and the number of points in the PM is n.
Next, the task is to calculate the standard deviation of the residuals from the spline fit to determine the average residual. Since there are separate spline fits for the AM and PM, a standard deviation for the morning and afternoon hours can be determined.
where rAM in this equation represents the average residual for the spline fit in the morning and ri AM is the individual residual of each data point. The afternoon standard deviation is the same format except the AM values are replaced by the PM values. The standard uncertainty (uin) from the Type A analysis is then
and the degrees of freedom are m + n – 2. For this example, the uncertainty for the interpolated function (spline fit in this example) is ±0.21%, and the Type B uncertainty (uB) is ±0.61%. Combining their uncertainty in quadrature gives the combined uncertainty (uC) of ±0.65%. The coverage factor for this data set is 1.96, which yields an expanded uncertainty at a 95% level of ±1.27%.

FIGURE 5.36 Responsivity plotted against zenith angle as in Figure 5.29. The uncertainty offsets U+(offset) and U_(offset) are shown on the plot.
In the NREL BORCAL reports, the assigned responsivity is specified at 45° solar zenith angle. This responsivity is accompanied by + and – range of uncertainty at the 95% level of confidence for measurements made when the solar zenith angle is between 30° and 60°. This confidence level is determined in the following manner. First Type A and Type B uncertainties for the 45° responsivity are determined. The percent expanded uncertainty for the 45° responsivity is then calculated. Next, the minimum and maximum responsivities in the range from 30° to 60° are determined from the calibration measurements (see Figure 5.36). These plus and minus differences are obtained, and then the percent uncertainty in the responsivity is calculated from
The expanded uncertainty is calculated by
In this example, the expanded uncertainty (UE) for the responsivity at 45° is ±0.64%. The difference between the responsivity at 45° and the maximum and minimum responsivities in the 30° to 60° range provides a +Udifferences and a Udifferences. The differences shown in Figure 5.36 are used in Equation 5.21 to calculate the percent differences +Udifferences = 1.54% and -Udifferences = –3.01%. Therefore, the expanded uncertainty for the plus range would be 2.18% and –3.64% for the negative range. Note that the offset uncertainties are at the 95% level and are the values from simple addition—not added in quadrature. Uncertainties for other zenith angle ranges can be calculated in a similar manner.
The uncertainties discussed so far are for calibrations. Uncertainties associated with field conditions that are different from the calibration conditions must be added to the uncertainties discussed for the calibration (e.g., data logger measurement specifications, stability and leveling of mounting, degree of solar access, electrical interference, etc.). The estimated measurement uncertainty of field measurements is largely dependent upon how the instruments are installed and maintained in the field.
Questions
If the DNI is 1000 Wm–2 and the DHI is 100 Wm–2 and the solar zenith angle is 45°, what is the GHI? What is the direct irradiance on a horizontal surface?
What is meant by a Lambertian response?
Is a secondary-standard pyranometer more precise that a first-class pyranometer? List three reasons one type of pyranometer is better than the other.
Briefly explain how a black-disk thermopile pyranometer measures solar energy.
Why do many first-class pyranometers have two quartz domes?
What is meant by a thermal offset in a pyranometer? What is one way to estimate the thermal offset of a pyranometer?
What is a ventilator, and why is it used?
If a pyranometer has a responsivity of 8.05 μV/Wm–2 at a solar intensity of 1000 Wm–2, a responsivity of 8.00 μV/Wm–2 at 500 Wm–2, and 7.95 μV/Wm–2 at 100 Wm–2, what is the deviation from linearity?
Why should a pyranometer be calibrated on a yearly basis?
What is meant by advective heat loss?
Describe how a black-and-white pyranometer works.
In equilibrium, a black surface has an emissivity of 95%; what is its absorptivity?
Can a white surface be highly reflective in the visible portion of the spectrum and highly absorptive in the infrared portion of the spectrum?
Explain why black-and-white pyranometers have smaller thermal offsets than first-class pyranometers.
List a number of reasons photodiodes are better at measuring solar radiation than a photovoltaic module.
Will a silicon-based photodiode pyranometer respond to sunlight with a wavelength of 1400 nm? Explain why.
Why does the LI-COR LI-200 photodiode pyranometer exhibit its cat ears response?
If the ambient temperature is 25°C, what should be the change made to the Eppley Model 8–48 pyranometer’s responsivity? If the temperature is 0°C, what should be the change made to the pyranometer’s responsivity?
On a clear day, a photodiode pyranometer responds differently to DHI than to DNI. Explain why? During the middle of the day, is there a large effect on the GHI measurements?
Explain the shade–unshade method of calibration.
Explain the summation calibration technique.
Name several causes of Type A uncertainties.
Name several causes of Type B uncertainties.
If the Type A uncertainties are 3% and the Type B uncertainties are 4%, what is the combined uncertainty? What is the expanded uncertainty at a 95% level of confidence?
References
Abbot, C. G. and L. B. Aldrich. 1916. The pyranometer—An instrument for measuring sky radiation. Smithsonian Miscellaneous Collection 66(7).
ASTM E913–97. 1997. Standard method for calibration of reference pyranometers with axis vertical by the shading method. West Conshohocken, PA: American Society for Testing and Materials.
ASTM Standard E1036–08. 2008. Standard test methods for electrical performance of non-concentrator terrestrial photovoltaic modules and arrays using reference cells. West Conshohocken, PA: American Society for Testing and Materials International.
ASTM Standard E948–09. 2009. Standard test method for electrical performance of photovoltaic cells using reference cells under simulated sunlight. West Conshohocken, PA: American Society for Testing and Materials International.
ASTM Standard E1362–10. 2010. Standard test method for calibration of non-concentrator photovoltaic secondary reference cells. West Conshohocken, PA: American Society for Testing and Materials International.
Augustyn, J., T. Geer, T. Stoffel, R. Kessler, E. Kern, R. Little, and F. Vignola. 2002. Improving the accuracy of low cost measurement of direct normal solar irradiance. In Conference Proceedings of the 2002 American Solar Energy Society, Solar 2002, Reno, NV: American Solar Energy Society, Boulder, CO.
Augustyn, J., T. Geer, T. Stoffel, R. Kessler, E. Kern, R. Little, F. Vignola, and B. Boyson. 2004. Update of algorithm to correct direct normal irradiance measurements made with a rotating shadow band pyranometer. In Conference Proceedings of the 2004 American Solar Energy Society, Solar 2004, Portland, OR: American Solar Energy Society, Boulder, CO.
Bunch, B. and A. Hellemans. 2004. The history of science and technology: A browser’s guide to the great discoveries, inventions, and the people who made them, from the dawn of time to today. Boston: Houghton Mifflin.
Dutton, E. G., J. J. Michalsky, T. Stoffel, B. W. Forgan, J. Hickey, D. W. Nelson, T. L. Alberta, and I. Reda. 2001. Measurement of broadband diffuse solar irradiance using current commercial instrumentation with a correction for thermal offset errors. Journal of Atmospheric Oceanic Technology 18:297–314.
Gulbrandsen, A. 1978. On the use of pyranometers in the study of spectral solar radiation and atmospheric aerosols. Journal of Applied Meteorology 17:899–905.
International Electrotechnical Commission (IEC). 2007. IEC 60904–2: Photovoltaic device—Part 2: requirements for reference solar cells. International Electrotechnical Commission, 3, rue de Varembé, PO Box 131, CH–1211, Geneva 20, Switzerland.
Joint Committee for Guides in Metrology. (JCGM). 2008. Evaluation of measurement data— Guide to the expression of uncertainty in measurement. GUM 1995 with minor revisions. Bureau International des Poids et Mesures. Available at: http://www.bipm.org/en/publications/guides/gum.xhtml
Kerr, J. P., G. W. Thurtell, and C. B. Tanner. 1967. An integrating pyranometer for climatological observer stations and mesoscale networks. Journal of Applied Meteorology 6:688–694.
King, D.L., W. E. Boyson, B. R. Hansen, and W. I. Bower. 1998. Improved accuracy for low-cost solar irradiance sensors. Paper presented at the 2nd world conference and exhibition on photovoltaic solar energy conversion, July 6–10, Vienna, Austria.
King, D. L., J. A. Kratochvil, and W. E. Boyson. 1997. Measuring solar spectral and angle-of-incidence effects on photovoltaic modules and solar irradiance sensors. Paper presented at the 26th IEEE photovoltaic specialists conference, September 29-October 3, Anaheim, CA.
King, D. L. and D. R. Myers. 1997. Silicon-photodiode pyranometers: Operational characteristics, historical experiences, and new calibration procedures. Paper presented at the 26th IEEE photovoltaic specialists conference, September 29-October 3, Anaheim, CA.
Long, C. N., K. Younkin, and D. M. Powell. 2001. Analysis of the Dutton et al. IR loss correction technique applied to ARM diffuse SW measurements. In: Proceedings of the eleventh atmospheric radiation measurement (ARM) science team meeting, ARM-CONF–2001. Washington, DC: United States Department of Energy.
McArthur, L. J. B. 2004. Baseline Surface Radiation Network(BSRN). Operations Manual. WMO/ TD-No. 879, World Climate Research Programme/World Meteorological Organization.
Michalsky, J., E. G. Dutton, D. Nelson, J. Wendell, S. Wilcox, A. Andreas, P. Gotseff, D. Myers, I. Reda, T. Stoffel, K. Behrens, T. Carlund, W. Finsterle, and D. Halliwell. 2011. An extensive comparison of commercial pyrheliometers under a wide range of routine observing conditions. Journal Atmospheric Oceanic Technology 28:752–766.
Michalsky, J., J. Liljegren, and L. Harrison. 1995. A comparison of sun photometer derivations of total column water vapor and ozone to standard measures of same at the Southern Great Plains Atmospheric Radiation Measurement site. Journal of Geophysical Research 100(D12):25995–26003.
Myers, D. 2005. Solar radiation modeling and measurements for renewable energy applications: Data and model quality. Energy 30:1517–1531.
Myers, D. R., I. Reda, S. Wilcox, and A. Andreas. 2004. Optical radiation measurements for photovoltaic applications: Instrument uncertainty and performance. National Renewable Energy Laboratory (NREL) conference paper NREL/CP–560–36320.
Myers, D. R., T. L. Stoffel, I. Reda, S. M. Wilcox, and A. Andreas. 2002. Recent progress in reducing the uncertainty in and improving pyranometer calibrations. Transactions of the American Society of Mechanical Engineers 124:44–49.
Pulfrey, D. L. 1978. Photovoltaic power generation. New York: Van Nostrand Reinhold.
Reda, I., J. Hickey, C. Long, D. Myers, T. Stoffel, S. Wilcox, J. J. Michalsky, E. G. Dutton, and D. Nelson. 2005. Using a blackbody to calculate net longwave responsivity of shortwave solar pyranometers to correct for their thermal offset error during outdoor calibration using the component sum method. Journal of Atmospheric and Oceanic Technology 22(10):1531–1540.
Reda, I., D. Myers, and T. Stoffel. 2008. Uncertainty estimate for the outdoor calibration of solar pyranometers: A meteorologist perspective. National Conference of Standards International (NCSLI) Journal of Measurement Science 3(4):58–66.
Reda, I., T. Stoffel, and D. Myers. 2003. A method to calibrate a solar pyranometer from measuring reference diffuse irradiance. Solar Energy 74:103–112.
Riihimaki, L. and F. Vignola. 2008. Establishing a consistent calibration record for Eppley PSPs. Paper presented at the Proceedings of the 37th ASES Annual Conference, San Diego, CA.
Stoffel T. L. and D. R. Myers Accuracy of silicon versus thermopile radiometers for daily and monthly integrated total hemispheric solar radiation, BSRN instrument book. Available at: http://www.bsrn.awi.de/fileadmin/user_upload/Home/Publications/McArthur.pdf
Stoffel, T., D. Renné, D. Myers, S. Wilcox, M. Sengupta, R. George, and C. Turchi. 2010. Concentrating solar power: Best practices handbook for the collection and use of solar resource data. Technical Report NREL/TP–550–47465, National Renewable Energy Laboratory, Golden, CO.
Velmre, E. 2007. Thomas Johann Seebeck (1770–1831). Proceedings of the Estonian Academy of Sciences, Engineering. 13(4):276–282.
Vignola, F. 1999. Solar cell based pyranometers: Evaluation of the diffuse response. Proceedings of the 1999 Annual Conference American Solar Energy Society, 260.
Vignola, F., C. Long, and I. Reda. 2007. Evaluation of methods to correct for IR loss in Eppley PSP diffuse measurements. Paper presented at the SPIE conference, San Diego, CA.
Vignola, F., C. Long, and I. Reda. 2008. Modeling IR radiative loss from Eppley PSP pyranometers. Paper presented at the SPIE conference, San Diego, CA.
Vignola, F., C. Long, and I. Reda. 2009. Testing a model of IR radiative losses. Paper presented at the SPIE conference, San Diego, CA.
Walker, J. H., R. D. Saunders, J. K. Jackson, and D. A. McSparron. 1987. NBS measurement services: Spectral irradiance calibrations. Washington, DC: U.S. Department of Commerce, National Bureau of Standards.
Wilcox, S., A. Andreas, I. Reda, and D. Myers. 2002. Improved methods for broadband outdoor radiometer calibration (BORCAL). Paper presented at the 12th Atmospheric Radiation Measurement (ARM) science team meeting proceedings, St. Petersburg, FL.
Wilcox, S., D. Myers, N. Al-Abbadi, and M. Bin Mahfoodh. 2001. Using irradiance and temperature to determine the need for radiometer calibrations. Paper presented at the forum on solar energy, the power to choose, Washington, DC.
Wilcox, S. and T. Stoffel. 2009. Solar Resource and Meteorological Assessment Project (SOLRMAP) solar and meteorological station options: Configurations and specifications. National Renewable Energy Laboratory, Golden, CO.
WMO. 2008. WMO guide to meteorological instruments and methods of observation, WMO-No. 8 (7th ed). World Meteorological Organization, Geneva, Switzerland.
Younkin, K. and C. N. Long. 2003. Improved correction of IR loss in diffuse shortwave measurement: AN ARM values-added product. ARM TR–009. Pacific Northwest National Laboratory, 47pp.
Useful Links
WMO guide to meteorological instruments and methods of observation, http://www.wmo.int/pages/prog/www/IMOP/publications/CIMO-Guide/CIMO_Guide–7th_Edition–2008.xhtml.
BSRN operator’s manual, http://www.bsrn.awi.de/fileadmin/user_upload/Home/Publications/WCRP21_TD1274_BSRN.pdf.
Seebeck values, http://www.omega.com/temperature/z/pdf/z021–032.pdf.
Standards, http://www.ictinternational.com.au/brochures/pyranometer-classification.pdf. Standards, http://www.middletonsolar.com/documents/PyrClass.pdf.
Solar cell temperature dependence, http://pvcdrom.pveducation.org/CELLOPER/TEMP.HTM.
Transmission of wg295 glass, http://www.optical-filters.com/wg295.xhtml.