9 Albedo
When you’re thinking of putting on a new roof, make it white.
Steven Chu
Secretary of the U.S. Department of Energy (2009)
9.1 Introduction
A surface reflects and scatters a fraction of the incident solar irradiance that falls on it, including the direct normal irradiance (DNI) and the scattered sunlight that arrives from all parts of the sky, that is, the diffuse horizontal irradiance (DHI). However, a surface reflects the DNI and DHI components very differently, as will be discussed in this chapter on albedo. In general, albedo is defined as the total reflected irradiance divided by the total incident irradiance. Snowfields and deep oceans represent extremes in albedo. For newly fallen snow, 90% or more of the incident radiation may be reflected at visible wavelengths, but as snow ages, melts, and refreezes the reflectivity decreases. For the deep ocean the albedo is around 4% for calm seas at all solar wavelengths. However, if the seas have breaking waves, the albedo increases. If one looks toward the sun at the angle of incidence, a glint is detectable from the ocean surface. This glint obeys Fresnel’s equations. Albedos of surfaces can be very different spectrally with some surfaces showing higher reflectivity in the visible than in the near-infrared while other surfaces can show the opposite behavior. The albedos of vegetated areas have considerable spectral structure and change appreciably as the plants go through stages of growth, flowering, and senescence. Measurements by Bowker, Davis, Myrick, Stacy, and Jones (1985) resulted in cataloged reflectances for many common surface types, and this remains a primary reference for surface albedo for real surfaces.
The next section discusses the most frequent albedo measurements of broadband solar and photosynthetically active radiation (PAR), followed by a section that explains the usefulness of important but infrequently made spectral albedo measurements. The third section of this chapter is devoted to explaining the bidirectional reflectance function and why it is important to understanding the nature of solar radiation. The chapter concludes with a section on how these measurements should be made, including calibration tips.
9.2 Broadband Albedo
The most frequent measurement of albedo uses broadband solar radiation detectors, that is, a pair of horizontally oriented pyranometers: one mounted facing the ground for measuring the reflected (upwelling) irradiance; and another mounted facing skyward to measure the downwelling irradiance, as shown in Figure 9.1. The most frequent measurement of albedo is the total solar spectrum albedo, and PAR is probably the second most frequent measurement of broadband albedo.

FIGURE 9.1 Two examples of commercial albedometers for measuring broadband albedos: (left) Kipp & Zonen’s CMA albedometer; (right) the Hukseflux SRA01.
Broadband albedos are ever changing. They depend on whether the clouds hide the sun, and if they do not, then it depends on the sun angle with respect to the zenith; early morning and late afternoon direct solar radiation (DNI) produces a higher albedo than solar noon direct radiation. If the day is overcast, the albedo is nearly constant. If surfaces are wet, they appear darker than when they are dry; this is very obvious for PAR, which covers the wavelengths 400–700 nm, where the eye can clearly detect the effect.
Understanding surface albedo characteristics is important in renewable energy applications, atmospheric physics, agricultural research, oceanography, and climate studies. Yang et al. (2008) found that snow-free surface albedos used in the National Centers for Environmental Prediction (NCEP) Global Forecast Systems (GFS) model had too little dependence on solar zenith angle and were too low at all solar zenith angles. Further, they found that MODIS (NASA satellite) parameterizations of albedo gave overestimates for high sun angles and underestimates for low sun angles. These comparisons were based on long-term surface-based observations of broadband albedos at three U.S. Department of Energy Atmospheric Radiation Measurement (ARM) Program sites (Ackerman and Stokes, 2003; Stokes and Schwartz, 1994) and at six of the National Oceanic and Atmospheric Administration Surface Radiation (SURFRAD) Network sites (Augustine et al., 2000).
PAR albedos have been found to be robust predictors of relative water content in maize leaves (Zygielbaum, Gitelson, Arkebauer, and Rundquist, 2009). It is reasonable to assume that this would apply to other plants and serve as an early predictor of plant stress. As the plant becomes water stressed, the PAR albedo increases in a very predictable way. The authors suggest that this effect of increasing vegetation albedos has not been incorporated in climate modeling. While broadband albedos are useful and the measurements required are relatively straightforward, much more can be learned from albedo measurements with even moderate spectral resolution.

FIGURE 9.2 Illustration of how the albedo changes on a clear day over a vegetated surface as a function of time and as a function of wavelength. The wavelengths in the legend are in nanometers. Since the data are for June 8 in the northern hemisphere, the sun is high in the sky at solar noon where the albedo is the lowest. Since it is a clear day, the solar zenith angle dependence is associated with the direct sun’s incidence angle on the surface.
9.3 Spectral Albedo
Surface radiation is not reflected equally across the solar spectrum. For many surfaces, the wavelength dependence is dramatic. Figure 9.2 is an example of measured albedos (fraction of reflected radiation to incident radiation) as a function of local time in fractional day at six visible and near-infrared wavelengths. The clear-day albedos are for June 8, 2006, at the ARM Southern Great Plains (SGP) site between Lamont and Billings, Oklahoma (36.604°N, 97.485°W). The albedo, in this case, was calculated as an equally weighted average of two measurements over a pasture and over a fallowed field; the two measurements of albedo were used because these were the dominant surface types for the area that represents the central ARM SGP site. Figure 9.2 illustrates at least three properties of spectral albedo: the wavelength dependence, the solar zenith angle dependence, and a slight asymmetry in solar zenith angle dependence.
The reflectance is lowest at the four shortest wavelengths (those in the PAR region of the spectrum). Reflectivity in the visible window of the solar spectrum (400–700 nm) typically peaks around 550 nm and decreases on either side of this peak. The reflectivity at 615 nm is slightly higher than at 673 nm. The reflectivity at 500 nm and 415 nm are very low. Relative to the visible, there is a threefold increase in reflectivity at the 870 and 940 nm wavelengths that are beyond the infrared jump that is seen in all green vegetation. Vegetation has evolved to reflect this infrared energy that cannot be use for photosynthesis and would heat the plant with deleterious effects if this longwave energy were absorbed in any significant amount.
Another property of albedo that is immediately obvious in Figure 9.2 is the large and smooth dependence on the solar zenith angle. For the SGP station on June 8, the solar zenith angle at solar noon is 14°, and the end points in this plot are at a solar zenith angle of 70° observed in the morning and afternoon. Although it is not apparent from the plots, the dependence is about the same at each wavelength; that is, the ratio of the highest to lowest albedo at each wavelength is about 1.5. Moreover, if we had continued the plot to larger solar zenith angles, this ratio would climb even higher. These data are not shown as the noise in the measurements gets significantly larger as the reflected and downwelling irradiances decrease in magnitude near sunrise and sunset.
The final property of albedo is the subtlest of the three effects. Solar zenith angle at the end points in Figure 9.2 in the morning and evening are the same, but the reflectances are slightly different. This is best detected at the longest wavelengths, but is present at all wavelengths. A dashed vertical line denotes solar noon. It is clear, at the longer wavelengths at least, that the lowest albedo is displaced to a time after solar noon. The reason for this asymmetry is unclear: It may be morning dew on vegetation that reflects more (Minnis, Mayor, Smith, and Young, 1997), it may be the orientation of the vegetation by the prevailing wind, or it could be a changing partitioning of the diffuse and direct sunlight throughout the day, which will be discussed later.
While useful spectral information is gleaned from Figure 9.2, more spectral coverage with higher spectral resolution allows an examination of the adequacy of discrete spectral sampling of surface albedo. The data to calculate albedo in Figure 9.3 were taken with a portable spectrometer, the LI-COR LI–1800. This instrument, whose manufacture was discontinued in 2003, takes 30 seconds to acquire continuous spectral data with 6 nm resolution between 330 and 1100 nm. The data in Figure 9.3 were acquired in three locations from a height of about 1.5 m above ground level under a 10 m albedo tower on Table Mountain, 12 km north of Boulder, Colorado, which is used for continuous measurement of spectral albedo at the same wavelengths as in Figure 9.2. The three sample areas were chosen to represent the extremes in visual diversity of vegetation under the tower. The measurement sequence was to move quickly to acquire downwelling measurements before and after an upwelling measurement. The two downwelling measurements were averaged and divided into the upwelling measurement to calculate albedo. Irradiance conditions were stable with the sun high in the sky and only a few clouds on the western horizon. The 10 m tower site was surrounded by some grasses that were green, although past their peak, cheat grass (Bromus tectorum) that was well on its way to senescence, some taller succulent bushes, and a few exposed rocks, but no bare soil. From Figure 9.3, it is clear that albedo is a smooth function over most of these wavelengths. The noisy albedo values in the ultraviolet are caused by very low upwelling irradiance and losses in the fiberoptic cable that is used to transfer sunlight to the LI–1800 spectrometer. Some notable features are the peak near 550 nm, the sharp rise beyond 700 nm, and the absorption band near 1000 nm. The peak spectral albedo over the PAR region occurs because the predominant absorption features are in the blue and red regions of the spectrum, giving a green reflective peak as a result. The rise in spectral albedo beyond 700 nm was discussed earlier, but the sharpness of the increase is clearly illustrated in Figure 9.3. Liquid water in the plants causes the absorption band around 975 nm (Pu, Ge, Kelly, and Gong, 2003). The gray arrows indicate the central wavelengths of the spectral measurements made in Figure 9.2.

FIGURE 9.3 Three measurements of spectral albedo made using a spectrometer under a 10 m albedo tower. The measurements were chosen to examine the visual extremes under the tower. Clearly, there are only subtle differences. The notable features are the peak at 550 nm, the sharp rise near 700 nm, and the liquid absorption in plants near 975 nm.
Although Figures 9.2 and 9.3 represent albedos from different locations on different days, they are typical of growing vegetation. Their spectral dependencies, in fact, closely match if we consider the high sun (low solar zenith angle) albedos in Figure 9.2. The only exception is that the 940 nm albedo in Figure 9.3 slightly exceeds the 870 nm albedo, while in Figure 9.2 the opposite is true. This suggests that even with sparse spectral sampling, using the six wavelengths of Figure 9.2, and knowledge that the surface was vegetative, the continuous spectral dependence over the 330–1100 nm region in Figure 9.3 could be approximated with some confidence that one had captured the general spectral behavior. Obviously, the details would not be uncovered without the higher spectral resolution data. McFarlane, Gaustad, Long, Mlawer, and Delamere (2011) developed a technique for approximating the continuous albedo using discrete spectral measurements and information on the surface type and state.
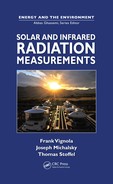
Figure 9.4 illustrates the change in albedo as vegetation transforms from vigorous growth to complete senescence. The discrete measurements were taken at the SGP site in Oklahoma that was described in the beginning of this section, and continuous albedo spectra were estimated using McFarlane et al.’s (2011) method, for four different times of the year as listed in the legend of Figure 9.4. The first measurements on May 14 were over green pasture and a green wheat field. The next measurements on June 8 showed the grasses and wheat still green, but they were beginning to dry and the wheat ripening, respectively. By July 14 the wheat was harvested and the grasses showed almost no hint of green. Also, a portion of the surface measured under one of the two towers had been tilled resulting in a surface of exposed soil. On October 11 the surfaces were dead grasses and weeds. Figure 9.4 illustrates the changes in albedo with the clearest green peak and highest near-infrared reflectance on May 14. The green peak is less distinct and the reflectivity in the near-infrared lower by June 8. After harvest on July 14, there is only a slight red gradient after 700 nm. By October 11 the only spectral signature is the monotonic increase with wavelength.
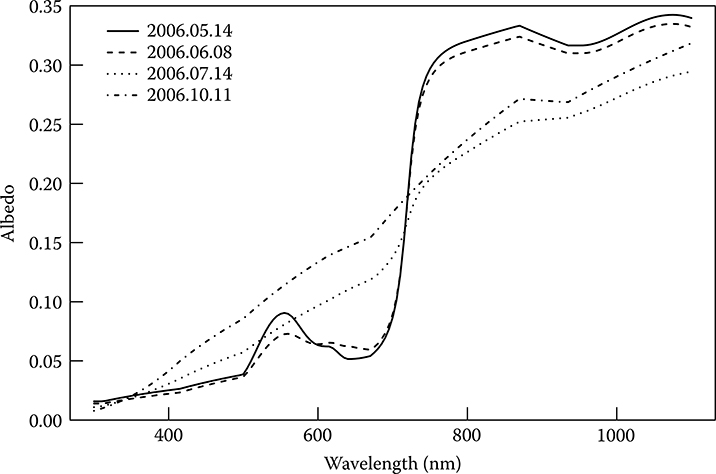
FIGURE 9.4 Illustration of how the spectral albedo of vegetation changes from the vigorous growth stage through senescence and death. The peak at 550 nm and the sharp rise near 700 nm disappear.
In Figure 9.5 the albedos of four distinct soil samples are examined. Dirt is not dirt. Soil does not look the same to our eye, and, indeed, it does not look the same spectrally. Bowker et al. (1985) pointed out two of the spectral features of soils in the 300–1100 nm spectral region that depend on their organic content and on their iron content. Even when organic and iron content is low, there are some general differences that depend on water content and the specific mixture of sand, clay, and silt. In Figure 9.5 the line labeled “dry soil” has both the organic feature that shows higher reflectivity starting at about 0.55 µm. Iron absorption is the broad feature in the 0.9–1.0 μm area. The other soil albedos are monotonically increasing with wavelength with no distinct features. The wet sample has lower overall reflectivity, but is higher than black loam until around 0.7 μm. The samples labeled “soil” and “black loam” are similar, but they show different slopes with wavelength. Note that these three soil samples resemble the wavelength dependence of the dead vegetation albedo on October 11, 2006, in Figure 9.4.
The final class of examined surfaces is the snow-covered surface. Determining the reflectivity of snow is challenging because albedo changes with the condition of the snow. Newly fallen fine snow has an extremely high albedo as shown in Figure 9.6. Granular or corn snow gives the next highest reflectivity, and melting snow shows high reflectivity but less than the other two conditions. Clearly, snow has little spectral dependence in the ultraviolet (UV) and visible, but begins to indicate absorption in the near-infrared wavelengths.
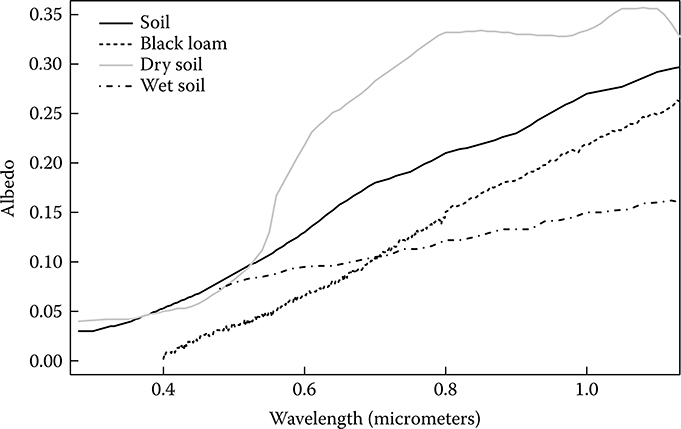
FIGURE 9.5 Albedos for four different soils from Bowker et al. (1985). Note the sharp rise near 500 nm due to organics and the depression center near 950 nm due to iron in the dry soil albedo spectrum. The other samples are monotonically increasing at different rates. (From Bowker, D. E., R. E. Davis, M. L. Myrick, K. Stacy, and W. T. Jones, Spectral Reflectances of Natural Targets for Use in Remote Sensing Studies, NASA Ref. Publ. 1139, 1985.)
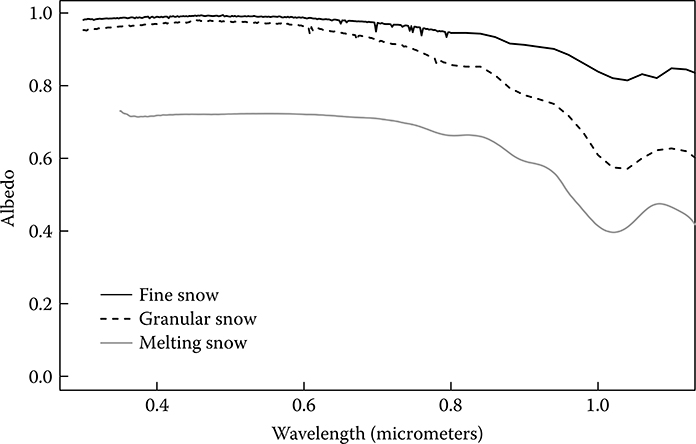
FIGURE 9.6 The albedo of snow depends on how recently it was deposited on the surface. The older the snow, the less reflective it is. As it starts to melt there is a noticeable drop in reflectivity. The visible spectral dependence is almost uniform, but the solid ice absorption starts to be a factor beyond 800 nm.
9.4 Bidirectional Reflectance Distribution Function
Nicodemus (1965) defined the term bidirectional reflectance distribution function (BRDF), which describes how radiation that is incident on a surface will scatter from that surface as a function of the angle of incidence and as a function of the angle to which it is reflected; these angles are defined with respect to the normal to the surface. In Figure 9.7 the incident solar radiation direction is defined by two angles: (1) the angular distance from the zenith; and (2) an azimuth angle referenced to a fixed direction. The reflected radiation is defined by zenith and azimuth angles that are, in general, different from the incident angles. As the solar zenith angle increases from the normal, the reflection increases giving a higher albedo for the direct sunlight that is reflected; the BRDF integrated over all angles is the albedo for the direct solar radiation. This albedo is also known as the black-sky albedo. This increase with increasing zenith angle is primarily responsible for the increases in morning and evening albedos in Figure 9.2. The other contribution to the albedo is from the skylight that is reflected from the surface; this albedo does not change appreciably throughout the day. The scattered sunlight albedo is called the white-sky albedo. The total albedo changes with the solar zenith angle and, therefore, depends on the partitioning of the DNI and DHI.
Why does the white-sky albedo remain approximately constant throughout the day? This was discussed in Chapter 6 on diffuse measurements but is repeated
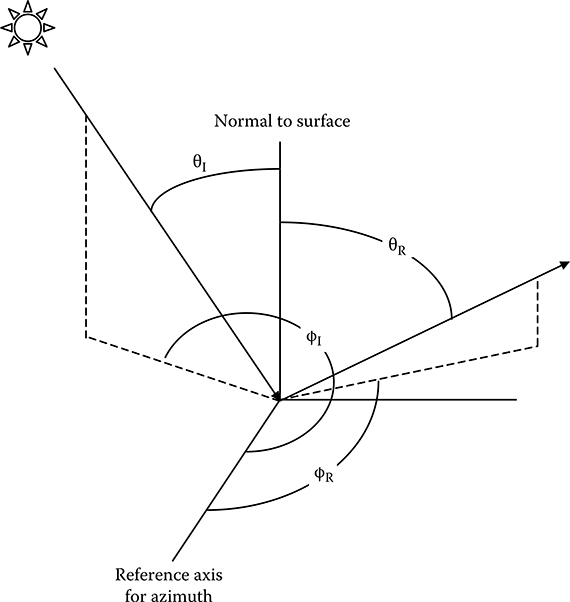
FIGURE 9.7 Bidirectional reflectance from a surface depends on the incident angle and azimuth of the incoming light and on the reflectance angle and azimuth from which this reflected light is viewed.
verbatim here. If skylight radiances were isotropic, that is, uniform in all directions, then the diffuse irradiance falling on a horizontal surface could be calculated as
where R is the constant radiance of the isotropic sky. The term sin(θ)dθdϕ comes from spherical geometry that defines the radiance from every direction over the sky dome, and the cos(θ) term comes from the assumption that the surface receives radiation with an exact cosine response. Since 2sin(θ)cos(θ)=sin(2θ), it is clear that the largest contribution to the diffuse irradiance is from the annulus near 45° and falls monotonically and symmetrically to zero at 0° and 90°. This means that the effective angle of incidence for diffuse radiation (DHI) is 45°, which does not change throughout the day for isotropic skies. However, skylight is not strictly isotropic but has contributions from all parts of the sky, especially horizon-brightening and circumsolar radiation; however, the effective incident angle for diffuse is never far from the nominal 45° and changes little throughout the day.
Measuring the white-and black-sky albedos separately under clear-sky conditions is difficult. However, a reasonable estimate of the black-sky albedo can be obtained from the measurement of albedo and irradiance on cloudy-sky and clear-sky days that occur just a few days apart. The measurements need to be separated by no more than a few days so that the surface does not change appreciably between the measurements. The estimate of the black-sky albedo is based on the reasonable assumption that the cloudy-sky albedo is about the same as the clear-sky albedo. With measurements of direct sunlight and diffuse skylight on the clear day and diffuse skylight on the cloudy day, the white-sky albedo on the cloudy day can be calculated and can be used to subtract the diffuse skylight albedo on the clear day to derive the black-sky albedo on the clear day. In equation form
Where the up arrow indicates reflected irradiance and the down arrow indicates downward irradiance.
9.5 Albedo Measurements
9.5.1 BROADBAND ALBEDO
Broadband albedo measurements are best made with two broadband pyranometers of the same make and model mounted with one looking upward and one looking downward (see Figure 9.1). It is important to use a pyranometer with a good cosine response for the downwelling measurement. It is less critical for the upwelling (reflected) measurement. For both instruments the horizontal alignment is critical, especially for the low sun angle albedos where direct beam radiation could be detected in the upwelling measurement if alignment is not adequate. A shade ring around the upwelling pyranometer should be used to ensure that direct sun is never able to irradiate this pyranometer. Figure 9.8 illustrates the solar shading used in SURFRAD for all of their installations; this is at the Sioux Falls, South Dakota, site with the solar measurement on the right, which is the south side of the tower. The instrument on the left, which is also shielded, is for the upwelling infrared. For the albedo measurement the typical shield used for downwelling measurements is not used, and the inner shield is painted with flat black paint to reduce scattered solar light from the inside of the shield. The height chosen for the albedo measurements for the SURFRAD sites is 9 m. The height of the albedo measurement should be chosen so that the surface area seen at 45 degrees to the nadir direction represents the surrounding surface area. This is important since the highest contribution to the upwelling radiation is from this direction. However, that said, it is best if the area under the measurement is similar out to about four times the measurement height.
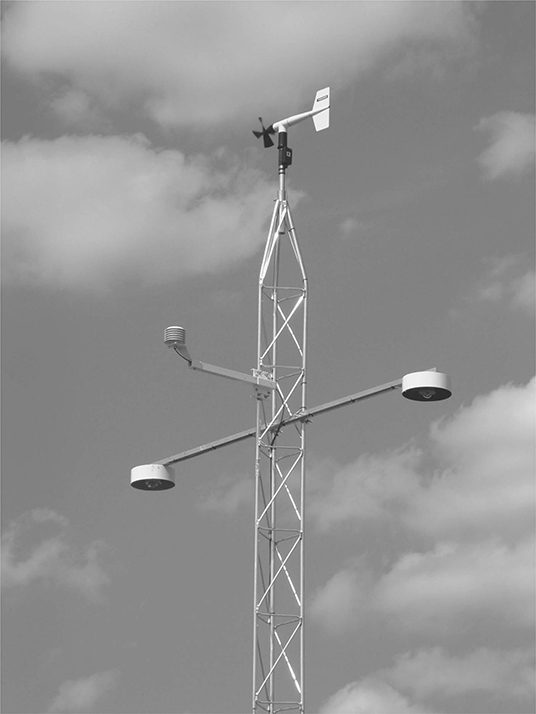
FIGURE 9.8 (See color insert.) Photograph of the SURFRAD albedo tower near Sioux Falls, South Dakota. Note the shields that ensure the direct sunlight will not reach the upwelling detector even for minor horizontal leveling errors.
An ideal albedo measurement would be made using one instrument rotated to periodically face upward and downward to guarantee the same broadband spectral response. Of course, the downwelling solar radiation would need to be stable during this measurement sequence and the time-response of the pyranometer would need to be consistent with the data acquisition intervals.
If these instruments were to be used only for albedo measurements, the only calibration needed would be to force their agreement when both are pointed upward since albedo is a relative measurement. This ideal measurement ignores one important point: the thermal offset issue. For the pyranometer used to measure upwelling irradiance, the thermal offset is almost absent. When it looks at the clear sky, the thermal offset is negative and must be corrected as discussed in Chapter 4 and Chapter 5.
9.5.2 SPECTRAL ALBEDO
Spectral albedo is becoming more important for climate science and satellite remote-sensing research; however, there are few options for all-weather measurements. As seen in Figure 9.3 through Figure 9.6, the spectral behavior of albedo varies greatly, but high spectral resolution is not necessary to capture the key features of the wavelength dependence. Because the wavelength dependence is not highly structured like the solar spectrum, it is possible to judiciously sample the albedo spectrum with discrete filters and interpolate, for example, using the technique described in McFarlane et al. (2011). The Yankee Environmental Systems, Inc. seven-channel rotating shadowband radiometer (MFR–7) is an all-weather instrument that can be used for the discrete filter measurement in the visible and near-infrared. For UV filter measurements there are several choices including the NILU-UV (NILU Products AS), the GUV–511 and GUV–541 (Biospherical Instruments, Inc.), and the UVMFR–7 (Yankee Environmental Systems, Inc.). The EKO Instruments Co., Inc. MS–700 is an all-weather grating spectrometer that measures between 350 and 1050 nm with continuous resolution of 3.3 nm. None of these instruments measure beyond 1100 nm, and commercial all-weather instruments that measure beyond 1100 nm do not currently exist. In purchasing these instruments, response stability (2% per year), temperature control (±2°C) or correction, and cosine response (better than 10% out to incidence angles of 80°) are the most important qualities to consider.
Questions
How is the broadband albedo of a surface measured?
Are albedos wavelength independent; that is, are they the same at all wavelengths? Name a surface whose albedo is almost wavelength independent in the visible between 400 and 700 nm.
Does the white-sky albedo change with sun angle? Does the black-sky albedo?
Which surface type shows the greatest spectral diversity? A field of alfalfa? A field of wheat stubble?
What would cause the ocean surface albedo to become higher?
Can you think of a way to measure albedo quickly with a single sensor?
References
Ackerman, T. and G. M. Stokes. 2003. The atmospheric radiation measurement program. Physics Today 56:38–45.
Augustine, J. A., J. J. DeLuisi, and C. N. Long. 2000. SURFRAD—A national surface radiation budget network for atmospheric research. Bulletin of the American Meteorological Society 81:2341–2357.
Bowker, D. E., R. E. Davis, D. L. Myrick, K. Stacy, and W. T. Jones. 1985, June. Spectral reflectances of natural targets for use in remote sensing studies. NASA Reference Publication RP–1139. NASA Scientific and Technical Information Branch.
McFarlane, S., K. Gaustad, C. Long, E. Mlawer, and J. Delamere. 2011. Development of a high resolution spectral surface albedo product for the ARM Southern Great Plains Central Facility. Atmospheric Measurement Technology, 1713–1733.
Minnis, P., S. Mayor, W. L. Smith, Jr., and D. F. Young. 1997. Asymmetry in the diurnal variation of surface albedo. IEEE Transactions on Geoscience and Remote Sensing. 35:879–891.
Nicodemus, F. 1965. Directional reflectance and emissivity of an opaque surface. Applied Optics 4:767–775. doi: 10.1364/AO.4.000767
Pu, R., S. Ge, N. M. Kelly, and P. Gong. 2003. Spectral absorption features as indicators of water status in coast live oak (Quercus agrifolia) leaves. International Journal of Remote Sensing 24:1799–1810.
Stokes, G. M. and S. E. Schwartz. 1994. The atmospheric radiation measurement (ARM) program: Programmatic background and design of the cloud and radiation test bed. Bulletin of the American Meteorological Society 75:1201–1221.
Yang, F., K. Mitchell, Y.-T. Hou, Y. Dai, X. Zeng, Z. Wang, and X.-Z. Liang. 2008. Dependence of land surface albedo on solar zenith angle: Observations and model parameterization. Journal of Applied Meteorology and Climatology 47:2963–2982. doi: 10.1175/2008JAMC1843.1
Zygielbaum, A. I., A. A. Gitelson, T. J. Arkebauer, and D. C. Rundquist. 2009. Non-destructive detection of water stress and estimation of relative water content in maize. Geophysical Research Letters 36:L12403, 4 pp. doi:10.1029/2009GL038906