
14 Setting Up a Solar Monitoring Station
The question always arises as to the true reliability of any measurement performed with an instrument under different conditions than those of the calibration.
John R. Hickey
(1970)
14.1 Introduction
Considerable planning and forethought should go into the design and layout of a solar monitoring station. Initial considerations should identify project goals and data accuracy requirements for the project. Once the basic parameters for the solar monitoring station are established, it becomes easier to select between various design options. The optimum site specifications and location, instrument selection, data acquisition system functions, and the operation and maintenance requirements for the measurement equipment all directly affect the quality of the data that will be produced. Budget constraints and continuity of funding for station operation and maintenance are also important. Specifically, high-performance (expensive) instrumentation should not be considered if the project resources are insufficient to support the maintenance and calibration schedule recommended by the sensor manufacturer and to purchase auxiliary supporting equipment necessary to obtain the accuracy specified. A well-chosen, designed, and constructed solar monitoring station will enhance the quality of collected data and help minimize the time and effort necessary to service the station and validate the data. Three factors usually dictate the location of a solar monitoring station: (1) a clear field of view (adequate solar access); (2) proximity to a site operator who will maintain the station; and (3) most importantly, the requirements of the station sponsor who will rely on the data.
While the main focus of this book is to characterize the instruments used in measuring solar and infrared irradiance, the resulting data are only as good as the station installation, operation, and maintenance allows. To expand on the limited number of publications available on this topic (McArthur, 2005; Stoffel et al., 2010), this chapter discusses many of the details necessary to locate, construct, and maintain a quality solar and infrared radiation monitoring station. Specifically, this chapter discusses factors to consider in choosing a site and determining the requirements for the data-logging system. Maintenance of the station is described along with best practices for cleaning the instruments and creating standard procedures to record station maintenance. The importance of viewing the data on a regular basis is discussed along with other quality control measures. Next, suggestions for field calibrations of the radiometers are presented. Finally, examples of solar monitoring stations are shown.
14.2 Choosing A Site
Often the general location of the solar station is selected to fill certain requirements, such as providing data for a solar electric facility or characterizing the climate for a specific ecosystem. However, just as important, and maybe more so, is the ease of access and maintenance. If the station is located close to the person responsible for servicing the instrumentation and the measurement system, the maintenance can be performed on a more regular basis. Access to electricity and to remote communication is important, although photovoltaic panels, cellular modems, and satellite data links can provide sufficient power and communications to even the remotest stations.
Before selecting a location for the monitoring station, it is important to identify the person or group who will maintain the station. Working with the station maintenance personnel, the potential locations with the best field of view as well as optimum maintenance access and security should be identified. It should be noted that finding a location that is totally unobstructed as the sun moves across the sky throughout the year is difficult. Trees, buildings, and power poles are among the many structures that present problems. To identify the significance of the problem and to compare potential locations, it may be useful to obtain a sun path diagram for the site under consideration and take the diagram out to the location under consideration. Sun path diagrams are discussed in Chapter 2 and can be created using the Sun Chart Program from the University of Oregon (http://solardata.uoregon.edu/SunChartProgram.php). Sun path charts for every 10° of latitude are provided in Appendix C. Use a compass to locate magnetic north, and make the magnetic declination corrections so that the sun path diagram can be aligned facing the equator (south in the northern hemisphere and north in the southern hemisphere). A horizontal plot of the obstructions can be made with the compass and clinometer to mark the location and angular height of the obstructions. There are tools available that can take photographs of a location and superimpose sun path charts on the panoramic image of the site. These tools are designed for siting solar systems, and, while they can be used to quickly identify obstructions, they do not necessarily produce accurate enough obstruction height information near the horizon (Figure 14.1).
To simplify descriptions for the rest of this chapter, it will be assumed that the station is located in the northern hemisphere. For stations in the southern hemisphere, switch the terms north and south. During the summer you will notice that the sun will rise and set somewhat behind you if you are facing the equator. The farther away from the equator the site is located, the farther behind one’s back the sun will rise or set during the summer months.
A site with no obstructions higher than 5° above the horizon is ideal, but sites with obstructions up to 10° are acceptable, especially if the obstructions do not block the sun’s path. Sometimes obstructions cannot be avoided, such as nearby hills or trees. If at all possible, keep obstructions out of the sun’s path and as far back (north) as possible from the east–west axis. If the obstructions are behind the site, they will not block the sun’s path during the winter when the sun is lowest in the sky. If there is an obstruction that is not too tall (e.g., less than 15° above the horizon) or wide, then it may be possible to locate the station so that the obstruction is directly south of the station. Study the sun path chart, and make sure that the sun passes over the Setting Up a Solar Monitoring Station obstruction during the winter months. If the structure is too tall, it may be necessary to move the station farther east or west to avoid shading as much as possible.
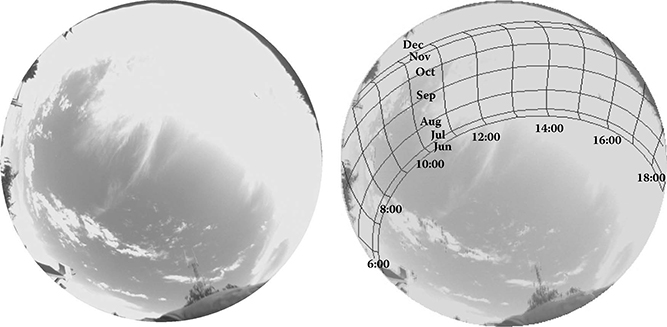
FIGURE 14.1 Image of Ashland, Oregon, station using the Solmetric Suneye. The Suneye first takes a fisheye view of the station, shown on the left-hand side of the image, and then places a grid of the path followed by the sun during different times of year, shown on the right-hand side of the image. Local standard time is given in the image. Objects on the horizon that block the sun’s path are then analyzed, and the percent of the shaded area is then calculated.
Trees can be a particular problem for solar-monitoring sites. Trees grow, and while they may not block the sun path at first this may not be the case several years later. Therefore, it is prudent to know future plans for development near the site. Sometimes the station can be mounted on a raised platform or a rooftop to avoid blockage by some local obstruction. If the station is located on the roof of a building, adequate and safe access to the equipment should be incorporated into the design.
Some solar stations are located near meteorological towers that are used to monitor the wind resource. It is important to locate the station to the south of such towers and to make sure the tower is not highly reflective. In fact, any object that is likely to reflect light toward the pyranometers should be removed or painted with a flat black, gray, or nonreflective coating.
Some stations are located in areas that are subject to snow and snow drifts. The solar-monitoring stations should be located high enough above ground to avoid direct reflections from the snow and should be constructed so that minimal snow accumulates on the platforms around the pyranometers and other instruments. Nonconductive gratings used for walkways can make useful platforms. If the temperature gets cold enough, enclosures containing the data logger or other equipment may need electrical heaters controlled by thermostats.
The equipment in the boxes should be mounted so that moisture from condensation cannot drip on electric connections. If appropriate, desiccant packs can be used to help keep sealed boxes dry. Sometimes “Weep Holes” at the base of the enclosure are used to let the condensate drain freely. Electrical connections to the boxes should be laid in conduit or contain a drip loop so that water will not run down the cables and into the electronics box. Signal cables and power cables should be separated as much as possible to avoid electrical interference with the instrument signals.
While most snow is easy to dust off the domes of pyranometers, ice is a different story. Do not chip the ice off the pyranometer dome or diffuser. Sometimes alcohol can be used to melt the ice from a glass dome, but alcohol should not be used on white (acrylic) diffuser disks. Other times, a warm hand on the dome or disk will melt the ice. A sponge soaked in warm water can also help. Hot water should be avoided because too large a temperature differential might break seals, crack the glass, or cause other damage to this important optical element of the pyranometer or pyrheliometer.
14.3 Grounding and Shielding
A solid electrical ground is important for lightning protection and signal noise protection. For most areas, a copper-coated steel ground rod 1.5 to 3 meters in length is sufficient for grounding. The ground rod is typically between 10 and 20 millimeters in diameter. To drive the ground rod into dirt, a heavy metal pipe with an end cap can be used. For areas of frequent lightning strikes, a more robust grounding strategy might be needed. For more detailed information on grounding and shielding see Morrison (1998).
All masts and metal poles should be grounded to allow an easy path for lightning to follow to ground. A lightning finial is often recommended for areas subject to more frequent lightning strikes. Surge protectors such as metal oxide varistors or avalanche diodes can be used for lightning protection. These surge protectors degrade over time, and manufacturers’ recommendations should be followed when determining when these surge protectors need to be replaced.
Sensitive equipment usually has a ground lug that can be used for grounding. A 10 or 12 gauge wire (AWG units) with 2.6 mm to 2.0 mm diameters, respectively, should be used for connecting the equipment to the central grounding point.
Twisted pair shielded cable should be used for low-voltage signals and should be connected as a differential measurement at the data logger. By isolating the signal low from ground, some of the noise can be avoided. The shield should be connected at one end to the ground and should be left unattached at the other end to prevent ground loops. Signal cables should also be physically isolated from power cables, and if they have to cross they should cross at right angles to minimize any induced signals.
14.4 Data Logger and Communications
Many data-logging systems are available; however, it is important to have data loggers that can withstand field environmental conditions for many years without changing their electrical specifications and maintaining their specifications over the range of temperatures experienced at the station. Providing a temperature-controlled enclosure should help to reduce the subtle effects caused by temperature drift, but this increases the electrical power requirements for the system. A good outdoor data logger should be able to maintain specifications for the temperature ranges expected at the measurement site.
The clock on the data logger should have minimal drift. Some data loggers now have auxiliary global positioning systems (GPSs) that automatically maintain the clock accuracy. This should be considered for any new station, especially those that sample with high frequency such as every second. Some data loggers come with software that will automatically synchronize the data-logger clock with the computer clock. If that is the case, then one must ensure that the computer clock is correct and doesn’t experience drifts. Coordinated Universal Time (UTC) and local time in the United States can be found at http://www.time.gov, and either is recommended for data logging. Daylight saving time is not recommended. Sometimes it is better to monitor the data logger time and change it only if it has drifted more than one or two seconds since the previous check.
The data logger should be selected to have enough analog inputs, voltage excitation sources, and control ports to handle the number of sensors being installed at the site. Plan to have room for additional instruments. Over time, requirements change, and it is helpful if data loggers don’t have to be changed to accommodate additional measurements. Some data loggers come with auxiliary multiplexers to handle additional channels of data.
The amount of storage in the data logger is an important consideration. The more frequent the sampling and the greater the number of instruments, the greater the amount of storage required to ensure continuous data reporting. The data storage should be sufficient to account for the longest time between data transfers by a central computer.
Data loggers should be able to handle a variety of inputs. Some anemometers generate pulses that need to be counted, temperature sensors require a reference voltage, and many pyranometers need data loggers that can measure with μV precision. Make sure the data logger can handle the signals from the sensors being chosen and from sensors that might be needed in the future.
Accuracy and linearity of the data logger is important and should be better than the sensors being installed. Data loggers with a 0.5% accuracy or better are needed to avoid adding to the measurement uncertainty of the data.
It is important to be able to communicate with and download data from the data logger. It is very helpful if the data logger can be queried remotely and the data logging routines can be changed from a central location. Remote communication enables troubleshooting from the central office where technical expertise is available. Communications can be through a phone modem, Internet, cellular phone, satellite phone, or use of special communication networks. Over the long-term, communication costs can add up, and it is important to be able to change to new methods as they are developed. For ease of access, Internet communication is best, but simple phone modems are very reliable if a phone line is available. One should calibrate the data logger periodically, just as the radiometers should be calibrated. This helps ensure the quality of the data and also helps spot potential problems.
Power failures should be expected in the field, even if the system is connected to the utility grid. The data logger should have a battery backup system and should be able to automatically recover data and programs if the power outage drains the battery. It is very helpful if the data logger draws only small amounts of power. This minimizes the size of the backup power needed and provides for the opportunity to use photovoltaic (PV) panels for the power source.
Software packages that come with the data logger are useful, but the software should be able to output data from the logger in a format that is readable to a wide variety of computer programs or comes with a translator that can export the data to an ASCII file.
With solar irradiance measurements, the ideal would be to have the sensor read continuously over the time interval. This would yield an integrated average of the sensor being read. The practical alternative is to have the sensor read at very short intervals of a second or two and these readings averaged over the time interval of interest. If one is interested in the variance of the irradiance over the time interval, it would be necessary to have a data logger that could record the standard deviation of the measurement over the time the measurement is averaged. Similarly, recording the maximum and minimum signal during the averaging period can provide useful information.
Other factors to consider are the complexity of programming the data logger, readable and informative instruction manuals, and a quick response to requests for assistance with problems. The data logger is a key component, and reliability and backup are needed to make the data set as complete as possible.
14.5 Measurement Interval
Choice of time interval for the measurements is often specified by the requirements of the user of the data. For example, many electric utilities use 15-minute readings for their power monitoring. However, irradiance data has many uses, and where one time interval is preferred by one user another time interval may be preferred by another. With shorter interval data, one can always sum or average into longer time intervals, but one cannot take a 15-minute data set and divide it into a 5-minute data set without introducing additional uncertainties.
Lately, there has been interest in 1-minute or shorter time interval data. With short time intervals one must look at the sensor’s response time, and unless one is examining the response time of a sensor the time intervals chosen should be long enough so that the sensor can provide an accurate measurement integrated over the time period (McArthur, 2004). Storing data in 10-minute intervals should be avoided because the data will not divide evenly into the utility standard of 15 minutes.
Note that most satellite-derived data come from images that are analyzed each half-hour, and the timing of the images does not necessarily fall on the hour or half-hour mark. The older GOES East geosynchronous orbit weather satellite produces images of the northern hemisphere 15 and 45 minutes after the hour. The GOES West geosynchronous orbit weather satellite produces images of the northern hemisphere on the hour and 30 minutes after the hour. To validate models that use satellite images to estimate solar data, the time sampling interval for ground-based measurements should be sufficiently short that it captures the data at the point in time when the satellite image is taken (Wilcox and Marion, 2008). Ground-based solar data integrated over 5-minute intervals around the time the satellite images were taken would provide a better comparison to the solar data derived from the satellite images than ground-based data taken at 15-minute or hourly intervals.
Some data loggers and computers will automatically change from daylight saving time to local standard time (LST) and vice versa. However, it is best to record data in either local standard time or UTC. Keeping the same time year round means that the data files can be continuous and don’t have the jumps associated with daylight time. The matter of consistent data record time stamping is important for accurate solar position calculations needed for data quality assessment.
UTC relates global time to an atomic clock standard. GPS, computer time, and other equipment times are related to UTC time. The advantage of UTC is that it is the same throughout the world; the disadvantage is that the 24-hour UTC day divides the local solar day over two-day boundaries at many locations. LST is best for small networks and local data, especially if the data are to be accessed by the general public. UTC time will be found with larger databases or with satellite-derived data sets.
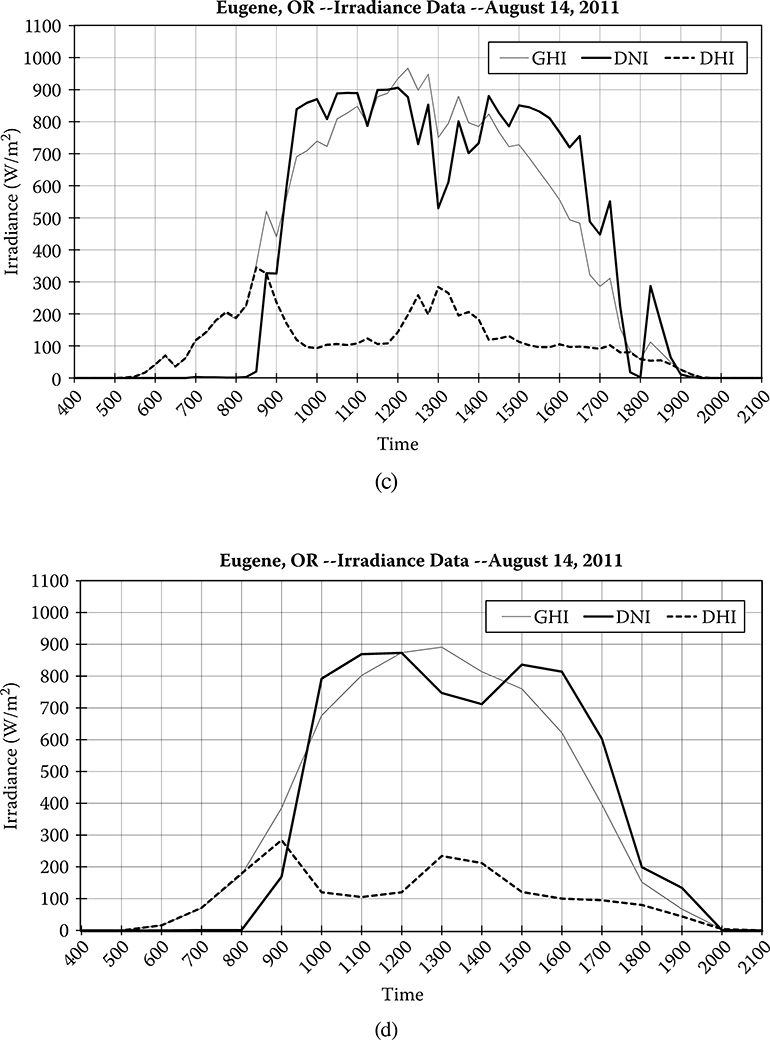
The granularity of the data (time interval) affects the precision to which changes in the solar irradiance can be perceived. Short time intervals can help in spotting problems with the data such as reductions in the output when the instrument is cleaned. Data applications dictate the maximum time interval needed for recording. A sample plot of 1-minute, 5-minute, 15-minute, and hourly data is given in Figures 14.2a–14.2d. Note that as the time interval increases, the information on the variability in the data becomes more and more obscured.
14.6 Cleaning and Maintenance
High-quality pyranometers require minimal maintenance other than cleaning the dome on a regular basis and making sure the desiccant does not become saturated with moisture. It should be months to a year between desiccant changes for a properly assembled pyranometer. If the desiccant needs to be changed more often, that is usually an indication that a seal has developed a leak (typically at the desiccant chamber/body interface). Gel desiccants that change color when they absorb moisture are recommended because they do not leave dust that is associated with some desiccants (calcium chloride should be avoided). The dust from a desiccant can travel to the surface of the sensor or to the inside surface of the dome, thus affecting the responsivity of the pyranometer. Occasionally, the rubber O-rings sealing the desiccant holder will need to be greased to keep from drying out and cracking. Grease that is used for O-rings on vacuum pumps works well as it does not outgas when heated and leave a residue inside the pyranometer.
Moisture, frost, or snow also blocks or scatters incident solar radiation. While dust may build up slowly over time and regular cleaning can minimize the effects of dust, frost or snow can affect the instrument immediately. A ventilator will keep most frost and light snow off a pyranometer while minimizing the accumulation of dust. Of course, heavy snow can accumulate on the shield or around the ventilator, so the platform should be constructed so that snow cannot accumulate around the instruments, for example, by mounting instruments on a grate.
Pyrheliometers are more susceptible to the effects of dust or moisture. A little dust or a drop of moisture on the instrument window can scatter the incident irradiance so that it does not reach the detector. For the most accurate results, the window of the pyranometer should be cleaned on a daily basis, or no less often than twice each week. This depends, of course, on the environmental setting of the measurements and time of year. It is important to note on a log sheet when the instruments were cleaned.
To clean the instrument windows or domes, distilled water is the preferred cleaning agent. Ethyl alcohol (ethanol) may be used in icing conditions, although if the temperature is above freezing during part of the day it is better to wait and clean with distilled water. Overuse of alcohol can cause the seals to dry out and crack. Cracked seals can allow moisture to enter the instrument and degrade the measurements. If alcohol is used, 95% alcohol should be used because the other 5% is water. With 99% alcohol, other chemicals are present that enable the purity to reach 99%. These chemicals may leave a residue. A lint-free cotton cloth or paper products designed for cleaning optical surfaces should be used to clean the radiometers. Any lint or substance left behind affects the performance of the instrument. If a cotton cloth is used, it should be laundered frequently to prevent grime from accumulating. It is also possible to use a can of pressurized air to dry the dome to avoid the microscopic scratching from rubbing the dome with a dry cloth. Be sure that the spray can does not have an oil-based propellant or other chemicals that can coat the surface of the window or dome.
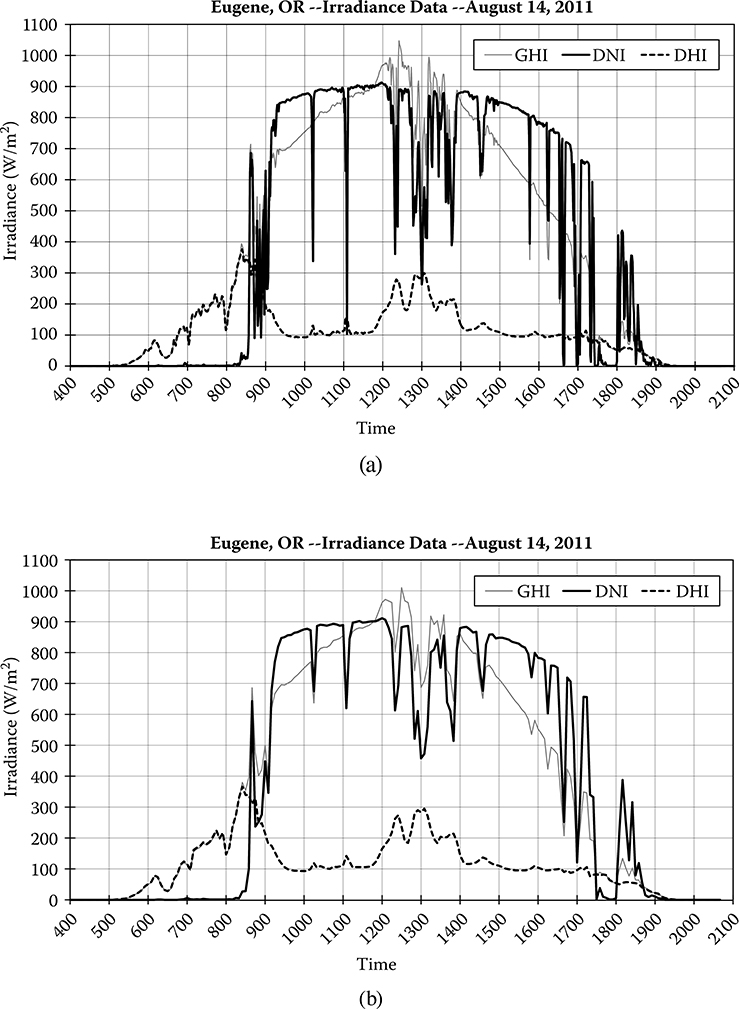
FIGURE 14.2 Plots of GHI, DNI, and DHI on August 14, 2011, at time intervals from (a) 1 minute, (b) 5 minutes, (c) 15 minutes, and (d) 1 hour. Information on the variability of the irradiance data becomes more and more obscured as the averaging time interval of the data increases.
Occasionally, chemicals from rainwater or treated water form a film on the instrument that cannot be cleaned by water or alcohol. A little vinegar should remove these water stains. A little cesium oxide that is used for polishing mirrors can be used to remove stubborn stains as a last resort. If the window or dome becomes scratched or pitted, a substitute instrument should replace the damaged instrument and the window or dome should be replaced or the instrument should be taken out of service.
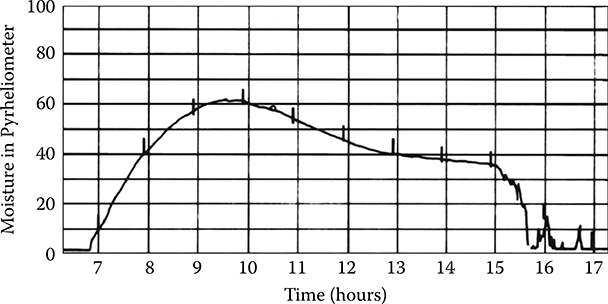
FIGURE 14.3 Plot showing the DNI over the day from a pyrheliometer in which moisture has condensed on the window. This is typical behavior. Often when this happens, one can see moisture on the inside of the window, especially after it has just been cleaned.
On some older models of pyrheliometers, the seal around the window can crack and moisture can enter the instrument. If moisture gets into the pyrheliometer, the data begin to show strange behavior, especially if there is enough moisture to condense on the inside of the window. An example of the effect of moisture in the pyrheliometer is shown in Figure 14.3. When cleaning the instrument, if moisture can be seen condensed on the window then the instrument should be removed for repair.
Many pyranometers contain a desiccant to keep moisture from building up inside the instrument. The desiccant should be checked each time the instrument is cleaned. Usually a quick glance will show if the desiccant has changed color, indicating the need for replacement.
If the instrument is mounted inside a ventilator, the ventilator should be checked to see if the fan is running and the ventilator has a free airflow. Once a year, the filter below the fan should be cleaned. Dust, mold, and other debris can accumulate on the filter and inhibit the airflow.
At least one site visit a year is recommended for preventive maintenance. During an annual site visit, the wiring should be checked to ensure that cables are not deteriorating. Batteries at the station should also be checked and replaced or recharged if necessary. If cabinets or platforms require painting, this can be done during the visit.
It is important to have a maintenance manual for the measurement station (see Appendix I for troubleshooting hints). This will help people who tend the station know what needs to be done, what to look out for in the way of problems, and how to contact the appropriate person should a problem occur. These manuals can also help in training and can be use to refresh one’s memory if a procedure has not been performed in a while. The manual should contain simple information like how to clean a pyranometer to more complex tasks like setting the clock on an automatic tracker.
Putting together the manual while planning the station is most helpful. Potential issues that might have been overlooked in the initial station design can arise when one is describing how to operate and maintain the station. This helps to document why certain decisions were made and is very useful when other stations are established. Make an electronic version of the manual so that it can be changed and modified as experience is gained with operating the station.
14.7 Record Keeping
Keeping records of maintenance, site visits, instrument serial numbers, instrument calibration, and all activities associated with the station is essential. If there are questions about the data, the records can be examined to see if there were any activities that might explain the questioned data. Carefully maintained records enable one to go back and see when instruments were changed and what calibration numbers were used during particular time periods.
Log sheets should be available for those maintaining the site. They are useful reminders of the daily tasks and help record what maintenance was performed. An example log sheet is shown in Figure 14.4. Table 14.1 lists some information that might be included on the log sheet. NREL is working on an application for a table that would allow the technician to record work with automatic time stamping of each action and photograph the noteworthy observations at the time.
Room on the log sheet should be reserved to record the beginning and end times when the maintenance was performed. In addition, it is helpful to have a list of the solar declination for each day of the year. This is necessary if a fixed shadowband has to be adjusted or a manual tracker is used at the site. It is also useful information when checking the data. It is important to leave room on the log sheets for notes. Unusual events such as birds roosting or flying insects swarming near instruments should be recorded. A digital form of the log sheet should be available and the information on the paper log sheet should be transferred to the electronic database. The NREL Measurement & Instrumentation Data Center (MIDC) online maintenance log can be view at http://www.nrel.gov/midc/apps/maint.pl?BMS. The resulting meta-data records of maintenance findings for each instrument are available as links from the data pages. For example, the maintenance records for the measurement of GHI using a CM22 pyrameter are accessible from http://www.nrel.gov/midc/apps/fmpxml.pl?type=maint;find=Global%20CM22;site=BMS.
14.8 Importance of Reviewing Data
It is helpful to review the data daily. To make viewing the data easier, a routine should be written to plot the data in time series. Data intervals of 15 minutes or less are best for visual inspection of the data. The trained eye can be more precise than computer programs and can usually spot a wider variety of problems. Viewing plots of the data routinely will help spot problems quickly and minimize the amount of bad data that needs to be flagged and possibly eliminated from the database. For example, if there are problems with the alignment of the pyrheliometer, a quick scan of the data will show the problem. Dirt can build on the dome of the pyranometer, and while it may not be easily visible to the eye it will show up as a depression on the plot of the calculated diffuse irradiance (see Figure 14.5). Misalignments of shadow balls or disks

FIGURE 14.4 Sample page from the log sheets used at the high-quality stations in the University of Oregon Solar Radiation Monitoring Network. It is important to note when the person was maintaining the instruments and who did the maintenance. It is also useful to leave room for comments. It is easier to remember all the tasks if the log sheet has a space for each task that should be performed.
TABLE 14.1
Types of Information on a Daily Log Sheet
|


FIGURE 14.5 Plot of GHI, DNI, and calculated DHI on July 1, 2011, in Burns, Oregon. There is dirt on the pyranometer that causes a slight decrease in the GHI values. When subtracting the DNI times the cosine of the sza, the calculated DHI shows bumps. Because the DNI is relatively smooth, the bumpiness of the DHI indicates there are problems with the GHI. The pattern of the bumps for several days confirms the problem with the GHI data. Alcohol was required to clean the thin film that caused this problem.

FIGURE 14.6 Plot of DNI and DHI on May 27, 2011. Raindrops on the front of the pyrheliometer window scatters incoming irradiance. As the rain evaporates, the DNI values return to normal. This phenomenon occasionally occurs when rain is followed by a bright sunny period. Dashed gray line is DNI from a RSP, and the solid gray line is the DNI from an Eppley NIP. The solid black line is the DHI from a disk-shaded Schenk pyranometer, the black dot-dash line is the DHI calculated from the GHI from an Eppley PSP minus the DNI from the NIP times the cosine of the solar zenith angle (sza), and the dotted black line is the DHI calculated from the GHI from a PSP minus the DNI from the RSP times the cosine of the sza. (Courtesy of Eppley Laboratory, Inc.)
can be seen in plots. Any anomaly that occurs in plots is easily spotted. Raindrops on the window of the pyrheliometer will scatter the DNI, and if there is intermittent sun mixed with rain one can sometimes see beam values slowly return to normal values while the sun evaporates the rain from the window (see Figure 14.6).
Some pyranometers’ domes or lenses can have beads of moisture that reflect additional irradiance onto the sensor. This effect is usually small and mostly happens in the morning hours. However, if the pyranometer is part of a rotating shadowband radiometer, the small enhancement in the global measurement will lead to a fairly significant increase in the calculated direct normal irradiance (DNI; see Figure 14.7). For light snowfalls, snow will sometimes melt from the sun-facing side first, and the rest of the snow will act as a reflector and concentrate the sunlight onto the sensor disk. The enhanced global horizontal irradiance (GHI) can show up clearly when plotted.
Obstructions blocking the sun also show up on clear days. If a dip shows up in the same spot over several clear days, it is likely to be caused by an obstruction. In summary, there are many ways of checking the data using plots that can be useful, and while it does take a little time, a better, more complete data set will result.

FIGURE 14.7 Plot of 1-minute RSP data along with reference data. There is dew on the diffuser of the LI-COR LI-200 pyranometer in the morning between 6:00 and 7:00. The GHI increases slightly while there is a large bump on the DNI, which is calculated by subtracting DHI from GHI and dividing by the cosine of the solar zenith angle. This RSP in this plot was calibrated against the DNI values and no correction algorithms have been applied to the DHI data.
14.9 Quality Control of Data
Quality control of data is very important. Quality control can spot problems as well as give confidence in the data. Since irradiance data can vary rapidly and significantly, it is useful to have more than one instrument measuring the solar irradiance. The best quality control method is to have three measurements: the DNI, GHI, and diffuse horizontal irradiance (DHI). The GHI is equal to the DNI times the cosine of the solar zenith angle plus the DHI. If the values agree to within a few percent (e.g., ±3%), all three measurements are likely to be correct. If raindrops on the window of the pyrheliometer scatter some of the incident irradiance, the calculated global value may differ markedly from the measured GHI. Therefore, these checks can identify problems in the data.
It is important to have a procedure to ensure the quality of the data and to identify any data that are bad. For example, when an instrument is cleaned, a spike (either an increase or decrease) is often observed in the reported irradiance. This is especially true when 1 minute or shorter time-interval data are obtained. The data can be flagged or even corrected as long as the corrected data are labeled. The procedure for flagging the data or correcting the data should be documented. With data intervals longer than 5 minutes, the ease of observing problems decreases along with the accuracy to which corrections can be made.
One method of identifying problem data is to plot the data and compare them with notes on the log sheets. If an instrument’s data start to deviate from the data of similar instruments at the station, then it is worthwhile to examine log sheets to see if there was any activity at the station that may have resulted in this discrepancy. Plots of the data showing dips in the data that seem to be caused by cleaning can be easily verified by checking the log sheet records. If a problem with the data is properly identified, the problem data should be flagged or corrected. At other times it might be easier to examine the logs and see if the activity at the station might have influenced any of the data being taken at the station.
Normalizing the data by dividing by the extraterrestrial irradiance is one useful method in quality control because it allows a large range of data values to be grouped and any outliers to be identified that might need further examination. If these clearness indices are above 1 for any length of time, there is likely to be a problem. However, especially with high time resolution data, clouds passing near the sun can reflect the incident irradiance onto a pyranometer and increase the incoming irradiance to values greater than the extraterrestrial irradiance. This is why it is useful to have all three measurements.
If only two of the three measurements are made (DNI and GHI or GHI and DHI) a clearness plot of the data is useful. DNI divided by the extraterrestrial beam irradiance is kb; GHI divided by the equivalent extraterrestrial global irradiance is kt. One can plot either kb against kt or DHI/GHI against kt to evaluate the data. Figures 14.8 and 14.9 illustrate these plots. The data fall into bands, and any data outside the bands should be examined in more detail. Certain values, such as kb greater than kt, are not generally possible. For partially cloudy periods, GHI can be greater than the extraterrestrial radiation that results from reflections off of clouds adding to the GHI. This leads to clearness values greater than 1 and represents real data occurrences. These periods when the GHI are greater than the extraterrestrial radiation are short-lived and are not seen in 10-minute, 15-minute, or hourly data files (see kb vs. kt plots in Appendix A). Offsets or fluctuations when GHI values are small, say less than 10 Wm–2, can lead to spurious data points. If the spread of the data is too great or if there are a lot of points outside the main grouping, then there may be problems with the data. Common problems are dirt on the pyranometer, misalignment of the pyrheliometer, misalignment of the shadowband, systematic errors with the instrument, or poor calibrations for the instrument.

FIGURE 14.8 Plot of the diffuse fraction plotted against clearness index kt for 1-minute data. Most of the data fall along the lower left-hand side of the plot. Those data points represent clear periods. A spread of data points to the left represents data when clouds are present. When there is no DNI, the diffuse fraction is 1, and GHI = DHI. When there is some sun present, the clouds can act as reflectors, and a wide variety of GHI values can occur for any diffuse fraction. Note the number of clearness index values near 1 or greater than 1. These GHI values are enhanced by sunlight reflecting off clouds and into the sensor. As the averaging time interval increases, the number of data points with kt values near or greater than 1 significantly decreases. When plotting hourly average values, there are very few data points with kt greater than 0.8.
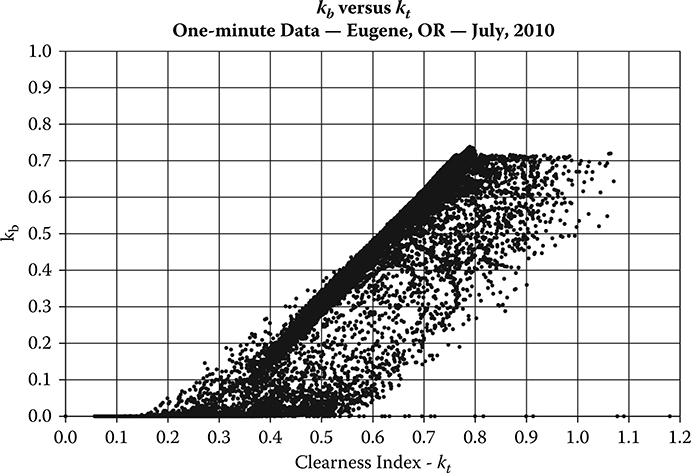
FIGURE 14.9 Plot of kb versus kt for 1-minute data. As with the diffuse fraction relationship, shown in Figure A.1, the majority of points during clear periods fall on the left-hand side of the plot. Values with the largest clearness index are not values with the largest beam clearness index values. This results from sunlight reflecting off clouds and into the global pyranometer. This reflected light is not seen by the pyrheliometer that measures the DNI values. Note that there are very few data points with kb values above a maximum of 0.8. The maximum kb values are somewhat dependent on altitude because higher altitudes have a lower air mass through which sunlight has to traverse.
For DNI and GHI measurements, the National Renewable Energy Laboratory (NREL, 1993) developed the SERI QC model that defines the region where most data points should fall. The more the data points fall outside the region, the larger the SERI QC flags. The SERI QC flags are found in the National Solar Radiation Data Base. With analysis of a lot of data, programs such as SERI QC can isolate possible problem data without visual inspection of every data point. SERI QC does not spot all problems, but it does spot the more egregious ones.
14.10 Field Calibrations
In general, pyranometers decrease their responsivity by between 0.5 and 1% per year, whereas most pyrheliometers change less. Therefore, it is important to keep track of the instrument calibration to minimize a systematic drift in the data values over time. This is especially true if one wants to use the data to track changes in the resource with high confidence (bankability).
The following are two of the methods to track instrument calibration over time. The first method is to replace the instrument with an auxiliary instrument and send it to a qualified facility for calibration against a standard traceable to the international standard. While changing out instruments for calibration can be done, the replacement instruments will not have precisely the same characteristics as the original instrument and the absolute calibration has an uncertainty between 2 and 3%. This makes obtaining a long-term record more difficult because exchanged instruments increase uncertainty and variation in the data. This added uncertainty can be addressed by quickly calibrating the instrument and replacing it for the temporary substitute instrument at the site.
An alternate method of calibration is to take standard instruments out to the field and calibrate the instruments in the field. For field calibrations, it is important to use the same type of instrument for calibration because each model of instrument deviates from a perfect response in its own characteristic manner. Therefore, one would not want to calibrate a photodiode pyranometer from one manufacturer with a photodiode pyranometer from another manufacturer or with a thermopile pyranometer. The best side-by-side calibrations are done by comparing the same model instruments from the same manufacturer. The reference instrument should be calibrated yearly against standards traceable to the international standards as discussed in the calibration sections of Chapters 4 and 5.
The station should be constructed so that it is easy to place the comparison instrument next to the instrument being calibrated. The instruments should be on the same level. If the field instrument is in a ventilator and the reference instrument is not using a ventilator, then the reference instrument needs a stand to hold it at the same level. If the calibration is being done on an automatic tracker, be sure that the instrument is secured to the platform. Cables from these temporary instruments should have enough play so that movement of the tracker will not stress the cable and be placed or safety flagged so that they will not present tripping hazards while working around the instruments.
It is also helpful to run the calibration overnight, especially for instruments that are subject to thermal offsets. An estimate of the thermal offset can be made looking at the nighttime values. In addition, any offsets or problems with the data logger or cabling stand out during the nighttime when there is no solar radiation input to the irradiance sensor.
Often other site maintenance tasks are performed when the instruments are being calibrated. Make sure that these tasks do not interfere with the calibrations, or if they do note the time and the questionable data can be removed.
Calibration numbers usually have a ±2–3% uncertainty. Less variation is introduced into the data set if the calibration number is not changed each time a new one is obtained provided the new calibration number is within the uncertainty of the last calibration. However, calibration values typically change less than 1% per year, and this is within the uncertainty of the calibration measurement. Plot the change in calibration over time. Once a consistent trend is observed, then that calibration trend can be used to adjust the data to the more accurate value.
Calibration numbers often depend to some degree on the ambient temperature. Note the temperature and irradiance level during the calibration. This information may be useful at a future date if the responsivity of the reference instrument is correlated with temperature.
Always keep good records during field calibrations. When the data are examined at a later date, it will be easier to address questions about questionable data values.
14.11 Physical Layout of a Solar-Monitoring Station
When setting up a solar-monitoring station, it is important to keep a few principles in mind:
The instruments at a solar-monitoring station should have minimal shading, especially by other instruments at the station.
The instruments should be easy to access for cleaning and maintenance.
Wiring should be shielded from the environment and animals. Exposed wiring should be kept to a minimum.
Access to the station should be limited to those who need to maintain or calibrate the instruments.
Growth around the station should be manageable.
Station layout should allow for side-by-side calibrations when possible.
An example of a Surface Radiation (SURFRAD) Network station is shown in Figure 14.10. The various monitoring equipment are well separated to minimize shading. The meteorological tower is to the north of the solar-monitoring equipment. Most wiring is in conduit, and power cables are buried and protected. The equipment is on sturdy concrete pads, and the equipment is tied down securely to the pads. The vegetation is low growing and has been cleared around the instruments.
Two examples of the SRRL station in Golden, Colorado, are shown in Figures 14.11 and 14.12. A wide variety of instruments are used and tested at SRRL. The tower allows further testing to be done from tilted irradiance to wind speed, temperature, and relative humidity. Ground-reflected longwave and shortwave radiation are also measured along with net radiation. Some of these instruments are not easy to reach, such as the tilted pyranometers, and hence are not as likely to receive as much cleaning as instruments that are within easy reach. Of course, this tower is located near the SRRL main station, and there are people there to provide maintenance on a regular basis. The reference solar monitoring station for UO SRML network in Eugene, Oregon, is shown in Figure 14.13.

FIGURE 14.10 (See color insert.) Photograph of the SURFRAD station near Sioux Falls, South Dakota.

FIGURE 14.11 (See color insert.) Photograph of the SRRL station in Golden, Colorado, looking north. Sample of instruments in continuous use (foreground) and under test at SRRL. Note platform on which the instruments are mounted is a grate that helps to prevent snow from building up around instruments.
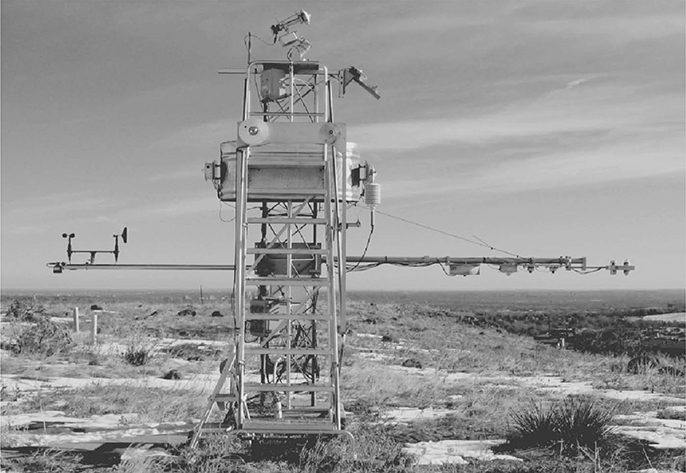
FIGURE 14.12 Photograph of the SRRL Baseline Measurement System’s radiometer tower in Golden, Colorado. Located away from the elevated instrumentation platform shown in Figure 14.11, this auxiliary tower provides for a wide variety of radiometers at various orientations for continous measurements (http://www.nrel.gov/midc/srrl_bms).

FIGURE 14.13 (See color insert.) Photograph of the University of Oregon Solar Radiation Monitoring Laboratory monitoring station in Eugene, Oregon. Note that most tilted measurements use a shield to block some of the ground-reflected irradiance.
Questions
What are a few issues to consider when selecting a solar monitoring station?
How will sun path charts help in this process?
Why are site logs useful?
Why are field calibrations preferred if it is possible?
What is the advantage of having all three primary solar measurements, GHI, DNI, and DHI?
What is the primary cleaning fluid for solar instruments?
Explain why the calculated DHI is larger than the measured DHI in Figure 14.6.
References
Hickey, J. R. 1970. Laboratory methods of experimental radiometry including data analysis. In Advances in Geophysics (vol. 14), eds. H. E. Landsberg and J. Van Mieghem; Precision Radiometry, ed. A. J. Drummond. New York: Academic Press.
Long, C. N. and Y. Shi. 2008. An automated quality assessment and control algorithm for surface radiation measurements. Open Atmospheric Science Journal 2:23–37.
McArthur, L. J. B. 2004. Baseline Surface Radiation Network (BSRN). Operations Manual, Version 2.1. WMO/TD-No. 1274, World Climate Research Programme, World Meteorological Organization, Geneva, Switzerland, WCRP/WMO.
Morrison, R. 1998. Grounding and shielding techniques, 4th ed. New York: John Wiley & Sons.
NREL. 1993. User’s manual for SERI_QC software-assessing the quality of solar radiation data. NREL/TP–463–5608. Golden, CO: National Renewable Energy Laboratory.
Stoffel, T., D. Renne, D. Myers, S. Wilcox, M. Sengupta, R. George, and C. Turchi. 2010. Concentrating solar power: Best practices handbook for the collection and use of solar resource data (CSP). NREL Report No. TP–550–474651, 46 pp. www.nrel.gov/docs/fy10osti/47465.pdf
Wilcox, S. and W. Marion. 2008. User’s manual for TMY3 data sets. Technical Report NREL/ TP–581–43156, revised May 2008.