
13 Meteorological Measurements
But unless we patiently and accurately carry on solar observing throughout this generation, our successors will be as much at a loss as we are...
Charles Greeley Abbot
(1872–1973)
13.1 Introduction
The World Meteorological Organization (WMO) is working to bring standards to the measurements affecting weather, climate, and water. In 2008, WMO issued its seventh edition of the Commission for Instruments and Methods of Observation (CIMO) guide to meteorological measurements (http://www.wmo.int/pages/prog/www/IMOP/publications/CIMO-Guide/CIMO_Guide–7th_Edition–2008.xhtml). The CIMO guide is written to encourage standardized meteorological measurements around the world.
This chapter covers the basic elements of the CIMO guide for the measurement of ambient temperature, relative humidity, wind speed and direction, and pressure. In addition, advantages and disadvantages of typical practices are discussed.
13.2 Ambient Temperature
Temperature is related to the average kinetic energy of molecules of a substance. The fundamental temperature scale is the Kelvin scale based on the average kinetic energy of an “ideal” gas. An “ideal” gas is composed of noninteracting point particles and is used because idealized gases can be described and analyzed with great precision using statistical mechanics. The basic physical properties of gases are most easily understood using an ideal gas as the example, and most gases behave in a manner very similar to an ideal gas under most circumstances.
The triple point of water has a defined kelvin temperature of 273.16 K (Preston-Thomas, 1990). The triple point of a substance is the state in which gas, solid, and liquid forms can coexist in thermodynamic equilibrium. A unit kelvin is 1/273.16 of the thermodynamic temperature of the triple point of water.
Historically, the centigrade scale is 1/100 the difference between the temperature of melting ice and boiling water under standard atmospheric pressure (101,325 Pascal). Centigrade is now called the Celsius scale after Celsius, who worked on developing the scale. The Celsius scale is now defined so that 0°C = 237.15 K and a change of 1°C is equal to a change of 1 K. Note that when referring to degrees kelvin the “°” symbol is not used because it is for the Fahrenheit and Celsius scales.
As with the precise definitions for the temperature scale, it is necessary to clearly define how air temperature is measured to have consistency in measurements. Important considerations are airflow over the sensor, height of the sensor above the ground, environment in which the temperature is measured, and the shielding of the sensor from direct sunlight. These details are also important for most meteorological and solar and infrared radiation measurements.
13.2.1 TYPES OF TEMPERATURE SENSORS
There are two common ways to measure temperature: with (1) a thermocouple; or (2) a resistive temperature detector (RTD), or a thermistor. A thermocouple is made of two dissimilar metals that generate a voltage proportional to the temperature difference between the junctions of the two metal junctions. This is the same device used for thermopiles in pyranometers. Thermocouples are very versatile, operate over a wide range of temperature with varying linearity, and have a fast response time but also require a measuring device that provides a stable reference and linearization. Thermocouples are difficult to recalibrate because their response is dependent on the environment in which they are used.
RTD detectors depend on the known change of resistance of the material as a function of temperature. RTDs are stable over time, are more accurate over their given range, and are easier to recalibrate. RTDs work over a limited temperature range compared with thermocouples and can be fragile in harsh industrial environments.
The most common types of thermometers used in automated weather stations are platinum resistance thermometer (PRT) detectors. They are considered the most accurate of thermometers and operate accurately over most ambient temperature ranges.
Specifications for a good temperature detector include an operating range of –30 to 45°C, with an accuracy of better than 0.2°C with a deviation of less than 0.1°C over any 10°C range. Initial calibrations should be done at accredited laboratories with periodic performance checks using reference PRTs.
13.2.2 RESPONSE TIMES
Air temperature can fluctuate up or down a degree K or two over a few seconds. However, the reported value is the average ambient temperature, so it is not necessary to have thermometers that react on timescales of seconds. The WMO guidelines recommend that a thermometer register 63.2% (or more exactly 1-e–1) of a step change in air temperature in 20 seconds.
13.2.3 MEASURING TEMPERATURE
For meteorological measurements, ambient air temperature (also called “dry bulb” temperature) should be measured between 1.2 and 2 meters above the ground. For the best temperature measurements, the ground should be level with little obstruction from surrounding objects such as trees or structures. Temperature measurements on the tops of building are affected by the vertical temperature gradient and the effect of the building itself.

FIGURE 13.1 Cotton Region Shelter use for temperature measurements. Temperature and relative humidity sensors are inside this shelter.
Solar radiation directly from the sun or the sky dome or reflected from the ground and surrounding objects can heat the temperature sensor and give false readings of ambient air temperature. Therefore, it is necessary to shield the thermometer from such radiation. Radiation shields also help protect the detector from rain and fog, which can artificially depress the temperature. Radiation shields can provide naturally aspirated or forced air measurement environments. For example, the U.S. Weather Bureau (now the National Weather Service) adopted the Cotton Region Shelter for air temperature measurements beginning in the nineteenth century (Köppen, 1915) (see Figure 13.1). The current Automated Surface Observing System (ASOS) uses a ventilated instrument housing, or aspirator, to move air across the senor (see Figure 13.2). Regardless of the mounting design, the thermometer should be thermally isolated from the radiation shield to prevent conductive heating or cooling, especially if the thermometer is not ventilated.
Temperature measurements should have a steady airflow over the detector, and, if it is ventilated, the airflow should be between 2.5 and 10 m/s. High-efficiency fan motors should be used because the motor can slightly warm the air passing over the motor, especially if the flow rate is low enough. An example of a meteorological tower is shown in Figure 13.3 with the temperature and relative humidity sensors in a radiation shield and a tipping bucket rain gauge on the side.
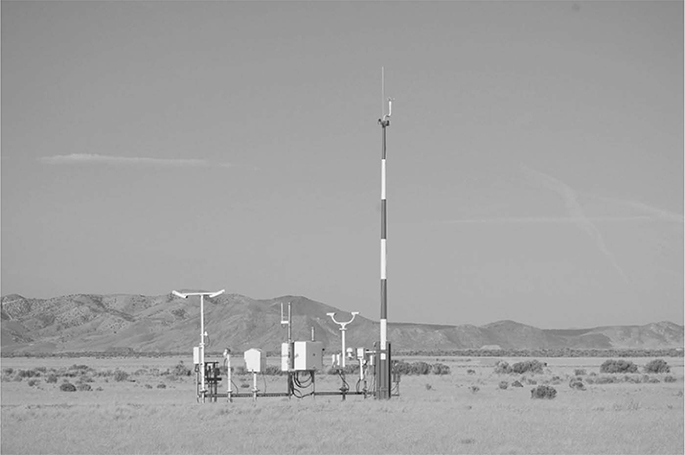
FIGURE 13.2 Image of an ASOS weather station in Milford, Utah. (Photograph courtesy of the Western Regional Climate Center.)
As with any measurement it is useful to fully describe the surroundings in which the measurements are made and to record and date any changes that are made to the surroundings.
Information on temperature measurements made with glass or other types of thermometers, minimum–maximum temperature measurements, and wet bulb measurements can be found in the WMO Guide to Meteorological Instruments and Methods of Observation. This guide is recommended reading before purchasing meteorological equipment and setting up a station.
13.3 Wind Speed and Wind Direction
Individual air molecules move at a variety of speeds and directions. One can describe the motion as a vector in three-dimensional space with the speed assigned to the magnitude of the vector. As the vector evolves over time, the generalized motion (or flow) of the air is obtained. Often with wind measurements, one is dealing with surface flow and measurements are limited to wind speed and wind direction in a plane 10 m above the ground level. A more complete characterization of wind flow would require a measurement of the wind in the vertical direction as well as in the horizontal plane. Various wind profilers have been designed based on remote-sensing techniques. Light detection and ranging (LIDAR) and sound detection and ranging (SODAR) technologies are two such commercially available technologies.
In addition, there is considerable interest in the gustiness of the wind (i.e, rapid fluctuations). Therefore, peak wind speed and standard deviations of the wind speed and direction are also useful. Often for meteorological purposes wind speeds and directions are averaged over 10 minutes and are used for forecasting. Wind speed measured over a 1-minute interval is often termed a long gust.
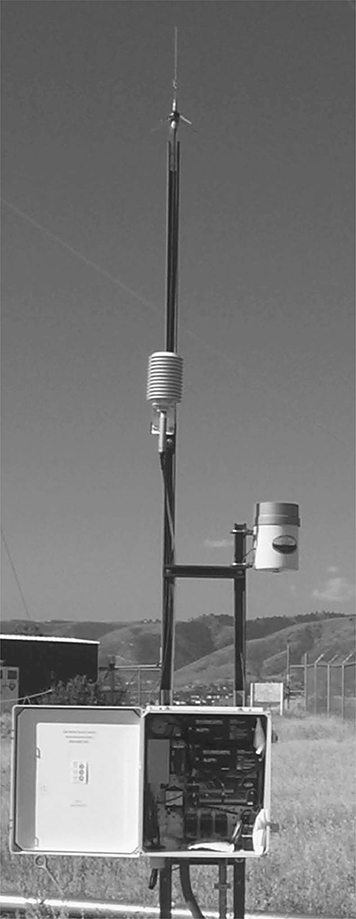
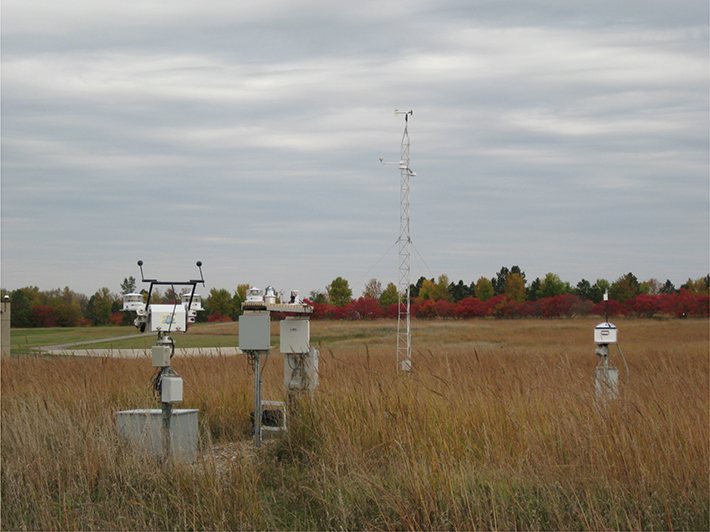
FIGURE 13.3 Picture of a met tower with the temperature and relative humidity sensor in a radiation shield mounted halfway up the unistrut beam. The lightning finial is on the top of the beam. The rain gauge is on another unistrut beam on the right.
13.3.1 SENSOR TERMINOLOGY
The time response of an instrument is the time it takes to detect and indicate a change. More specifically, given an input step change, the response time to register 63.2% of the step change is defined at the response time. For anemometers, it is more appropriate to use a representative response length to characterize the instrument. For example, if the wind speed is 5 m/s and the response time is 1 sec, then the response length would be 5 meters. For many anemometers, the higher the wind speed, the quicker the response time. Therefore, the instrument response to changes in wind speed is characterized as response length. Response length is approximately the passage of wind (in meters) required for the output of a wind-speed sensor to indicate 63.2% of a step-function change of the input speed. For most cup and propeller anemometers, the response time for acceleration is faster than for deceleration. This leads to an overestimation of actual average wind speed.
An important topic of wind vanes is the critical damping factor. When there is a change in wind direction, there is a tendency for the vane to overshoot and oscillate until it is pointing in the right direction. The critical damping factor is the damping value for a step change in wind direction without overshooting the value. The damping ratio is the ratio of the actual damping factor to the critical damping factor.
13.3.2 ANEMOMETER
There are two commonly used anemometers: (1) the rotary cup and (2) the propeller type. Pitot tubes measuring static and dynamic air pressures can be used and produce satisfactory results but are not commonly deployed. Advanced technologies, such as sonic anemometers, are being used in some new research tools and are now being incorporated in some monitoring systems for routine measurements.
Both the cup and propeller type anemometers consist of two components: a rotor and a signal generator. The rotors of both the propeller and cup instruments turn at a speed proportional to the wind speed. The responsivity of the instruments to changes in wind speed is characterized by a response length that is related to the moment of inertia of the rotor and other geometrical considerations (Busch and Kristensen, 1976; Coppin, 1982).
13.3.3 CUP ANEMOMETERS
The first anemometer on record was invented by Leon Battista Alberti, an Italian architect, in 1450. This consisted of a disk placed perpendicular to the airflow, and its rate of rotation depended on the wind speed. The hemispherical cup anemometer was invented in 1846 by Irish astronomer John Thomas Romney Robinson. The original cup anemometer had four cups, but work by Patterson (1926) showed that three-cup anemometers responded faster to changes in wind speed. Patterson’s work also showed that the larger the ratio of the cup radius to the arm length the better the linearity of the response.
The response to increases in wind speed is typically faster than the response to decreases in wind speed, and this asymmetry in response results in overestimates of the wind speed (Kristensen, 1993, 1999). In addition, the cup instruments are sensitive to the vertical motion of the air while the propeller instruments are insensitive to the vertical component. The overestimate of the average wind speed can be as much as 10% depending on the anemometer type and characteristics.
The rate of rotation of the rotor is roughly the difference between the wind speed and the initial wind speed necessary to rotate the rotor divided by the length of the column of air necessary to cause the rotor to rotate 1 radian. Therefore, the wind speed (ws) is obtained by multiplying the rotation frequency (rf times a gain (g) plus the initial wind speed (inws) necessary to start the rotation (usually around 0.2 m/s). The gain is the length of the column of air necessary to cause the rotor to rotate 1 radian.
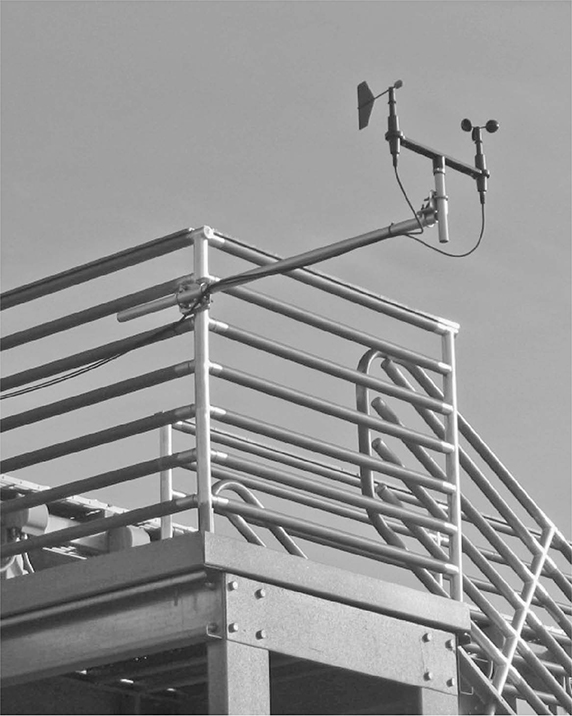
FIGURE 13.4 A cup anemometer and a wind vane are mounted from a pole several feet from the railing of a deck.
The friction that prevents the anemometer from rotating at very low wind speeds introduces a nonlinear response. Friction also varies with temperature. In practice, the anemometer bearings have a burn-in period before the instrument runs at a steady rate. This is sometimes done at the factory. After a year or two of use, the bearing friction starts to affect the anemometer and the bearings should be replaced. Cup anemometers also have a slight dependence on temperature and pressure. A thorough discussion of cup anemometers can be found in the IEA Wind Task 11 report on wind speed measurements and cup anemometers.
An example of a cup anemometer and a wind vane are shown in Figure 13.4.
13.3.4 PROPELLER ANEMOMETERS
H. W. Dines first published information on the propeller anemometer in 1887. In the early 1940s the Bendix Friez Company developed the “Aerovane” anemometer under contract with the U.S. Navy. Modern helicoid (propeller) anemometers are based on the Aerovane design (propeller anemometers are shown in Figure 13.5). The helicoid propeller is mounted on a rod with a vane at one end to pivot the propeller into the wind. Above the wind speed that overcomes the friction of the bearing, the rate of rotation of the propeller is proportional to the wind speed.
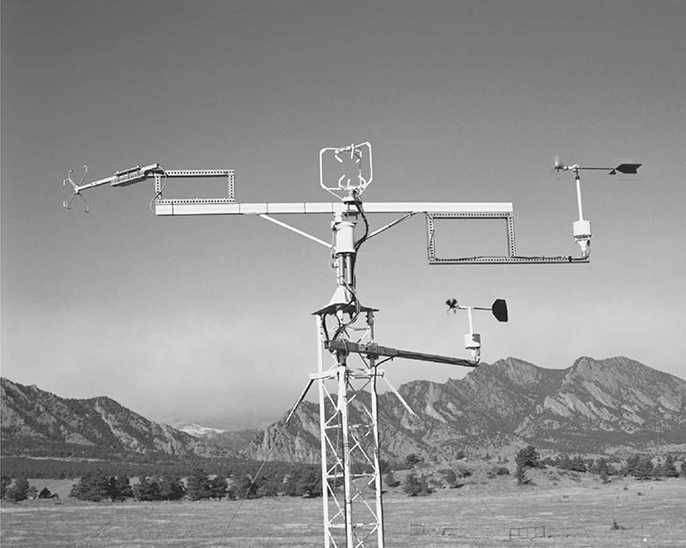
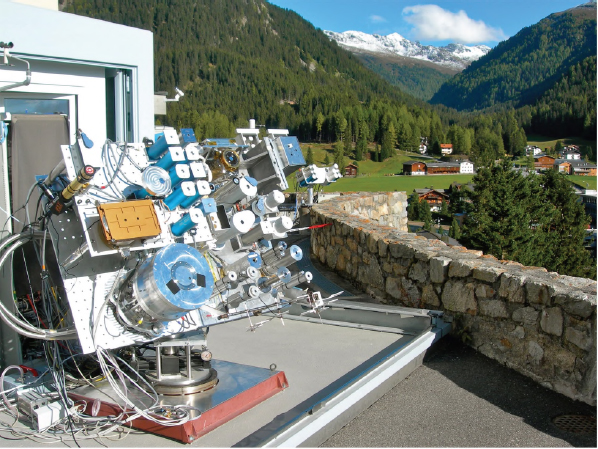
FIGURE 13.5 (See color insert.) Wind anemometers—sonic and vane. Pacific Northwest National Laboratory has developed a special filtering technique to enhance data gathered by an inexpensive cup anemometer. With the technique, cup anemometer measurements are surprisingly close to those made with a costly and sophisticated sonic anemometer (center of photo). (Courtesy of Warren Gretz, NREL staff photographer.)
The propeller responds mainly to the airflow parallel to the axis of rotation. By mounting three propeller anemometers in an orthogonal array, the three-dimensional airflow can be measured. These instruments have been used to study turbulence. To achieve accurate results, corrections must be applied to account for the instruments’ cosine response with respect to wind direction and the interaction of the wind with the support arms.
Disadvantages of propeller anemometers are that they need to point into the wind and there is a lag time or they may overshoot the direction. Therefore, the propeller is not always pointed directly into the direction of wind flow. This is particularly a problem with low wind speed or if there are eddies in the wind flow. Airflows vertical to the propeller and parallel to the plane of the vane can also cause problems.
For fixed-propeller anemometers, response decreases as the angle from the direction of airflow increases. For example when the angle reaches 85 degrees from the direction of airflow, the amount of air needed to push the propeller through 1 radian increases by a factor of 3.
In theory, the instrument should not require calibration except at low wind speeds. In practice, calibrations should be performed to obtain accurate measurements at low wind speeds and to check for excessive drag as the bearings begin to wear. Overspeed problems should be less than with cup anemometers because the propeller is pointed into the wind.
13.3.5 SONIC ANEMOMETERS
Sonic waves travel at different speeds depending on the direction of the path with respect to the flow of the wind. Measuring the time for the pulse to travel between the source and a receiver can then be used to calculate the wind speed. A sonic anemometer is shown in Figure 13.5. The typical frequency of a sonic anemometer is about 100 kHz.
where the wind speed in the “x” direction (Wx) is equal to the time it takes to travel the distance (AΔ) times the velocity of sound squared (or equivalently kRT, where k is the ratio of specific heats, R is the gas constant, and T is the air temperature) divided by twice the path length (d). Some sonic anemometers can measure with a resolution as low as 0.005 m/s.
Sonic anemometers are ideally suited for measuring the structure of turbulence because they have high resolution and precision. However, the presence of precipitation can affect the operation of the instrument. In addition, the geometry of the sensing heads introduces distortions that can affect wind speed measurements.
13.3.6 INSTALLING ANEMOMETERS
When mounting anemometers on a meteorological tower, it is important to minimize distortions caused by the tower and cabling. It is best to locate the anemometer at the top of the tower. Any lightning rod should be far enough away from the anemometer to minimize its effect. The location of the meteorological tower should also avoid local obstructions. The standard measurement exposure for wind speed and direction is 10 m above the ground over level, open terrain (WMO, 2008). Because wakes from trees and buildings can easily extend downwind to 12 or 15 times the obstacles height, a properly located measurement system should be at least 10 obstruction heights away for proper “wind fetch.”
For boom-mounted anemometers, the anemometer should be mounted above the cabling. For cylindrical wind towers, the boom supporting the anemometer should be at least 6 diameters from the support structure. If the wind comes from a prevalent direction, the minimum distortion occurs when the boom is mounted 45° to the prevailing direction of the wind.
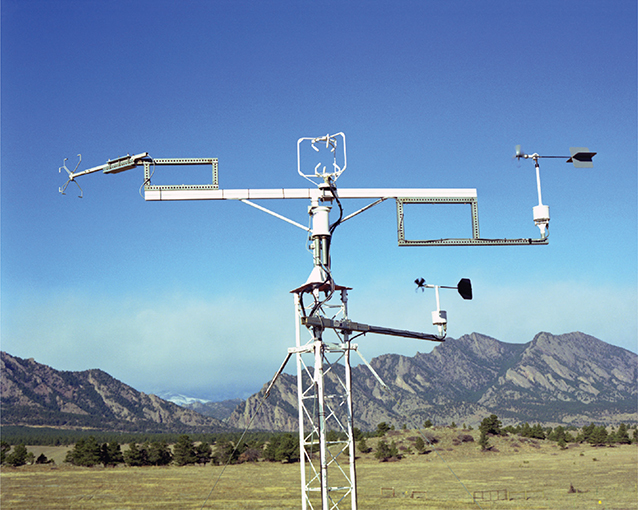
For a lattice mast, the boom should be mounted perpendicular to the prevalent wind direction. To reduce distortion of the measurements, the anemometer should be mounted 12 to 15 times the boom diameter above the boom (Hunter, 2003). To reduce distortions, cylindrical booms should be used. In addition, angular structures should be avoided along with untidy cabling. A good distance also should be kept from tower guys and lightning finials. An example of a wind tower is shown in Figure 13.6. The tower is a narrow pole with wind measurements at two heights. The tower is well guyed for stability, and a lightning finial is at the top of the pole and away from the wind sensors. It is important to firmly guy the wind tower to the ground. The energy in a gust of wind is proportional to the cube of the wind speed. Even wind gusts of 25 m/s (roughly 60 miles per hour) carry a lot of energy.
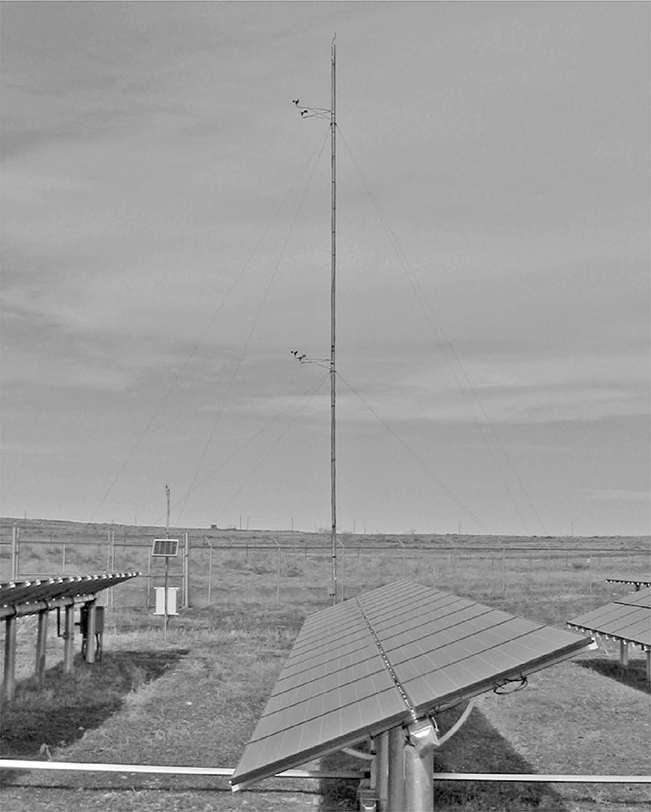
FIGURE 13.6 A wind tower with guys. Wind sensors are located at two levels with guy wires attached below the wind sensors. The tower is a pole with the wires running to the wind sensors securely attached to the pole. A lightning finial is mounted on top of the tower.
Note that some anemometers can freeze in position during cold periods, especially if there is little airflow. This happens especially if there is freezing rain. Some anemometers have heaters to prevent freezing. An additional source of information on wind monitoring is Schreck, Lundquist, and Shaw (2008).
13.3.7 WIND VANES
Wind vanes have been around since at least 450 BCE and probably decorated homes and public buildings much earlier. Besides providing decorative art to the building, wind vanes let people know which way the wind blows. This is important information that is added to anemometer measurements, and wind direction measurements often are taken alongside wind-speed measurements.
Wind direction is measured in a clockwise direction from true north (geographic north, not local magnetic north). It is very important to align the wind vane due north when it is installed. Any alignment error will be reflected in the measurement. When wind speeds are less than 1 knot or 0.514 ms–1, calm is reported, and direction is often given as 0. The abbreviation used for knot is kn. Typically, it takes a wind speed of about 1 knot flowing at a 45° angle to move the wind vane. This will vary by model. Accuracies are typically reported for steady winds above a certain speed, such as 5 ms–1. With fluctuating wind speeds and directions, the wind vane can overshoot an angle and oscillate about the true direction. These oscillations are usually damped exponentially.
There are many different ways to sense the direction the vane is pointing, ranging from potentiometers to rotary switches. Wind vanes with potentiometers will be discussed here. Wind vanes that use a potentiometer require a voltage to function. About one-half the excitation voltage should be recorded when the vane is pointed at 180°.
The shaft of the wind vane should be vertical. Deviations by more than a degree or two will impart systematic errors into the readings. Resistors, hence potentiometers, are dependent on temperature, and this temperature dependence can affect readings in extreme temperatures. Like the anemometer, a heater is sometimes an additional component that can be purchased for the wind vane. The heater should be powered by a separate unit from the one that powers the potentiometer.
It is useful to calibrate the wind vane periodically to test for problems. One can often start by making measurements at 180° and then subsequent measurements at 15° increments. Calibrations that are out of spec require replacement. The manufacturer should be contacted to make sure the component is replaced correctly.
Wind speed and wind direction information are often plotted in a figure called a wind rose (see Figure 13.7). The wind rose is a polar plot with the wind direction going from 0° to 360°. The distance from the center of the plot is the frequency that the wind is from a given direction. Often the length of the frequency is divided into wind-speed ranges.
13.4 Relative Humidity
The water vapor content of air can vary considerably over the day and affects many aspects of our life from comfort level to the performance of electronic devices. There are several ways to measure the water vapor content of our atmosphere, including most commonly the dew-point temperature and relative humidity measurements. Relative humidity, U, is the percent ratio of the observed vapor pressure to the saturated vapor pressure of water at the temperature and pressure at the time of observation. Relative humidity measurements will be discussed since one can calculate the water vapor content of the atmosphere given temperature, pressure, and any measurement of water vapor and since relative humidity measurements can be made automatically.
A chilled-mirror hygrometer is a field and reference instrument used to measure dew-point temperature. The hygrometer works by cooling a surface until dew or ice forms on the surface. The chilled-mirror hygrometer has a solid, nonhygroscopic surface, which does not absorb or release water vapor. The dew-point temperature (Td), or frost-point temperature (Tf), if it is cold enough, is the temperature at which dew, or ice, forms on the surface. Most chilled-mirror hygrometers use a polished metal mirror that is heated electronically by a Peltier-effect heater. An optical detector determines when moisture starts to condense on the mirror, and the temperature of the surface is then recorded. A pressure measurement is needed to calculate the relative humidity.

FIGURE 13.7 Example of a wind rose plot from the NREL MIDC website. Data are for all of 1989 for an anemometer 10 meters above the ground. Wind rose plots can represent wind data from days to years, depending on the time period selected. The wind directions are divided into eight groups, one group every 45°. Each circle represents 3.7% of the data. The different segments represent different wind speed regimes. For example, the plot shows that approximately 3% of the time, the wind blowing from the southwest is between 4 m/s and 6 m/s. (Note that the bars run horizontally.)
Still in use today, the sling psychrometer is used to measure relative humidity. The sling psychrometer measures both the ambient temperature and dew-point temperature, and the relative humidity can be determined using psychrometric charts. Many hygrometers are used to measure relative humidity such as the hair hygrometer, the chilled-mirror dew-point hygrometer, lithium chloride heated condensation hygrometer (dew cell), hygrometers using absorption of electromagnetic radiation, and electrical resistive and capacitive hygrometers. Only the electrical resistive and capacitive hygrometers will be discussed in this book because they lend themselves to automated measurements. For information on the other methods of measuring relative humidity see the CIMO guide.
Electrical resistance hygrometers have a plastic surface with a conductive surface on top of a nonconductive substrate. Water molecules adhere to the surface, changing the conductivity. A water-attracting (hygroscopic) electrolyte is used, and the conductivity is a function of the amount of water adsorbed. Alternating current is used to avoid polarizing the electrolyte.
Hygrometers based on electrical capacitance use solid hygroscopic material and measure the dielectric properties of the material. Water binds to the polymer, and the large dipole moment of water alters the dielectric property of the material. A capacitor is created by sandwiching the polymer foil between two electrodes. The capacitance is usually small, on the order of a few hundred picofarads. Therefore, it is necessary to have the electrical interface near the probe to minimize the electrical and capacitive effects. The effect of temperature on the probe must also be taken into consideration.
Electrical resistive and capacitive hygrometers usually are packaged with PRT temperature sensors. Enclosures that block the sun also prevent rain from wetting the probes. These probes may be damaged if they come in contact with liquid water.
The range of measurement for these probes can vary from 1 to 100%. These hygrometers have a temperature dependence of around 0.05%/°C. The response time is measured is seconds (roughly 10–20 seconds) and depends on the temperature. Typically, the accuracy of these probes in the field is 2 to 3% with the larger uncertainty above 90%. Stability of these hygrometers is about 1% per year. Of course, manufacturer specifications should be checked.
The response of these instruments to water vapor is nonlinear, and formulas are often supplied by the manufacturer that render the measured values into percent relative humidity. Relative humidity probes should be calibrated annually, either at the factory or by use of salt solutions that have known water vapor pressures. A good hair hygrometer can be used to spot check the calibration of these hygrometers.
13.5 Pressure
Atmospheric pressure is the force per unit area exerted by the weight of the atmosphere. The unit of pressure is the Pascal (Pa) or Newton per square meter. Typically hectopascals are the units used for pressure. 1 hPa = 100 Pa as 1 hPa is equivalent to 1 millibar (mbar), the old scale of measurement. 1013.250 hPa is equivalent to 760 mm of mercury (Hg), or one standard atmosphere of pressure.
The invention of the mercury barometer has been credited to Evangelista Torticelli in 1643, although there were discussions of similar barometers around the same time or earlier. The mercury barometer compares the pressure of a column of mercury against air pressure. The height of the column of Hg is proportional to the atmospheric pressure. Temperature, gravity, and the meniscus are among the most prevalent sources of error that can affect the reading of a mercury barometer.
Several types of electronic barometers are used in automated weather stations. These barometers use materials that respond to pressure and use transducers to translate these changes into electrical signals. Some of these sensors are triply redundant to improve accuracy and have temperature sensors mounted internally to provide automatic temperature compensation.
13.5.1 ANEROID DISPLACEMENT TRANSDUCERS
Aneroid displacement transducers use materials that expand or contract in response to changes in pressure. Typically, a metal alloy of beryllium and copper are used for the instrument and expansion or contraction is measured by levers that are connected to a device to display the pressure. Alternatively, designs can be created to generate electronic output.
13.5.2 PIEZORESISTIVE BAROMETERS
Piezoresistive pressure sensors work by running a current through a crystal that changes resistance resulting from deformations in the structure. The current then goes through temperature compensation circuitry and is amplified. Piezoelectricity is the charge that occurs when pressure or strain is applied to certain solid materials. Piezoresistivity and piezocapacitance are the changes in resistivity and capacitance that occur when strain is applied. Piezoresistive barometers use crystalline quartz as the sensor material because it has well-defined and stable piezoelectric properties. Strain changes interatomic spacing, and this affects the bandgap, making it easier or harder for electrons to be raised into the conduction band. The strain results in a change in resistivity of the semiconductor that is proportional to the strain being applied. A frequency control circuit is connected to the piezoelectric oscillator, and alternating current (AC) resistance is proportional to the pressure being applied. Again, crystalline quartz is usually chosen because frequency characteristics are precisely reproducible and the dependence on temperature is relatively small.
The gage factor, the change in resistance per change in length, is typically about 2 for metals, 10 to 35 for poly silicon, and 50 to 150 for single crystalline silicon (Schubert, Jenschke, Uhlig, and Schmidt, 1987; Smith, 1954; Tufte and Stelzer, 1963).
Pressure at an inlet port moves a flexible bellows upward and applies an upward axial force that creates a compressive force on the quartz crystal. The quartz crystal diaphragm is very rigid, and the pressure creates minimal deflections. Strain gages are attached around the circumference of the diaphragm or diffused into the silicon. A silicon chip with diffused strain gauges can act as the diaphragm itself.
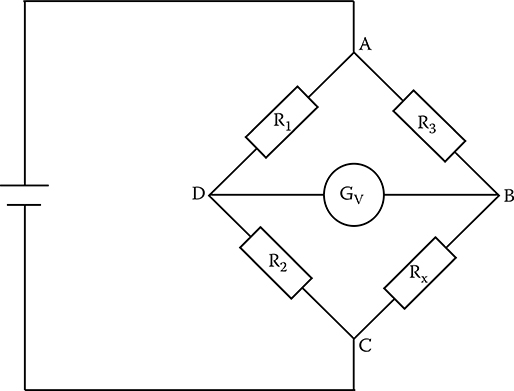
FIGURE 13.8 Generic drawing of a Wheatstone bridge used to determine an unknown resistance. A gauge, GV, measures the voltage between points D and B. Resistor RX is unknown resistance.
A silicon wafer can be fabricated to serve as the pressure sensor. A thick silicon rim supports a monocrystalline silicon diaphragm. Etching away the bulk of the silicon creates the diaphragm. Two to four piezoresistors are then diffused into the diaphragm. The silicon is doped with n-type atoms that provide an extra conduction electron to the silicon. Diffusion of p-type atoms, atoms that seek an electron to complete a pair bond, is applied to small squares to create piezoresistors. The piezoresistors are arranged in the Wheatstone bridge configuration to achieve higher voltage sensitivity and low temperature sensitivity.
A generic Wheatstone bridge (Figure 13.8) has three known resistances and one unknown. When the bridge is balanced, there is no current flow from point B to point D in Figure 13.8. When the bridge is unbalanced by the change in resistance of the strain gages, a current is created and this current is proportional to the change in resistance and, hence, pressure. Some piezoresistive barometers have thermostats to eliminate temperature effects.
Modern piezoresistive barometers measure two resonance frequencies of the piezoelectric element. By calculating a linear function of these frequencies, and with an appropriate set of variables obtained after calibration, a pressure is calculated by a microprocessor that is independent of the temperature of the sensor. Accuracies of piezoresistance barometers can reach 0.01%.
13.5.3 PIEZOCAPACITANCE BAROMETERS
In a piezocapacitance barometer, a metal or silicon diaphragm acts as one terminal of the capacitor. The other terminal is a metal substrate on a ceramic or glass substrate. Pressure deflects the diaphragm, which in turn changes the gap spacing and the capacitance. In a differential piezocapacitance barometer, the silicon diaphragm is between the two electrodes and the pressure deforms the diaphragm and increases the capacitance on one side and decreases the capacitance on the other. Piezocapacitance barometers can have an accuracy of 0.1%.
TABLE 13.1
Operational Measurement Characteristics
|

13.6 Recommended Minimum Accuracies for Operational Instruments
When planning for meteorological measurements, it is important to get a feeling for the resolution, data recording intervals, uncertainties, time constants, and achievable measurement uncertainties of meteorological variables. The Guide to Meteorological Instruments and Methods of Observation (2008) is a good reference for this type of information. Table 13.1 shows some of the information for the measurements discussed in this chapter.
Questions
What international organization sets the standards for meteorological measurements?
If the temperature is 300 K, what is the temperature in Celsius? Fahrenheit?
Name two types of temperature sensors.
What is an aspirator, and how does it help provide a more accurate temperature measurement?
What is dew-point temperature, and how is it measured?
Name three types of anemometers.
What is an anemometer’s response length?
A zero reading for wind direction means the wind is blowing from what direction?
What are some of the problems that affect wind measurements?
What is a wind rose?
What does a sling psychrometer measure, and how does it work?
Relative humidity sensors do not respond linearly to changes in atmospheric moisture. How is this nonlinear behavior corrected?
Name two types of pressure sensors, and describe how each one works.
What is the difference between resolution and measurement uncertainty? Which is larger?
What are the international units for measuring atmospheric pressure?
References
Busch, N. E. and L. Kristensen. 1976. Cup anemometer overspeeding. Journal of Applied Meteorology, 15, 1328–1332.
Coppin, P. A., 1982. An examination of cup anemometer overspeeding. Meteorologische Rundschau, 35, 1–11.
Hunter, R. S. (Ed.). 2003. Expert group study on recommended practices for wind turbine testing and evaluation –11. Wind speed measurement and use of cup anemometry (2d ed.). International Energy Agency Wind Productions.
Köppen, V. 1915. A uniform thermometer exposure at meteorological stations for determining air temperature and atmospheric humidity. Monthly Weather Review 42:389–395. Kristensen, L. 1993. The cup anemometer and other exciting instruments. Technical Report R–615(EN), Risø National Laboratory, Roskilde, Denmark.
Kristensen, L., 1998. Cup anemometer behavior in turbulent environments. Journal of Atmospheric and Oceanic Technology. 15:5–17.
Kristensen, L. 1999. The perennial cup anemometer. Wind Energy 2:59–75.
Kristensen, L. 2005. Fragments of the cup anemometer history. Available at: http://www.cupanemometer.com/technical/The%20Cup%20Anemometer%20History.pdf
Patterson, J. 1926. The cup anemometer. Transactions of the Royal Society of Canada, Ser. III 20:1–54.
Preston-Thomas, H. 1990. The International Temperature Scale of 1990 (ITS–90). Metrologia 1990(27):3–10, 107.
Schreck, S., J. Lundquist, and W. Shaw. 2008. U.S. Department of Energy workshop report: Research needs for wind resource characterization, June. NREL/TP–500–43521.
Schubert, D., W. Jenschke, T. Uhlig, and F. M. Schmidt, 1987. Piezoresistive properties of polycrystalline and crystalline silicon films. Sensors and Actuators 11(2):145—155.
Singh R., L. L. Ngo, H. S. Seng, and F. N. C. Mok. 2002. A silicon piezoresistive pressure sensor. Proceedings of the First IEEE International Workshop on Electronic Design, Test and Applications (DELTA 2002). Christchurch, New Zealand.
Smith, C. S. 1954. Piezoresistance effect in germanium and silicon. Physics Review 94:42–49.
Tufte, O. N. and E. L. Stelzer. 1963. Piezoresistive properties of silicon diffused layers. Journal of Applied Physics 34:313–318.
WMO. 2008. WMO guide to meteorological instruments and methods of observation, WMO-No 8. (7th ed.). Chapter 8. Available at: http://www.wmo.int/pages/prog/www/IMOP/publications/CIMO-Guide/CIMO_Guide–7th_Edition–2008.xhtml
COLOR FIGURE 3.23 The WRR is determined by a group of absolute cavity radiometers named the World Standard Group. At the moment, the WSG is composed of six instruments: PMO-2, PMO-5, CROM-2L, PACRAD-III, TMI–67814, and HF–18748.

COLOR FIGURE 5.3 Picture of a copper-constantan thermopile manufactured by Eppley Laboratory, Inc. Constantan wire is wrapped around a solid core and then dipped into a copper bath. (Photograph by Warren Gretz, NREL staff photographer.)
COLOR FIGURE 5.4 Picture of Kipp & Zonen CM 22 pyranometers in ventilators at SRRL in Colorado.
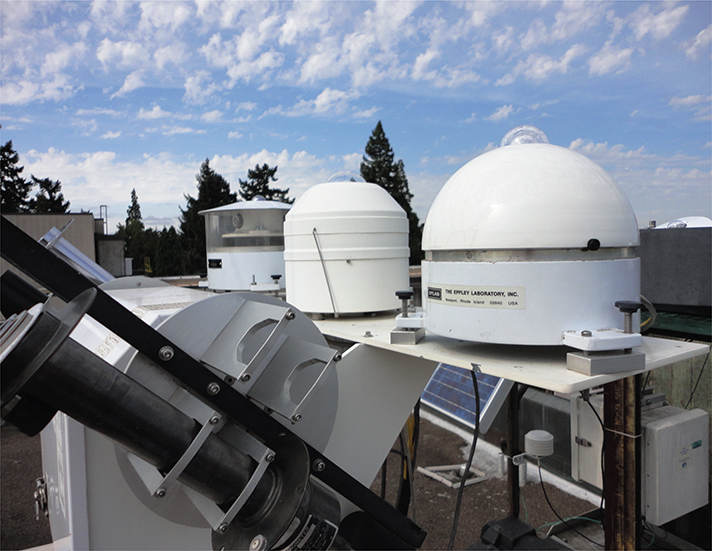
COLOR FIGURE 5.12 Three ventilators mounted on a Sci-Tech tracker. Going from right to left, the ventilator on the left is a Swiss PMOD ventilator holding a Kipp & Zonen CM 22 pyranometer. The ventilator is mounted on an Eppley ventilator base so the height of the dome matches the height of the domes of the other instruments. PMOD also makes a base for leveling. The middle ventilator is a Schenk ventilator for Schenk Star pyranometers. The ventilator on the left is an Eppley ventilator holding an Eppley precision infrared radiometer or pyrgeometer.

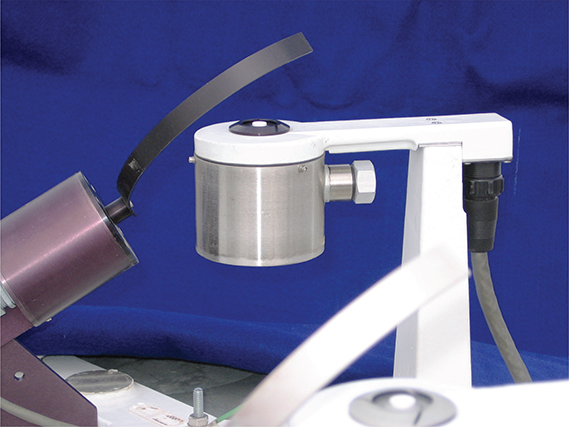
COLOR FIGURE 6.3 The Eppley model SBS shadowband blocks direct sunlight on a clear summer day in Eugene, Oregon. Note that the detector surface is well centered beneath the shadowband. The shadowband blocks a significant part of the brightest region of the clear-day skylight.
COLOR FIGURE 6.4 An example of a shaded-disk measurement of DHI. The arm holds disks that shade each of three black-and-white pyranometers.
COLOR FIGURE 7.2 The Yankee Environmental Systems, Inc. seven-channel multifilter rotating shadowband radiometer model MFR–7.

COLOR FIGURE 9.8 Photograph of the SURFRAD albedo tower near Sioux City, South Dakota. Note the shields that ensure the direct sunlight will not reach the upwelling detector even for minor horizontal leveling errors.
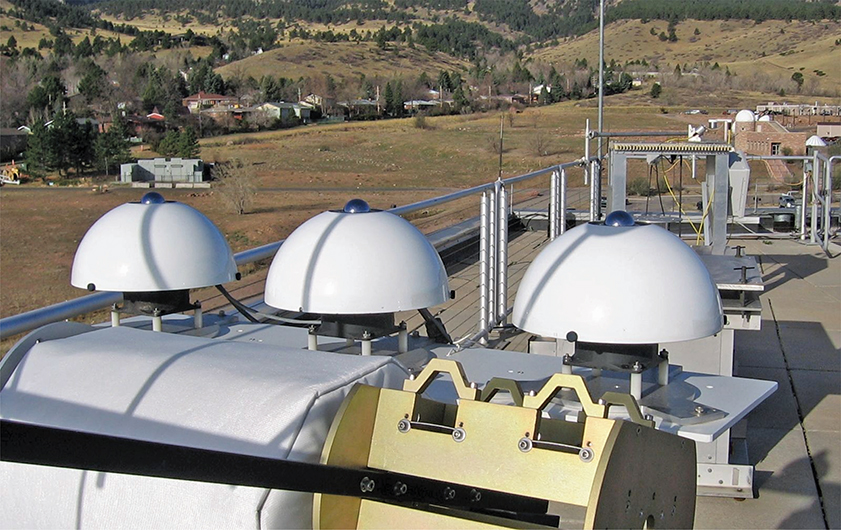
COLOR FIGURE 10.5 Three Eppley PIR pyrgeometers operated in the optimum manner; the instruments are continuously shaded from direct sunlight using an automatic tracker and are placed in heated ventilators to minimize dew formation and dust deposition on the instrument domes.
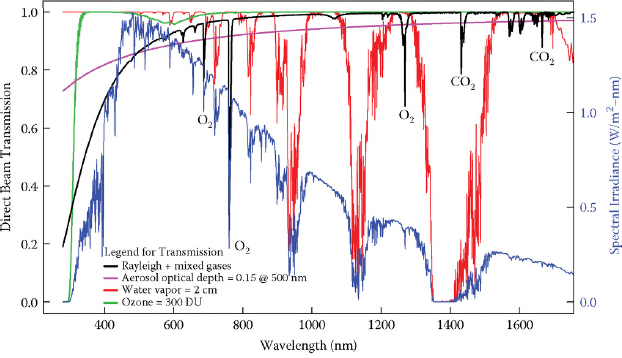
COLOR FIGURE 12.3 Direct solar transmission of major components of the clear-sky atmosphere (left axis); superimposed on the transmission spectra is the spectral irradiance calculated for these conditions (right axis).

COLOR FIGURE 12.4 The typical human eye’s response for sunlit conditions as specified by the Commission International l’Eclairage (CIE); en.wikipedia.org/wiki/File:Srgbspectrum. png is the source for the color diagram beneath the photopic response plot.
COLOR FIGURE 13.5 Wind anemometers—sonic and vane. Pacific Northwest National Laboratory has developed a special filtering technique to enhance data gathered by an inexpensive cup anemometer. With the technique, cup anemometer measurements are surprisingly close to those made with a costly and sophisticated sonic anemometer (center of photo). (Courtesy of Warren Gretz, NREL staff photographer.)
COLOR FIGURE 14.10 Photograph of the SURFRAD station near Sioux Falls, South Dakota.
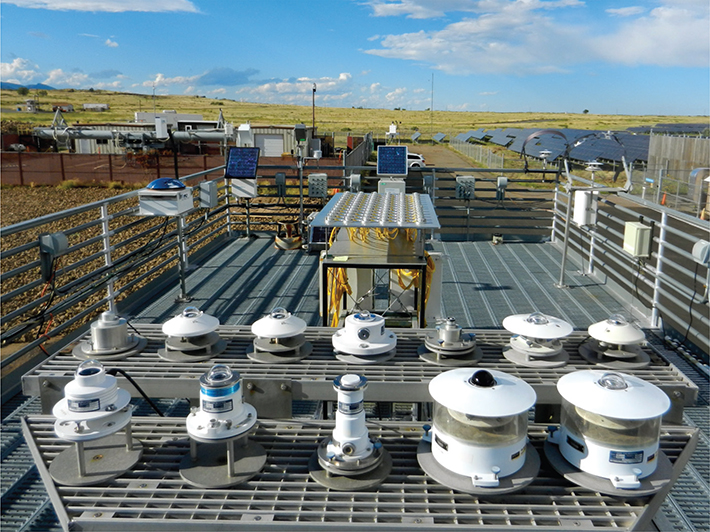
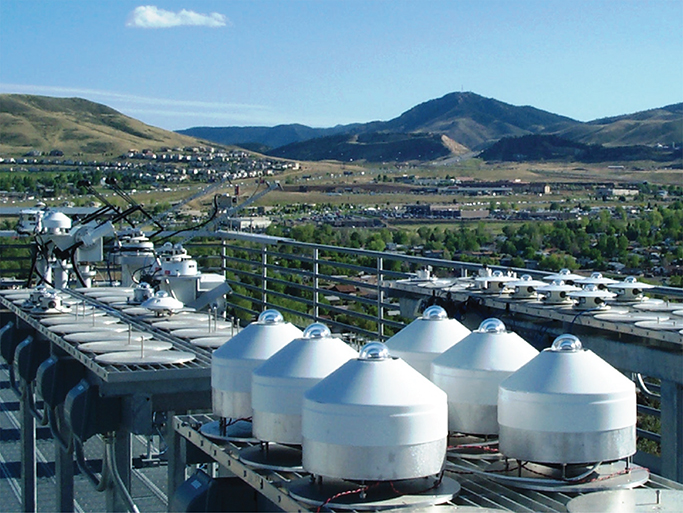
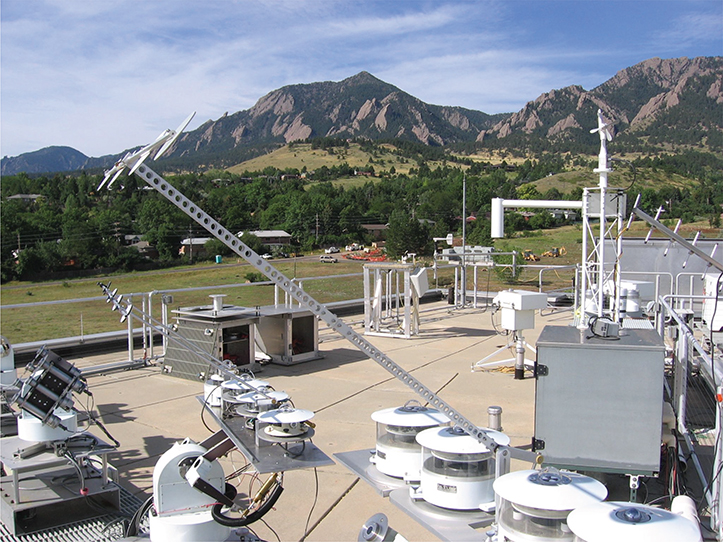
COLOR FIGURE 14.11 Photograph of the SRRL station in Golden, Colorado, looking north. Sample of instruments in continuous use (foreground) and under test at SRRL. Note platform on which the instruments are mounted is a grate that helps to prevent snow from building up around instruments.
COLOR FIGURE 14.13 Photograph of the University of Oregon Solar Radiation Monitoring Laboratory monitoring station in Eugene, Oregon. Note that most tilted measurements use a shield to block some of the ground-reflected irradiance.
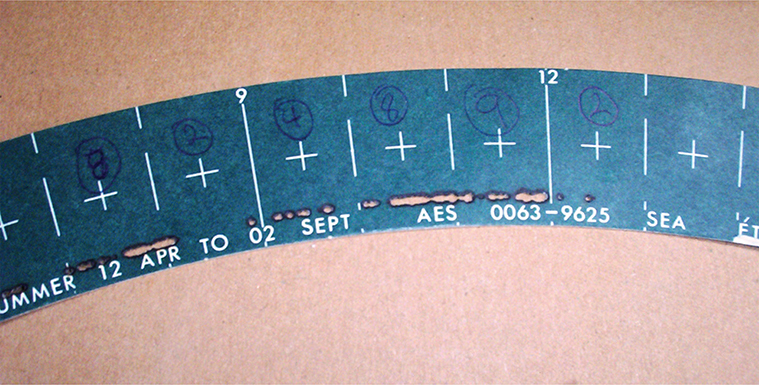
COLOR FIGURE H.1 Northern hemisphere summertime Campbell–Stokes measurement of sunshine duration. Fractional hours with bright sunshine are estimated by an analyst and hand recorded.