C H A P T E R O N E
INTRODUCTION
Even though we manage everyone’s competencies, we had been biased toward the high-skill jobs. The identification of strategic job families brought something to the forefront that we wouldn’t have seen otherwise…. It showed us an entry-level job that was just as important. The benefits of focusing on this job will be huge.
Paul Smith, director of human resources at Gray-Syracuse, was commenting on a new training program that would rapidly upgrade its thirty assemblypersons on a broad set of new competencies. Gray-Syracuse is a world-class producer of precision casting parts for highly engineered products used in aircraft engines, power generation equipment, and missiles. Senior management, after developing a Balanced Scorecard (BSC) and strategy map for its new strategy, had learned that the front end of the production process was a major opportunity to reduce rework and improve quality. The entry-level operators of this process, mold assemblypersons, had the greatest impact on reducing rework and decreasing the lead time from product idea to customer delivery. The company focused its limited training dollars on these critical few employees and cut the time to achieve strategic objectives in half.
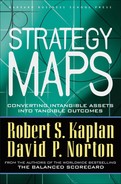
The Gray-Syracuse example shows how companies can now focus their human capital investments and, more generally, their investments in all intangible assets to create distinctive and sustainable value. All organizations today create sustainable value from leveraging their intangible assets—human capital; databases and information systems; responsive, high-quality processes; customer relationships and brands; innovation capabilities; and culture. The trend away from a product-driven economy, based on tangible assets, to a knowledge and service economy, based on intangible assets, has been occurring for decades. Even after the bursting of the NASDAQ and dot-com bubbles, intangible assets—those not measured by a company’s financial system—account for more than 75 percent of a company’s value (see Figure 1-1). The average company’s tangible assets—the net book value of assets less liabilities—represent less than 25 percent of market value.
What’s true of companies is even truer for countries. Some countries, such as Venezuela and Saudi Arabia, have high physical resource endowments but have made poor investments in their people and systems. As a consequence, they produce far less output per person, and experience much slower growth rates, than countries such as Singapore and Taiwan that have few natural resources but invest heavily in human and information capital and effective internal systems.1 At both the macroeconomic and microeconomic levels, intangible assets drive long-term value creation.
STRATEGY
An organization’s strategy describes how it intends to create value for its shareholders, customers, and citizens. If an organization’s intangible assets represent more than 75 percent of its value, then its strategy formulation and execution need to explicitly address the mobilization and alignment of intangible assets, the subject of this book.
Figure 1-1 The Increasing Importance of Intangible Assets
We, and our colleagues, have worked with more than 300 organizations over the past dozen years, helping them to develop and implement Balanced Scorecards. We have learned that the Balanced Scorecard is a powerful management tool. A measurement system gets everyone’s attention. For maximum impact, therefore, the measurement system should focus on the entity’s strategy—how it expects to create future, sustainable value. In designing Balanced Scorecards, therefore, an organization must measure the critical few parameters that represent its strategy for long-term value creation.
In our practice, however, we observed that no two organizations thought about strategy in the same way. Some described strategy by their financial plans for revenue and profit growth, others by their products or services, others by targeted customers, others from a quality and process orientation, and still others from a human resources or learning perspective. These views were one-dimensional. This narrowness was further amplified by the background of the individuals on the executive team. CFOs viewed strategy from a financial perspective; sales and marketing executives took a customer perspective; operations people looked at quality, cycle time, and other process perspectives; human resources professionals focused on investments in people; and CIOs on information technology. Few had a holistic view of their organization.
We found little help on a holistic framework from the prevailing wisdom of management thought leaders. Strategic doctrines existed around shareholder value,2 customer management,3 process management,4 quality,5 core capabilities,6 innovation,7 human resources,8 information technology,9 organizational design,10 and learning.11 While each provides deep insights, none provides a comprehensive and integrated view for describing a strategy. Even Michael Porter’s approach, based on positioning for competitive advantage, does not provide a general representation of strategy.12 Executives who have successfully executed strategy—Lou Gerstner at IBM, Jack Welch at GE, Richard Teerlink at Harley-Davidson, and Larry Bossidy at GE, Allied Signal, and Honeywell—provide a wealth of experiential insights, but not a consistent way to represent strategy.13 A generally accepted way to describe strategy did not exist.
Consider the consequences. Without a comprehensive description of strategy, executives cannot easily communicate the strategy among themselves or to their employees. Without a shared understanding of the strategy, executives cannot create alignment around it. And, without alignment, executives cannot implement their new strategies for the changed environment of global competition, deregulation, customer sovereignty, advanced technology, and competitive advantage derived from intangible assets, principally human and information capital.
In The Strategy-Focused Organization, we noted a study of failed strategies, which concluded, “in the majority of cases—we estimate 70 percent—the real problem isn’t [bad strategy]… it’s bad execution.”14 A more recent study by Bain & Company examined the performance of large companies (defined as companies earning revenues in excess of $500 million) in seven developed countries—the United States, Australia, the United Kingdom, France, Germany, Italy, and Japan—during the best ten years ever in economic history, 1988 to 1998. Only one out of eight of these companies enjoyed at least a 5.5 percent real cumulative annual growth rate in earnings while also earning shareholder returns above their cost of capital. More than two-thirds of these companies had strategic plans with targets calling for real growth in excess of 9 percent. Fewer than 10 percent of these companies achieved this target.15 Clearly, most companies don’t succeed in implementing their strategies. In contrast to this bleak record, organizations that made the Balanced Scorecard the cornerstone of their management systems, as we described in The Strategy-Focused Organization, beat these odds. They implemented new strategies effectively and rapidly. They used the Balanced Scorecard to describe their strategies and then linked their management systems to the Balanced Scorecard and, hence, to their strategies. They demonstrated a fundamental principle underlying the Balanced Scorecard: “If you can measure it, you can manage it.”
Describing Your Strategy
In order to build a measurement system that describes the strategy, we need a general model of strategy. Carl von Clausewitz, the great military strategist of the nineteenth century, stressed the importance of a framework to organize thinking about strategy.
The first task of any theory is to clarify terms and concepts that are confused…. Only after agreement has been reached regarding terms and concepts can we hope to consider the issues easily and clearly and expect to share the same viewpoint with the reader.16
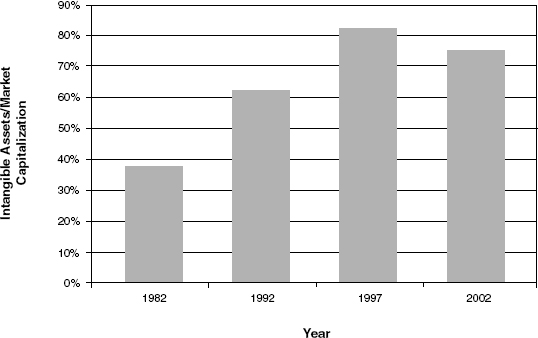
The Balanced Scorecard offers just such a framework for describing strategies for creating value. The BSC framework (see Figure 1-2) has several important elements.
- Financial performance, a lag indicator, provides the ultimate definition of an organization’s success. Strategy describes how an organization intends to create sustainable growth in shareholder value.
- Success with targeted customers provides a principal component for improved financial performance. In addition to measuring the lagging outcome indicators of customer success, such as satisfaction, retention, and growth, the customer perspective defines the value proposition for targeted customer segments. Choosing the customer value proposition is the central element of strategy.
- Internal processes create and deliver the value proposition for customers. The performance of internal processes is a leading indicator of subsequent improvements in customer and financial outcomes.
- Intangible assets are the ultimate source of sustainable value creation. Learning and growth objectives describe how the people, technology, and organization climate combine to support the strategy. Improvements in learning and growth measures are lead indicators for internal process, customer, and financial performance.
- Objectives in the four perspectives link together in a chain of cause-and-effect relationships. Enhancing and aligning intangible assets leads to improved process performance, which, in turn, drives success for customers and shareholders.
The framework for value creation in public-sector and nonprofit organizations (see the right side of Figure 1-2) is similar to the private-sector framework described above, but with several important distinctions. First, the ultimate definition of success for public and nonprofit organizations is their performance in achieving their mission. Private-sector organizations, regardless of industry sector, can use a homogeneous financial perspective: Increase shareholder value. Public-sector and nonprofit organizations, however, span a broad and diverse set of missions and hence must define their social impact, their high-level objective, differently. Examples of missions include: “Improve the prospects of children growing up today in low-income communities” (Teach for America); “Ensure the long-term future of opera” (Boston Lyric Opera); and “Safe Homes, Safe Communities” (Royal Canadian Mounted Police).
Figure 1-2 Strategy Maps: The Simple Model of Value Creation
The mission for these organizations, as in the private-sector model, is achieved through meeting the needs of targeted customers (or constituents or stakeholders, as some of these organizations describe the people who benefit from their services). The organizations create success through internal process performance that is supported by their intangible assets (learning and growth). The fiduciary perspective, while not dominant, reflects the objectives of an important constituency—the taxpayers or donors who supply the funding. Satisfying both financial and customer stakeholders, consistent with the mission, creates a strategic architecture of efficiency and effectiveness themes that mirrors the productivity and revenue growth themes used by private-sector organizations.
STRATEGY MAPS: DESCRIBING HOW THE ORGANIZATION CREATES VALUE
Our work with more than 300 organizations has provided us with an extensive database of strategies, strategy maps, and Balanced Scorecards. In addition, we have studied the state of knowledge in diverse management fields, including shareholder value, business and corporate strategy, customer management, product development and innovation, operations management, environmental management, social investment, human resource management, information technology management, culture, and leadership. From this experience and knowledge, we have learned how the Balanced Scorecard, initially proposed to improve the measurement of an organization’s intangible assets, can be a powerful tool for describing and implementing an organization’s strategy. The four-perspective model for describing an organization’s value-creating strategy provides a language that executive teams can use to discuss the direction and priorities of their enterprises. They can view their strategic measures, not as performance indicators in four independent perspectives, but as a series of cause-and-effect linkages among objectives in the four Balanced Score-card perspectives. We facilitate the discussions among executives by creating a general representation of these linkages that we call a strategy map. We now realize that the strategy map, a visual representation of the cause-and-effect relationships among the components of an organization’s strategy, is as big an insight to executives as the Balanced Scorecard itself.
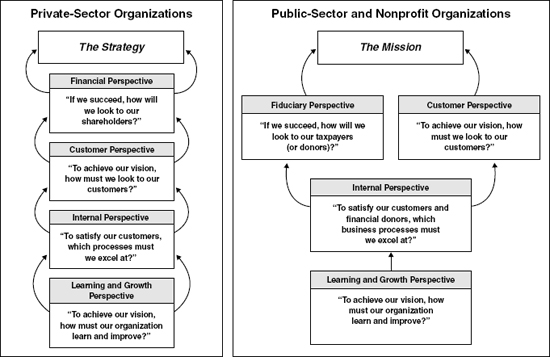
The general strategy map, shown in Figure 1-3, evolved from the simple, four-perspective model of the Balanced Scorecard. The strategy map adds a second layer of detail that illustrates the time-based dynamics of a strategy; it also adds a level of granularity that improves clarity and focus. As we noted earlier, numerous approaches are used in practice to formulate strategy. Regardless of which approach is used, however, a strategy map provides a uniform and consistent way to describe that strategy, so that objectives and measures can be established and managed. The strategy map provides the missing link between strategy formulation and strategy execution.
The strategy map template described in Figure 1-3 also provides a normative checklist for a strategy’s components and interrelationships. If a strategy is missing an element on the strategy map template, the strategy is likely flawed. For example, we frequently find that organizations have no connection between internal process measures and a customer value proposition, no objectives for innovation, and vague objectives for employee skills and motivation and for the role of information technology. Such omissions on a strategy map will generally lead to disappointing outcomes.
The strategy map is based on several principles:
Strategy balances contradictory forces. Investing in intangible assets for long-term revenue growth usually conflicts with cutting costs for short-term financial performance. The dominant objective for private-sector organizations is the creation of sustained growth in shareholder value. This implies a commitment to the long-term. At the same time, the organization must show improved results in the short-term. Short-term results can always be achieved by sacrificing long-term investments, frequently in an invisible way. Thus, the starting point in describing the strategy is to balance and articulate the short-term financial objective for cost reduction and productivity improvements with the long-term objective for profitable revenue growth.
Strategy is based on a differentiated customer value proposition. Satisfying customers is the source of sustainable value creation. Strategy requires a clear articulation of targeted customer segments and the value proposition required to please them. Clarity of this value proposition is the single most important dimension of strategy. In Chapter 2, and again in Chapter 11, we will discuss the four major value propositions and customer strategies that we have observed organizations using in practice: (1) low total cost, (2) product leadership, (3) complete customer solutions, and (4) system lock-in. Each of these value propositions clearly defines the attributes that must be delivered if the customer is to be satisfied.
Figure 1-3 A Strategy Map Represents How the Organization Creates Value
Value is created through internal business processes. The financial and customer perspectives in strategy maps and Balanced Scorecards describe the outcomes, that is, what the organization hopes to achieve: increases in shareholder value through revenue growth and productivity improvements; increases in the company’s share of customers’ spending through customer acquisition, satisfaction, retention, loyalty, and growth.
Processes in the internal and learning and growth perspectives drive the strategy; they describe how the organization will implement its strategy. Effective and aligned internal processes determine how value gets created and sustained. Companies must focus on the critical few internal processes that deliver the differentiating value proposition and that are most critical for enhancing productivity and maintaining the organization’s franchise to operate. In Part II of this book, we introduce a taxonomy that classifies internal processes into four clusters:
- Operations management: Producing and delivering products and services to customers
- Customer management: Establishing and leveraging relationships with customers
- Innovation: Developing new products, services, processes, and relationships
- Regulatory and social: Conforming to regulations and societal expectations and building stronger communities
Each of these clusters can have literally hundreds of subprocesses that create value in some way. Executives practicing the art of strategy must identify the critical few processes that are the most important for creating and delivering the differentiating customer value proposition. We refer to these critical few processes as the strategic themes.
Strategy consists of simultaneous, complementary themes. Each cluster of internal processes delivers benefits at different points in time. Improvements in operational processes generally deliver short-term results through cost savings and quality enhancements. Benefits from an enhanced customer relationship start to phase in six to twelve months after the initial improvement in customer management processes. Innovation processes generally take even longer to produce higher customer revenues and operating margins, and the benefits from enhanced regulatory and social processes can occur further in the future as companies avoid litigation and enhance their reputations in the community. Strategies should be balanced, incorporating at least one strategic theme from each of the four internal clusters. By having strategic themes for enhancing processes in all four internal clusters, the organization realizes benefits that phase in over time, generating sustainable growth in shareholder value.
Strategic alignment determines the value of intangible assets. The fourth perspective of the Balanced Scorecard strategy map, learning and growth, describes the organization’s intangible assets and their role in the strategy. Intangible assets can be classified into three categories:
- Human capital: Employees’ skills, talent, and knowledge
- Information capital: Databases, information systems, networks, and technology infrastructure
- Organization capital: Culture, leadership, employee alignment, teamwork, and knowledge management
None of these intangible assets has value that can be measured separately or independently. The value of these intangible assets derives from their ability to help the organization implement its strategy. Our research studies show, however, that two-thirds of organizations do not create strong alignment between their strategies and their HR and IT programs.17 The considerable investments, by these unaligned organizations, in HR and IT programs are off target. They do not facilitate the organizations’ ability to execute their strategies. And these organizations are unlikely to generate a positive return on their HR and IT investments.
We have identified three targeted approaches for aligning intangible assets to strategy:
- Strategic job families that align human capital to the strategic themes
- The strategic IT portfolio that aligns information capital to the strategic themes
- An organization change agenda that integrates and aligns organization capital for continued learning and improvement in the strategic themes
When all three components in the learning and growth perspective—human, information, and organization capital—are aligned with the strategy, the entity has a high degree of organization readiness: It has the ability to mobilize and sustain the process of change required to execute its strategy. Organization readiness is high when:
- Human capital capabilities in strategic job families are aligned closely to the strategic themes.
- Information capital provides the vital infrastructure and strategic IT applications that complement the human capital for promoting outstanding performance in the strategic themes.
- Culture, leadership, alignment, and teamwork reinforce the changes in organization climate required to execute the strategy.
In summary, the strategy map template, customized to the organization’s particular strategy, describes how intangible assets drive performance enhancements to the organization’s internal processes that have the maximum leverage for delivering value to customers, shareholders, and communities. Readers can get introduced to the use of strategy maps to align intangible assets to strategic themes by studying the two case studies following this chapter. The Bank of Tokyocase illustrates the design of a private-sector strategy map and scorecard. The American Diabetes Association case illustrates the nonprofit-sector approach.
BOOK STRUCTURE
In Chapter 2, we provide a primer on strategy maps. We explain the strategy map template (see Figure 1-3) and describe the selection of objectives in the four Balanced Scorecard perspectives. Part II of the book contains four chapters that explore in depth the objectives and measures for processes in the four internal perspective themes: operations management, customer management, innovation, and regulatory and social processes. Part III contains four chapters on aligning the learning and growth perspective to the strategic internal processes. Chapter 7 provides an overview for value creation from intangible assets. Chapters 8 through 10 provide in-depth descriptions of selecting objectives and measures for human capital, information capital, and organization capital. In Part IV, Chapter 11 applies the foundational material in Parts II and III to constructing strategy map templates for four generic differentiating strategies: low total cost, product leadership, total customer solutions, and lock-in. Chapter 12 provides the implementation road map by describing how stretch targets for organizational performance can be translated into subtargets for the major strategic themes in the map. The subtargets guide the selection of strategic initiatives and programs for driving the performance breakthroughs.
After each chapter in the book, and in Part V, we present brief excerpts from our case files. Each excerpt contains the context and strategy of the organization, its strategy map, and some results from managing with the strategy map. The organizations used the strategy map to clarify strategy at the executive level; communicate strategy to employees; align business units, departments, functions, and initiatives; and focus management processes. The implementing organizations include manufacturing and service companies, large for-profits and small nonprofits, and several public-sector agencies ranging from a school district to a national department of defense. They are drawn from experiences in North, Central, and South America and Europe and Asia. Collectively, these case excerpts represent the most comprehensive portfolio of strategy descriptions we have seen assembled. We hope that these illustrations of the principles articulated in our text will inspire many other organizations to exploit the power of strategy maps to develop and align their intangible assets for the journey to become strategy-focused organizations.
This book is directed toward managers who will be leading Balanced Scorecard projects. It provides them with a detailed conceptual framework to guide the important choices they must make—about the critical few internal processes at which they must excel for their strategy to succeed, and on the investments required in their human resources, information technology, and organizational culture and climate. Executives who wish to learn how to put their strategy maps and Balanced Scorecards into action may want to study the framework in our previous book, The Strategy-Focused Organization. Our goal in this book is to provide insights for practitioners and implementers—coming from strategic planning, quality, human resources, information technology, or finance—on how to build a comprehensive, integrated visual representation of their strategy, the first step to becoming a strategy-focused organization.
NOTES
1. GDP per Capita in Selected Resource-Poor and Resource-Rich Countries
| Resource-Poor Countries | 1970 GDP per Capita | 1998 GDP per Capita |
| South Korea | 1,954 | 12,152 |
| Taiwan | 2,987 | 15,012 |
| Singapore | 4,438 | 22,643 |
| Hong Kong | 5,695 | 20,193 |
| Israel | 8,102 | 15,152 |
| Denmark | 12,685 | 22,123 |
| Resource-Rich Countries | 1970 GDP per Capita | 1998 GDP per Capita |
| Indonesia | 1,194 | 3,070 |
| Nigeria | 1,233 | 1,232 |
| Former USSR | 5,569 | 3,893 (Russia) |
| Saudi Arabia | 7,624 | 8,225 |
| Venezuela | 10,672 | 8,965 |
Source: A. Maddison, The World Economy: A Millennial Perspective (Paris: OECD, 2000). Numbers are in constant 1990 dollars.
2. G. Bennett Stewart, The Quest for Value (New York: HarperBusiness, 1991); A. Rappaport, Creating Shareholder Value: A Guide for Managers and Investors (New York: Free Press, 1997).
3. Don Peppers and Martha Rogers, Enterprise One to One: Tools for Competing in the Interactive Age (New York: Currency/Doubleday, 1997).
4. Michael Hammer and James Champy, Reengineering the Corporation: A Manifesto for Business Revolution (New York: HarperBusiness, 2001); Michael Hammer, Beyond Reengineering: How the Process-Centered Organization Is Changing Our Work and Our Lives (New York: HarperBusiness, 1996).
5. Peter S. Pande, Robert P. Neuman, and Roland R. Cavanagh, The Six Sigma Way: How GE, Motorola, and Other Top Companies Are Honing Their Performance (New York: McGraw-Hill, 2000); David Garvin, Managing Quality: The Strategic and Competitive Edge (New York: Free Press, 1988).
6. Gary Hamel and C. K. Prahalad, Competing for the Future (Boston: Harvard Business School Press, 1996); D. J. Collis and C. A. Montgomery, “Competing on Resources: Strategy in the 1990s,” Harvard Business Review (July–August 1995): 118–128.
7. Gary Hamel, Leading the Revolution (Boston: Harvard Business School Press, 2000); Clayton Christensen, The Innovator’s Dilemma: When New Technologies Cause Great Firms to Fail (Boston: Harvard Business School Press, 1997).
8. Dave Ulrich, Human Resource Champions: The Next Agenda for Adding Value and Delivering Results (Boston: Harvard Business School Press, 1996).
9. Peter Weill and Marianne Broadbent, Leveraging the New Infrastructure: How Market Leaders Capitalize on Information Technology (Boston: Harvard Business School Press, 1998).
10. Ronald N. Ashkenas, Steve Kerr, Dave Ulrich, and Todd Jick, The Boundaryless Organization: Breaking the Chains of Organizational Structure, rev. ed. (New York: Wiley, 2002); Michael Tushman and Charles A. O’Reilly III, Winning Through Innovation: A Practical Guide to Leading Organizational Change and Renewal, rev. ed. (Boston: Harvard Business School Press, 2002).
11. Peter Senge, The Fifth Discipline: The Art and Practice of the Learning Organization (New York: Doubleday, 1994); David A. Garvin, Learning in Action: A Guide to Putting the Learning Organization to Work (Boston: Harvard Business School Press, 2000).
12. M. E. Porter, Competitive Strategy: Techniques for Analyzing Industries and Competitors (New York: Free Press, 1980); Competitive Advantage: Creating and Sustaining Superior Performance (New York: Free Press, 1985); and “What Is Strategy?” Harvard Business Review (November–December 1996).
13. Louis V. Gerstner Jr., Who Says Elephants Can’t Dance: Inside IBM’s Historic Turnaround (New York: HarperCollins, 2002); Jack Welch, Jack: Straight from The Gut (New York: Warner Books, 2001); Larry Bossidy and Ram Charan, Execution: The Discipline of Getting Things Done (New York: Crown, 2002); and Richard Teerlink and Lee Ozley, More Than a Motorcycle: The Leadership Journey at Harley-Davidson (Boston: Harvard Business School Press, 2000).
14. R. Charan and G. Colvin, “Why CEOs Fail,” Fortune, 21 June 1999.
15. Chris Zook, Profit from the Core: Growth Strategy in an Era of Turbulence (Boston: Harvard Business School Press, 2001).
16. Tiha von Ghyczy, Bolko von Oetinger, and Christopher Bassford, Clausewitz on Strategy: Inspiration and Insight from a Master Strategist (New York: Wiley, 2001),99.
17. SHRM/Balanced Scorecard Collaborative, Aligning HR with Organization Strategy Survey Research Study 62-17052 (Alexandria, VA: Society for Human Resource Management, 2002); “The Alignment Gap,” CIO Insight, 1 July 2002.
CASE STUDIES
BANK OF TOKYO-MITSUBISHI HQA
Background
As one of the world’s largest banks, the Bank of Tokyo-Mitsubishi (BTM) manages more than $608 billion in assets across more than 700 locations in Japan and throughout the world. BTMHQA, the bank’s New York–based Americas headquarters, decides the offerings of its Americas operations—which commercial, investment, and trust banking products and services it will market to its multinational customers. BTMHQA’s mission is “to be the number one foreign wholesale bank in the Americas.”
In 2000, as part of a global initiative, BTM’s Americas operations were reorganized into four independently managed business units (global corporate banking, investment banking, treasury, and corporate center), each reporting directly to its respective head office in Tokyo. As a result of these changes and changes in the regulatory environment, BTMHQA realized that it was no longer enough for strategy to be implicitly understood by top management. Its leaders needed to reinforce the strategic message throughout the organization.
The Situation
Japanese organizations are renowned for competing successfully without well-articulated strategies. That has never been a necessity in a society whose people are culturally so in tune with one another that business can practically run on ishin-denshin (mental telepathy). But as BTMHQA discovered, this practice has been losing its effectiveness in the global economy, where workforce diversity and the sheer speed of business require clear articulation of strategy for organizational success.
Unifying any workforce to a common set of strategic goals is daunting enough, but at BTM it was magnified by many cultural differences. Traditional Japanese ways of doing business prevailed; executive decisions were not routinely disclosed throughout the organization, and until recently, Japanese nationals dispatched from Tokyo occupied most leadership positions. Other common practices included rotating employees throughout functional areas (to foster cultural unity) and lifetime employment. And BTMHQA still relied upon seniority, instead of short-term performance, as the primary basis for promotion.
The Strategy
In 2001, with the Japanese banking industry still mired in recession and regulatory authorities increasing their risk-related oversight of financial institutions, BTMHQA began to question the effectiveness of its corporate governance, despite its stellar growth.1
Takehiko Nagumo, vice president for corporate planning, turned to the Balanced Scorecard because he felt it was the right vehicle to implement a common strategic platform, a needed risk-control framework, and, eventually, a new pay-for-performance system with coherence and synergy. “We knew that we would first have to articulate each unit’s strategy before we could even determine the integrated regional strategy, and a bottom-up approach seemed to be an essential first step,” says Hideo Yamamoto, senior vice president and group head of corporate planning. A task force of representatives from each business unit developed a worksheet for each group to complete, and the team crafted the integrated regional strategy from the collected responses.
The Strategy Map
In building its Americas-level scorecard, BTM first established a “strategic foundation,” which defined broad categories and themes within the four perspectives of the Balanced Scorecard that each objective would be aligned to. Each objective was classified according to three types of objectives—common, shared, or unique.
a. Common: A mandatory bankwide objective, of which there were six in total. Example: “Enhance cost efficiency,” required in the financial perspective of every scorecard.
b. Shared: An interdivisional objective shared by units that are expected to cooperate to achieve specific results. Examples: “Streamline credit-approval process,” an internal process objective for operational excellence shared among the credit and lending units; “Enhance collaboration throughout the supply chain,” shared among front, middle, and back offices; and “Close collaboration between relationship managers and product offices,” meant to facilitate the offering of high-value products to targeted customers.
c. Unique: An intradivisional objective to be fulfilled independently by a given group. Example: “Maintain ‘know your customer’ files,” an internal/risk management objective of the treasury office.
This classification system became the template for the bank’s Americas score-card as well as for each business unit’s scorecard. Visually, employees could now easily see the juxtaposition of themes, categories, and shared objectives.
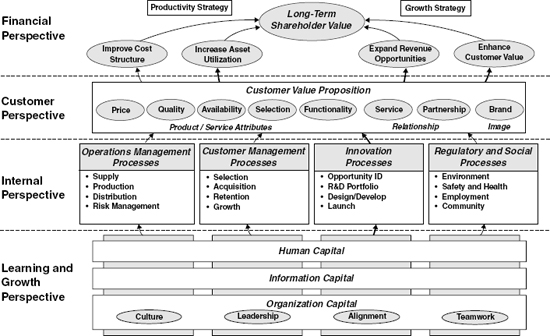
As an example of the type of strategy map that resulted, the Global Corporate Banking Business Unit (GCBU)-Americas strategy map reflects a strong emphasis on revenue growth, risk management, and productivity as follows (see Figure 1-4):
A. Financial
Setting “maximize net income after credit costs” as the ultimate goal, GCBU-Americas identified four core components in the financial perspective:
- Emphasize investment banking fee income rather than traditional interest income.
- Grow income from Japanese customers operating in the Americas and non-Japanese multinationals with whom BTM has a global relationship.
- Minimize credit costs, particularly in large U.S. corporate and Latin American segment.
- Adopt drastic cost reduction efforts on an enterprise-wide basis.
B. Customer
To be recognized as the best foreign bank operating in the Americas (particularly in the United States) by its core customers both in Japanese and non-Japanese segments, GCBU-Americas tries to differentiate its products and services on several key points: reliable lending capabilities, an extensive global network, and service quality that meets high standards for accuracy and speed.
C. Internal
Grow revenues: The GCBU-Americas revenue growth strategy consists of four major components: (1) Generating revenue by supporting Americas clients’ business in Asia; (2) delivering highly customized products through collaboration between relationship managers and product managers; (3) clear customer segmentation based on profitability and risk appetite; and (4) clear definition of risk appetite and alignment to business strategy.
Figure 1-4 Bank of Tokyo-Mitsubishi Global Corporate Banking BU (Americas) Strategy Map
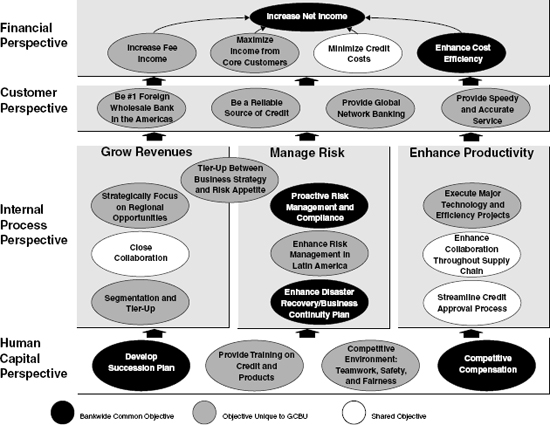
Manage risk: (1) Emphasis on proactiveness rather than reactiveness in identifying and mitigating risks in all areas of the bank; (2) minimization of transfer risks associated with credits in Latin America (where the business environment is often difficult); and (3) emphasizing the importance—especially after September 11—of disaster recovery and business continuity management as an integral part of bankwide risk management.
Enhance productivity: (1) Execute major technology and efficiency projects; for example, ensuring that the IT infrastructure can support operational competitiveness; (2) Enhance collaboration throughout the supply chain. To deliver customized products at desired speed, it is critical to optimize collaboration among front, middle, and back offices. The objective is applied to these offices as a shared objective; (3) Streamline credit approval process. The speed of credit approval enhances customer satisfaction as well as competitive advantage. As a shared objective among the front office (which prepares credit applications) and the credit division (which grants approval on the credit applications), GCBU-Americas tries to minimize the cycle time of credit delivery.
D. Human Capital
In a multicultural organization, it is critical to set clear standards in the management of human resources. Recognizing that people are the capital that most significantly influences BTM’s competitiveness, GCBU-Americas adopted four objectives that are set as bankwide priorities in the human resources area. They represent an interesting blend of practices, both Japanese and local.
- Succession planning: To maintain stability of operations by identifying key personnel well in advance and preparing succession plans for those people. Since Japanese staff rotate back to Japan every four to six years on average, and U.S. employees often change jobs or employers to elevate their careers (in contrast to the Japanese practice of lifetime employment), preparation of succession plans for all personnel is important for stable operations.
- Training: To enhance credit risk management capabilities—a critical competency for all professionals in the banking business.
- Work environment: To maintain a good teamwork orientation (a traditional Japanese organizational strength), safety where all basic standards are met, and fairness where no discrimination (race, sex, age, or nationality) of any kind exists.
- Pay-for-performance: Blending Japanese seniority-based management style with the U.S. performance-based HR architecture, GCBU-Americas is working to establish a bankwide best practice in this area.
Anecdotes
Scarcely one year after adoption, changes were already visible. Strategy had started to become “everyone’s job.”
- Almost immediately after developing strategy maps, employees began talking about strategy for the first time because they knew what it was. The maps created a foundation for discussions at meetings. Also, BTM employees immediately recognized that performance against strategy needs to be measured—it’s not just a conceptual exercise.
- Employees in support and oversight functions (such as HR, audit, and credit examination) became familiar with quantitative approaches to managing performance. They became more focused on the bottom line, and senior management had better control over their activities.
- Shared objectives helped to unify the back (processing), middle (risk assessment and review), and front (deal-making and customer-facing) offices. The bank’s New Jersey–based operations unit met regularly with front and middle offices about how to improve collaboration along the supply chain and accelerate results for their shared measures.
- Internal BTM auditors explicitly recognized the Balanced Scorecard as an effective means of enhancing corporate governance.
- Risk managers now make regular presentations on the metrics in their scorecards. One powerful metric in the BTMHQA scorecards is “share of issues,” which measures the percentage of issues identified through Committee of Sponsoring Organizations of the Treadway Commission (COSO)-based self-assessment out of all of the issues identified by other parties such as internal and external auditors and regulators.2 The higher the percentage, the more proactively the bank’s business lines are identifying risks. This metric had an immediate effect of making the business lines pinpoint risks they had previously ignored or waited to react to. The associated metric “share of issues closed during period” now forces a quicker resolution of risk issues. This metric reflects BTMHQA’s efforts to emphasize the importance of being more risk sensitive, based on the assumption that a business is more aware of its own risk than anyone else. Waiting for third parties to identify risks is too reactive an attitude and is no longer tolerated at the bank. Linking COSO-based self-assessment to the BSC to enhance its effectiveness is perhaps the most creative aspect of BTMHQA’s Scorecard initiative.
Mr. Naotaka Otaba, CEO of BTMHQA, commented:
As the regional head of a Japanese company operating in the Americas, I have been particularly interested in the synergy between Japanese business culture and U.S. best practices. It is in this context that we have developed a Balanced Scorecard initiative, which, in addition to becoming the core methodology for strategy management and performance measurement for our bank in the Americas, has also underlined the importance of teamwork in implementing the “Tone at the Top.”
Our next challenge is the further development of business process improvement practice, such as those that have been successfully adopted by many Japanese manufacturers. We intend to enhance our Control Self-Assessment (CSA) methodology so that we can not only enhance our control environment for various business processes but also identify and remedy any defects in those processes. We plan to integrate this CSA methodology with the Balanced Scorecard initiative in order to foster improved governance.
Once fully integrated, we expect that these methodologies will form the basis for a successful integration of the best Japanese and U.S. business practices. If successful in the Americas, we would like to propose the initiative for implementation for our operations in Japan.
_______________
Case prepared by Barnaby Donlon of Balanced Scorecard Collaborative and Takehiko Nagumo of Bank of Tokyo-Mitsubishi. Our thanks to Mr. Naotaka Obata, CEO of BTMHQA,for sharing the BTMHQA experience with us.
NOTES
1. The 2000 Gramm-Leach-Bliley Act and other market developments have prompted U.S. regulators to focus increasingly on corporate governance as a critical factor in sound banking practice.
2. The Committee of Sponsoring Organizations of the Treadway Commission (COSO) is a voluntary private-sector organization dedicated to improving the quality of financial reporting through business ethics, effective internal controls, and corporate governance. Accoringly, BTM’s COSO control self-assessment is a voluntary operational risk management program. See <http://www.coso.org>.
AMERICAN DIABETES ASSOCIATION
Background
The American Diabetes Association (ADA), one of America’s largest nonprofit health organizations, provides research, information, and advocacy on diabetes. Its operating revenues in fiscal year 2002 were $188 million. ADA is headquartered in Alexandria, Virginia, with offices in every state. It has a professional staff of 1,000 employees, tens of thousands of volunteers, and several million donors and members who annually offer their time and energy to ADA.
ADA’s mission is to “prevent and cure diabetes and to improve the lives of all people affected by diabetes.” Its vision is to “make an everyday difference in the lives of people affected by diabetes.” Its goal, under CEO John H. Graham IV, is “by 2007 to be the leading diabetes organization by increasing income to $300 million to better support its efforts and programs of research, information, and advocacy.”
The Situation
Although ADA merged fifty-seven separate corporate organizations in 1998, it was still not operating as a single organization with a defined organizational culture. The foundation elements were in place with a vision and corporate strategy; but it had little consensus on how to execute the strategy. The organization needed a way to measure success beyond raising money and managing expense ratios so that it could sustain future performance. Unlike many organizations, ADA decided to address the strategy execution issue while it was healthy—experiencing double-digit growth—instead of waiting until financial support stagnated or declined.
ADA used the Balanced Scorecard to bring business discipline to the execution of strategy. By balancing “growth” with “operational efficiency,” it would create greater value for its stakeholders and constituents. This balanced approach allowed ADA to focus on a value proposition that would create sustainable excellence and not attempt to do all things for all people.
The Strategy Map
As shown in Figure 1-5, ADA’s mission was to satisfy the needs of both stakeholders and constituents. Stakeholders include the board of directors, community volunteer leadership, and high-impact individuals who provide primary oversight for ADA’s work. Constituents are the donors, corporations, diabetes professionals, diabetic individuals, high-risk individuals, and information seekers who receive value from ADA’s products and services. These two groups share the same primary outcome: progress toward prevention and a cure. On the road to finding that cure, both groups want to improve quality of life for those people whose lives are affected by diabetes. A key input to improving quality of life is improving quality of care.
ADA must be economically viable to meet its stakeholder and constituent objectives. It wants to increase net margin growth by growing revenues while at the same time operating efficiently. ADA expects that this combination of financial objectives will help it maintain its ability to serve stakeholders and constituents over the long run.
Figure 1-5 American Diabetes Association Strategy Map
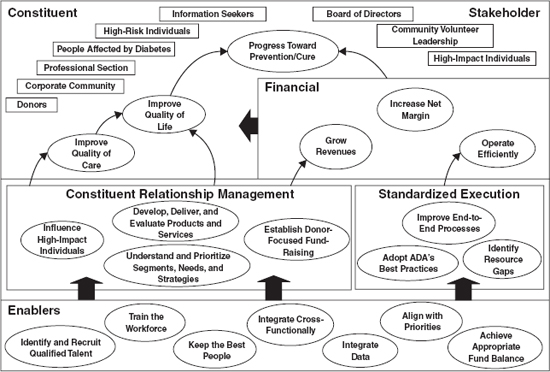
Stakeholder, constituent, and financial objectives will be achieved through two strategic themes: constituent relationship management and standardized execution. A driver of effective management of constituent relationships is to understand and prioritize segments, needs, and strategies. ADA will pick those groups and areas where it can have the most impact. This process objective will also enable ADA to influence policy makers with respect to more beneficial diabetes legislation. With priorities established for segment needs, ADA will be better able to develop, deliver, and evaluate products and services that meet its constituent and stakeholder needs. Finally, understanding segments ensures that it can establish donor-focused fund-raising. Fund-raising will become more donor-centric so that ADA can target the ways that its donors prefer to give versus how ADA thinks they should give.
The second strategic theme, standardized execution, requires improving end-to-end processes. ADA selected this theme because many of its existing internal processes were not well integrated or highly focused on providing internal or external value. Much of the targeted process improvement would come from adopting ADA best practices, capturing the best business practices that already existed within the organization. Additionally, identifying resource gaps would enable ADA to allocate incremental resources to important but currently underfunded processes.
The foundation of ADA’s strategy is its human and organizational enablers. To have a talented workforce, both volunteers and staff, ADA must identify and recruit qualified talent; train the workforce; and keep the best people. People will stay with ADA if they experience an environment in which they feel valued. The drivers for this objective are an organization that integrates cross-functionally, integrates data, and aligns with priorities. In this way, people support one another’s work and all work toward common ends. A final enabler for strategic success is to achieve appropriate fund balance. In summary, ADA’s strategic linkages are that by focusing human and organizational enablers to support critical internal capabilities, the organization can better provide the desired value proposition to constituents and stakeholders in a financially responsible way.
Anecdotes
ADA’s executive team reported that the process of building the strategy map was as valuable as the result, the map itself. But the process was not easy. The building of the ADA’s strategy map and, subsequently, the Balanced Scorecard, brought a discipline and logic to the leadership team’s strategic decision making that had not existed before. The strategic objectives on the map were debated until consensus was reached. The dialogue allowed ADA to clarify its stakeholders and constituents, define its deliverables, and describe its competitive capability. The end result provided a clear basis for internal and external communication on objectives and strategy. ADA could now explain “why it was doing some things and not others.”
_______________
Case prepared by Mario Bognanno of Balanced Scorecard Collaborative and Tom Bognanno of ADA. Our thanks to John Graham and his colleagues for sharing the ADA experience.