C H A P T E R F O U R T E E N
PUBLIC-SECTOR ORGANIZATIONS
IN THIS CHAPTER we present strategy map case studies of:
- Royal Canadian Mounted Police (RCMP)
- Economic Development Administration (EDA) of the U.S. Department of Commerce
- United Kingdom Ministry of Defence (MoD)
- Fulton County School System (FCSS)
The RCMP offers policing services to local municipalities, provinces, territories, and the Canadian nation. It developed a strategy map to coordinate and align its diverse initiatives, ranging from community policing to an internationally coordinated fight against terrorism. The strategy map made operational the RCMP mission of “safe homes and communities.”
The EDA promotes economic activity in America’s economically distressed communities. A new administrator developed a strategy map and Balanced Scorecard for EDA to revive a demoralized and underperforming government agency. The clarity and focus of the new strategy helped EDA become an efficient and effective government agency that now meets or exceeds targets for creating jobs and encouraging private-sector investment.
The U.K. Ministry of Defence, with a £25 billion ($40 billion) budget and more than 300,000 military and civilian personnel, is the fifth-largest military spender in the world. Its mission is to provide for the national defense, as well as to foster international peace and security. U.K. MoD developed a strategy map to facilitate a major modernization program that would transform the armed forces for the new security environment. In addition to realizing benefits from better internal communication, decision making, and teamwork, U.K. MoD uses its strategy map and Scorecard in its negotiations with the U.K. Treasury by demonstrating the impact of various funding scenarios on the MoD mission.
The Fulton County School System, in metropolitan Atlanta, Georgia, is perhaps the first school district to adopt the Balanced Scorecard. Building upon an existing and excellent quality initiative, the process of developing a strategy helped to align its various stakeholders—students, teachers, principals, parents, communities, and school district administrators—to specific outcome performance measures. FCSS has enjoyed substantial and recognized performance improvements with its new management system.
ROYAL CANADIAN MOUNTED POLICE
Background
The Royal Canadian Mounted Police (RCMP) is Canada’s storied and historic national police organization. Created in 1873, and inspired by the Royal Irish Constabulary and the mounted rifle units of the U.S. Army, the Royal North West Mounted Police was created to bring law, order, and Canadian governance to the North-West Territories (present-day Alberta and Saskatchewan).
Today, the Royal Canadian Mounted Police is the Canadian national police service and an agency of the Ministry of the Solicitor General of Canada. The RCMP is unique in the world since it is, simultaneously, a national, federal, provincial, and municipal policing body. The organization provides a total federal policing service to all Canadians and policing services under contract to the three territories, eight provinces (all except Ontario and Quebec), approximately 200 municipalities, and up to sixty-five First Nations aboriginal communities. With more than 22,000 employees, approximately 750 local RCMP detachments across Canada, and a budget in excess of $2.6 billion (CAD), today’s RCMP leads Canada’s counterterrorism and anti-organized crime efforts, while demonstrating excellence at “on-the-ground” community-based policing across Canada.
The Strategy
In 2000, the RCMP undertook to develop a robust strategic performance management system to address three key issues:
- Describe the vision and strategic direction of a newly-appointed Commissioner (G. Zaccardelli) who had a mandate to lead the organization into the twenty-first century with a new policing model, capable of meeting the challenges of the third millennium, and a passion for organizational excellence
- Align the disparate elements of a national organization around a set of common strategic and operational priorities
- Enhance credibility with funding agencies by successfully executing this strategy and achieving demonstrable, measurable results
The foundation of this passion for strategy execution was the unveiling of a new strategic framework—a document that expressed the RCMP’s highest-order policing objectives. The strategic framework aligns the core strategic outcome of the RCMP—“Safe Homes and Communities” with the key organizational priorities that drive and influence this outcome.
At the heart of the strategy are five key strategic themes:
- Reduce the threat and impact of organized crime
- Reduce the threat of terrorist activity
- Reduce youth involvement in crime
- Maximize support of international operations and initiatives
- Facilitate safer and healthier aboriginal communities
The RCMP Leadership Team decided that the five themes represented the key “levers” of success. If RCMP could achieve success across the five themes, its core strategic outcome of “Safe Homes and Communities” would be realized.
The Strategy Map
The RCMP decided to adopt the Balanced Scorecard as the tool to manage the execution of the strategic framework. The Balanced Scorecard would enable the RCMP to accomplish the following:
- Translate the strategic framework into a series of coherent objectives, measures, and targets. In short, the BSC would describe and measure the RCMP strategy
- Make accountability for results against the strategic framework more open and transparent
- Ensure organizational alignment by cascading the scorecard into each of the divisions and functional areas of the organization
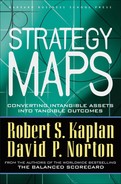
The Commissioner of the RCMP would manage the high-level Strategic Executive Council (SEC) strategy map (see Figure 14-1). This map provides direction and clarity to each of the subsidiary strategy maps, and a clear line of sight between the police operations in a division or detachment, and the Commissioner’s priorities.
Figure 14-1 Royal Canadian Mounted Police Strategy Map
The SEC strategy map adopts the traditional public-sector architecture for describing strategy. The “North Star” for the strategy is the Strategic Framework document that breathes life into the mission of the entire organization.
The clients, partners, and stakeholders perspective captures the RCMP value proposition to the core groups it serves: funding agencies, other levels of government (both domestic and international), and citizens in direct receipt of policing services. For example, the value proposition for funding agencies is for the RCMP to be “the best-managed organization in government,” whereas the value proposition for partners is to “live core values that make us a trusted partner.” Each of these objectives contributes to a primary objective to excel at leading-edge policing. In summary, the RCMP overall value proposition delivers world-class, leading-edge policing services, at a minimum cost, to partners, stakeholders, and citizens.
Internal process themes link to core group customer value propositions. For example, communication, partnership, and alliance processes in the bridge-building theme support the goal of becoming a trusted partner. Processes in the operations theme maximize the use of the operations model—an RCMP methodology for being intelligence-led in all activities and conducting investigations. This objective is placed at the heart of this theme, since excelling at the operations model will increase the quality of all the policing operations that support the strategic framework. Finally, processes in the management excellence theme support the requirements of the funding agencies.
The people, learning, and innovation perspective capture the importance the RCMP places on providing a dynamic and safe work environment for its employees.
Anecdotes
Using the SEC strategy map as a strategic guide, scorecards were developed in the remaining five business lines and four corporate headquarters functions, as well as for each of the fourteen operational divisions and four regional administrative centers across Canada.
This traditional approach to strategy maps was augmented by a significant breakthrough in how strategy maps are designed and used in large, matrixed public-sector institutions.
Embedded in the SEC strategy map is a reference to the five strategic priorities contained in the RCMP strategic framework (terrorism, organized crime, youth, aboriginal communities, and international policing). Understanding that each of these required national-level strategic coordination, the RCMP developed five “virtual” strategy maps for each of these priorities. These maps are accompanied by measures, targets, and the initiatives required to execute each of the five strategic priorities. Each strategic priority and virtual strategy map is owned by an RCMP executive. A panel of executives meets periodically to review progress against the strategic priorities.
To ensure alignment and consistent execution of these strategic priorities, each objective on the virtual strategy maps was assigned to a business line, or corporate service line, and placed on the relevant strategy map. The business lines similarly cascaded critical objectives, measures, targets, and initiatives to the divisional-level strategy maps. The end result was a set of linked and aligned strategies devoted to the execution of the five strategic priorities of the organization. The business lines and divisions also added objectives to their strategies that reflected the specific realities of the division and business line operations.
The final step in implementation of the Balanced Scorecard has been performance reporting. The RCMP has created a simple “dashboard”; for the short term an Excel spreadsheet has been developed to enable the reporting of progress against the objectives and their corresponding initiatives, measures, and targets identified in the Scorecard.
Beginning in September for the 2004-2005 fiscal year, the intent is to implement full strategy-focused business planning and the allocation of resources against strategically aligned priority initiatives at all levels in the organization. The Balanced Scorecard–based business plans will drive budget allocation, as resources are allocated to the priority-aligned initiatives identified in the objectives and Scorecards. Business planning will, in effect, focus on critical initiatives driving strategic priorities.
_______________
Case prepared by Andrew Pateman of Balanced Scorecard Collaborative and Geoff Gruson of the RCMP. Our thanks to Commissioner Zaccardelli for sharing the RCMP experience.
U.S. DEPARTMENT OF COMMERCE ECONOMIC DEVELOPMENT ADMINISTRATION (EDA)
Background
The U.S. Department of Commerce helps American businesses and communities achieve greater success both at home and abroad through the work of thirteen different bureaus reporting to the Secretary of Commerce.
Congress established one bureau, the Economic Development Administration (EDA), in 1965 during President Lyndon Johnson’s War on Poverty. EDA’s mission is to work with states, local governments, and nonprofit organizations to help bolster economic activity in America’s economically distressed communities.
Whereas the basic role of the bureau has remained unchanged since its inception, support for EDA has ebbed and flowed dramatically over the years. President Reagan called for the abolishment of EDA during his first State of the Union Address. During his administration, the bureau was not an officially authorized federal program, meaning that neither the Congress nor the executive branch took the necessary steps to approve legislation to officially continue authorization of the bureau’s activities.
An odd quirk in federal government practice allows for programs that can secure funding to operate even if they are not officially authorized. EDA was eventually reauthorized in 1998, but the many years of uncertainty had exacted a severe toll. Buffeted by reductions-in-force (the government term for layoffs), dwindling budgets, and an uncertain future, the organization had developed a “going-out-of-business” mentality, where survival was prized above all else.
The Situation
The arrival of President George W. Bush in 2001 presented EDA with an opportunity and a challenge. President Bush recognized the potential positive role that programs such as EDA could play in helping his administration achieve the goal of “leaving no geographic or demographic sector behind in the pursuit of the American dream.” President Bush also brought the same results-oriented management style to Washington that he employed while governor of Texas. Drastic change would be needed if EDA were to survive.
President Bush selected David A. Sampson as his assistant secretary of commerce for economic development. Dr. Sampson came to EDA with an extensive economic development background in the private sector. Among his first acts was to update and reaffirm EDA’s mission:
The mission of EDA is to help our partners across the nation to create wealth and minimize poverty by promoting a favorable business environment to attract private capital investment and jobs through world-class capacity-building, planning, infrastructure research grants, and strategic initiatives.
Dr. Sampson also established a bold goal: to transform EDA into the premier agency for domestic economic development.
To fulfill its mission and achieve the goal established by the assistant secretary, EDA embarked on a comprehensive strategy to transform the bureau by focusing on three pillars of reform:
- Establish sound organizational management
- Develop outcome-based performance measures
- Enhance communication with key stakeholders
EDA Strategy Map
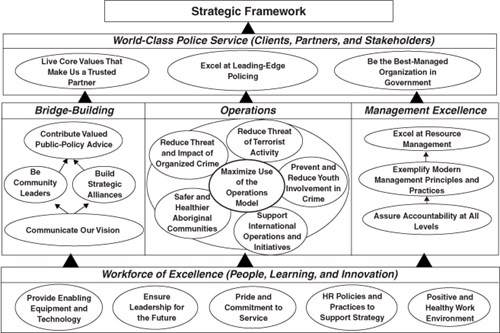
EDA exists to satisfy the needs of both stakeholders and customers (see Figure 14-2).
Stakeholders—the White House, Congress, Department of Commerce, and taxpayers—provide direction and oversight for EDA’s work, play a critical role in EDA’s funding, and serve as the guardians of the public interest. EDA would satisfy its stakeholders by becoming an effective, efficient, results-oriented agency.
EDA’s customers are distressed communities, investment partners, and private-sector businesses that directly or indirectly receive assistance from EDA and reap the benefits from economic growth. EDA must improve distressed communities by being knowledgeable and responsive advisers on economic development. EDA must also make investments that promote growth and show visible results. Such accomplishments would advance the administration’s domestic agenda.
EDA will meet its stakeholder objectives by satisfying the needs of its customers and achieving its financial goals.
In order to serve its customers, EDA must provide a transparent and responsive process that addresses the needs of the entities it serves. EDA, by providing information and technical assistance, will help its partners create large numbers of high-skill, high-wage jobs.
EDA must be fiscally responsible in accomplishing its customer objectives. It must streamline administrative processes. EDA must also leverage its limited resources by capitalizing on private-sector investment.
To meet expectations of shareholders and customers and achieve its financial objectives, EDA must execute on three strategic themes: internal policy leadership, high-impact investment, and organizational excellence.
Demonstrating policy leadership will allow EDA to serve as knowledgeable economic development advisers. In order to achieve policy leadership, EDA must first enhance research capabilities. Better information will strengthen EDA’s ability to make superior decisions about its investment policy. Improved research capabilities will also give it the credibility needed to provide policy options to the highest levels of government.
The high-impact investments will increase EDA’s ability to develop greater numbers of quality job opportunities. Enhanced research capabilities will support efforts to emphasize funding priorities. In turn, emphasizing funding priorities will enable EDA to expand deal flow by investing with new partners. A focus on enhanced due diligence will promote higher quality initial investment decisions and facilitate post-approval monitoring. The impact of these efforts will produce greater benefits for each taxpayer dollar spent.
Achievement of the first two themes will be assisted by a third strategic theme: organizational excellence. Organizational excellence refers to the internal processes necessary for EDA to become an efficient and effective organization. EDA must first align resources with strategic priorities by assigning the right people to the initiatives critical to EDA’s strategy. Next, improving EDA’s communication strategy and standardizing processes will create value by providing the understanding and the means to accomplish its goals. And EDA will maximize organizational effectiveness and efficiency by leveraging technology to enable key business processes to achieve high performance.
Figure 14-2 Economic Development Agency (EDA), U.S. Department of Commerce, Strategy Map
Finally, nothing at EDA would be accomplished without providing the skills, culture, and infrastructure necessary for its workforce to do the work required. EDA will help its people improve analytical skills and develop technology proficiency so that they can be successful. EDA will supplement current staff by attracting top talent to fill key posts. Talented people are not enough—the culture of EDA must foster a spirit that allows EDA to establish a performance culture. Information capital must be linked with human capital. EDA will establish an enterprise information system that will keep employees connected to each other, stakeholders, and customers and provide information necessary to do their jobs. These are the enablers for EDA success.
By focusing on its people and informational enablers to support its internal work processes, EDA will be better able to serve its customers, meet its financial goals, satisfy its stakeholders, and ultimately fulfill its goal “to become the premier standard-bearer for domestic economic development in the federal government.”
EDA Results
EDA’s results are already apparent. It has been singled out by the White House’s Office of Management and Budget as an efficient and effective government agency meeting or exceeding its targets for creating jobs and encouraging private-sector investment. The White House rewarded EDA with an increased funding request for fiscal year 2004. Considering the President’s focus on the critical needs of national and homeland security, EDA’s achievement is a significant milestone in its thirty-eight-year history.
_______________
Case prepared by Mario Bognanno of Balanced Scorecard Collaborative and Sandy K. Baruah and Danette R Koebele of EDA. Our thanks to Dr. David Sampson and his colleagues for sharing the EDA experience.
U.K. MINISTRY OF DEFENCE
Background
With a £25 billion ($40 billion) budget and more than 300,000 military and civilian personnel, the United Kingdom’s Ministry of Defence (MoD) is among Great Britain’s largest government departments—and is the fifth-largest military spender in the world. Comprising a navy, army, and air force, as well as eleven “top-level budgets” (akin to strategic business units), this immense organization has a broad mission: providing for the national defense, as well as fostering international peace and security. In recent years, the MoD has extended its personnel and influence worldwide to include humanitarian and peacekeeping missions in regions as far-flung as Kosovo, the Persian Gulf, and East Timor. At home, the ministry’s activities range from search-and-rescue operations to agricultural epidemic management.
The Situation
The MoD decided to adopt the Balanced Scorecard after a late-1990s strategic defense review—a radical assessment of the strategic implications of national foreign policy objectives that spurred the modernizing of Britain’s armed forces. As part of this review, the ministry also examined ways to contribute to a larger government-wide agenda centering on modernization. With the help of several strategic teams, the MoD’s Defence Management Board (DMB) began exploring ideas for enhancing its performance management in response to the modernization initiative. The Scorecard model promised to enable the ministry to streamline its performance management, as well as distill and communicate its strategy throughout the organization.
The Strategy Map
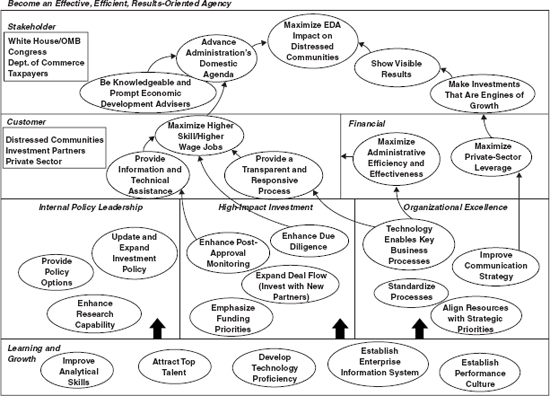
The ministry began building its strategy map and Scorecard by first explicating its strategy: “generating battle-winning defence capability” (see Figure 14-3). It then identified two overarching themes for the map—improved operational effectiveness and better use of resources. Together, these themes would define a path to fulfillment of the MoD’s strategy and achievement of its mission, as well as permeate every objective in the map’s four perspectives.
In laying out the strategy map’s perspectives, the MoD decided to forgo the traditional financial, customer, internal business process, and learning and growth perspectives. Instead, it defined its perspectives as
- Output deliverables: “Are we delivering what the government wants?” (Equivalent to the stakeholder perspective)
- Resource management: “Are we being good stewards of our personnel, reputation, defense infrastructure, and budget?” (Equivalent to financial perspective)
- Enabling processes: “What processes must we establish or improve to support our strategy?” (Similar to the internal processes perspective)
- Building for the future: “How can we invest in people, technology, and infrastructure to support our strategy?” (Reflecting the learning and growth perspective)
Figure 14-3 U.K. Ministry of Defence Strategy Map
The MoD’s map depicts numerous arrows connecting objectives. For this public-sector organization—in which resources are limited and investing in one resource means taking funds away from another—it is crucial to show the complex web of interactions and causality that the Scorecard team envisions. Here’s a closer look at several lines of reasoning that thread their way up through the strategy map:
- Building for the future perspective: In the Scorecard team’s thinking, the MoD’s ability to fulfill its strategy and mission starts with investing in the right people, technology, and modernizing infrastructure. For instance, the “investing in people” objective signifies a specific train of thought: If the MoD ensures satisfactory living conditions for enlisted men and women, provides them with sufficient time to spend with their families, and takes care of them in other ways, their morale will increase. With higher morale, the ministry will see improvements in retention (which the MoD’s Scorecard includes as a metric). Better retention in turn will support the objectives “manning [staffing] levels” and “reputation” in the resource management perspective, as well as “training” in the enabling processes perspective. Effective training further contributes to a positive reputation and sufficient manning levels. Moreover, sufficient manning levels translate into “military effectiveness”—that central output deliverables objective contributing directly to the strategy.
- Enabling processes, resource management, and output deliverables perspectives: Success on the objectives in the building for the future perspective bubbles up into numerous objectives in the other perspectives. For example, if the ministry can boost retention rates, it will then be freer to spend less on retention incentives and recruiting initiatives. Reduced spending in these areas will in turn liberate funds for other important objectives, such as enhancing technology and equipment. With the right technology and equipment in hand, the MoD can fulfill its “acquisition” objective, which translates into improved “defense infrastructure” and “annual budget”—two objectives that further feed “military effectiveness.”
Results
The ministry’s use of its strategy map and Scorecard has improved communication and teamwork within the organization, enhancing decision making. Equally vital, communication with other government offices has also improved. For instance, the MoD now uses its map and Scorecard during funding negotiations with the Treasury—the body that authorizes appropriations for the ministry. By removing the emotion from funding discussions and enabling the MoD to dispassionately demonstrate the impact of various funding scenarios, the strategy map and Scorecard focus these crucial conversations on what matters: facts, and the MoD’s and government’s key priorities.
_______________
Case prepared by Lauren Keller Johnson, a contributor to the Balanced Scorecard Report, with generous assistance from Royal Navy Captain Mike Potter, Royal Air Force Wing Commander Des Cook, and Simon Howard of the Performance Management Team at the U.K. Ministry of Defence. Special thanks to Sir Kevin Tebbit, Permanent Under Secretary, U.K. Ministry of Defence, for sharing the MoD experience.
FULTON COUNTY SCHOOL SYSTEM
Background
The Fulton County School System encompasses seventy-seven public schools in two subdistricts, north and south of the city of Atlanta. The district has 70,000 students and a $560 million annual budget (2001 data). The district had a history of excellent planning and management. In 1998, Dr. Stephen Dolinger, the FCSS superintendent, launched a Model of Excellence quality program guided by Malcolm Baldrige educational criteria. The criteria assigned up to 1,000 points based upon performance in seven categories: leadership; strategic planning; student, stakeholder, and market focus; information and analysis; faculty and staff focus; process management; and organizational performance results. Administrators felt that the Model of Excellence helped with local tactical activities and implementation but lacked alignment between strategy, performance measurement, and performance improvement.
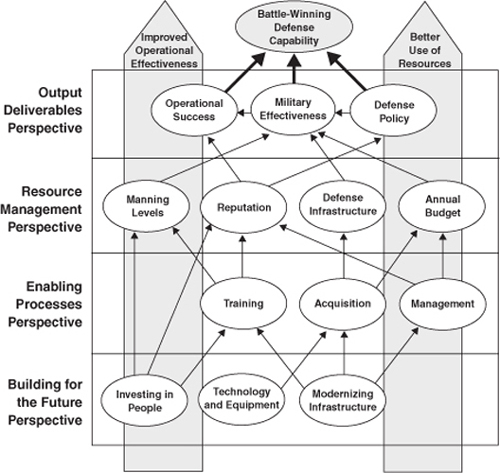
FCSS hired Martha Taylor-Greenway in November 1999 as director of strategic planning with a primary emphasis on enhancing the performance management system. Taylor-Greenway had previously worked as vice president of organizational development at United Way of America, where she had been the project leader for the first Balanced Scorecard implementation at a nonprofit organization, in 1996–1997. She felt that the Balanced Scorecard could provide a strategic framework, a bigger picture, within which the Model of Excellence initiative could operate. Taylor-Greenway facilitated the development of a Balanced Scorecard for FCSS that organized objectives and performance measures in five categories: student achievement, stakeholders, instructional and administrative processes, staff learning and growth, and financial performance (see Figure 14-4).
Strategy Map
The high-level social impact objectives on the FCSS strategy map represent objectives for student achievement: to master curriculum and be nationally competitive. FCSS measured curriculum mastery through scores on curriculum-based tests and high school completion and graduation rates. It measured its students’ national ranking through uniform exams, such as the Scholastic Aptitude Tests and Advanced Placement tests, as well as students’ performance in their first two years after graduation, either in college or in employment.
The next level of the strategy map captured one set of driver objectives for student achievement, creating a safe and enriching climate, measured by attendance, extracurricular participation, and student and parent perceptions of safety. This level also contained objectives for two other FCSS stakeholders: parents are involved and satisfied, measured by a parent survey on quality, responsiveness, and communication; and community is involved and has positive perception, measured by number of volunteer hours; donations of money, service, and product; number of community and business organizations involved with FCSS; and a community survey of quality, community, and safety.
The internal process objectives related to delivering value to students and the community included instructional effectiveness (teacher training and use of technology), transportation (safety and on-time arrivals), facilities and construction (facility inspection report, backlogged maintenance requests), readiness for start of school (percentage of books and teachers available on the first day of school, accurate enrollment and cost forecasts), and student nutrition (student participation in meal program).
Figure 14-4 Fulton County School System Strategy Map
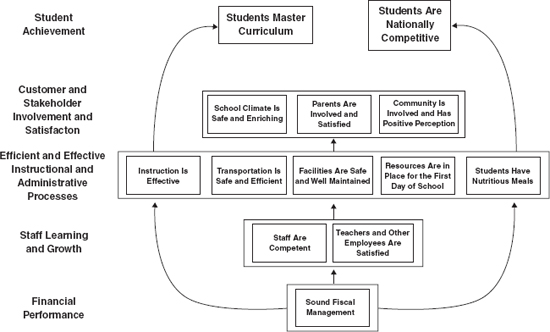
Learning and growth objectives related to staff competency, measured by teachers with at least seven years of experience, advanced degree, and national board certification; employee satisfaction, measured by staff attendance, attrition, and ratings of communication, teamwork, and morale. FCSS placed the financial perspective at the base of the strategy map with an objective for sound fiscal management, measured by expenditures on instruction support, fund balance, and budget variances.
The project team worked to ensure that valid data collection and reporting processes existed for each measure. It set systemwide performance targets for each measure based on historical trends and by benchmarking against other school districts. Local schools then developed initiatives aimed at contributing to meeting the designated targets. By the end of 2001, all FCSS schools were using the Balanced Scorecard to develop their strategic plans and to guide resource allocation.
Results
Among the short-term reactions and impact from the FCSS Balanced Score-card were the following:
- There was a 22 percent improvement (from 66 percent to 88 percent) in one year in students passing a standardized mathematics test.
- A principal developed a tool for tracking student and teacher progress during the year rather than waiting for end-of-year results.
- A high school principal declared, “I want 90 percent of my students to pass every standard. That’s what I put into the plan.”
- An assistant superintendent of an administrative department noted, “The plan has forced us to ask hard questions on why budget items exist. Why are we doing X if X doesn’t help us reach our goals?”
- An elementary school principal stated, “The Balanced Scorecard tells me which priorities are important to help the system perform better.”
In 2001, the Fulton County School Board approved a pay-for-performance plan for the superintendent and school district cabinet members based on achieving BSC systemwide targets. Even more significant, the board approved a financial incentive plan for teachers that could award up to $2,000 to employees who contributed to meeting the targets within their local school’s strategic plan. Individual schools set their own benchmarks and targets for this plan, guided by the central targets and approved by the central administration. The new incentive program changed the focus at local schools from performance measurement to performance rewards.
An article in the February 7, 2003 Citizen reported on the annual state-of-the-system address given by Dr. Thomas M. Payne, interim superintendent of FCSS. He noted:
The school system has made steady, deliberate progress to improve student achievement and organizational performance. We have consistently moved upward with no sudden peaks or slumps. … We have turned our organization around using a combination of best practices from education and business. We operate like a big business whose business is education.
Among the gains during the past two years noted by Dr. Payne were:
- The percentage of students meeting and/or exceeding state-level reading and math performance expectations had typically increased by about 5 percentage points.
- High school students earning college credit prior to graduation increased from 10 percent to 16 percent.
- 76 percent of students taking Advanced Placement exams earned a score of 3 or higher (a 39 percent increase from two years earlier and 17 percent higher than the regional average).
- The number of students taking the SAT exam increased from 1,837 to 3,192 over eight years; the average test score increased from 992 to 1039 during this period. At FCSS, 88 percent of high school seniors now took the SAT exam, compared to the national average of 45 percent.
- Only 7 percent of FCSS parents expressed a safety concern, compared to 31 percent nationally.
- Volunteer hours increased by more than 87,000; 98,000 volunteers now were supporting FCSS schools.
- 82 percent of parents expressed satisfaction with their childrens’ schools, compared to the national average of 68 percent.
- New schools opened on time and under budget.
- The first day of school began with textbooks, equipment, and supplies in place at all schools.
- Final budget was within 1 percent of projected revenue and expenses.
Dr. Payne used the Aesop fable of “The Tortoise and The Hare” to remind his constituents that perseverance, not speed, is most important when working toward a goal. FCSS will use its Balanced Scorecard performance management system for continuous improvement and to uphold its reputation as one of the premier school systems in Georgia and the nation.
_______________
We appreciate the active support of Martha Taylor-Greenway for providing access and documentation for the Fulton County School System story.