C H A P T E R F I V E
INNOVATION PROCESSES
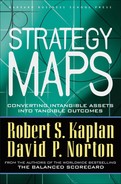
SUSTAINING COMPETITIVE ADVANTAGE requires that organizations continually innovate to create new products, services, and processes (see Figure 5-1). Successful innovation drives customer acquisition and growth, margin enhancement, and customer loyalty. Without innovation, a company’s value proposition can eventually be imitated, leading to competition solely on price for its now commoditized products and services.
Companies create considerable competitive advantages when they have the capability to bring innovative products—well-matched to targeted customers’ needs and expectations—to the market fast and efficiently. Product innovation is a prerequisite for participation in some dynamic, technologically based industries, such as pharmaceuticals, semiconductors, and telecommunications. Exceptional innovation capabilities determine the industry leaders.1
FOUR INNOVATION PROCESSES
Managing innovation includes four important processes:
- Identify opportunities for new products and services
- Manage the research and development portfolio
- Design and develop the new products and services
- Bring the new products and services to market
Figure 5-2 summarizes the principal objectives in these four innovation processes. We discuss each below.
Figure 5-1 Managing Innovation
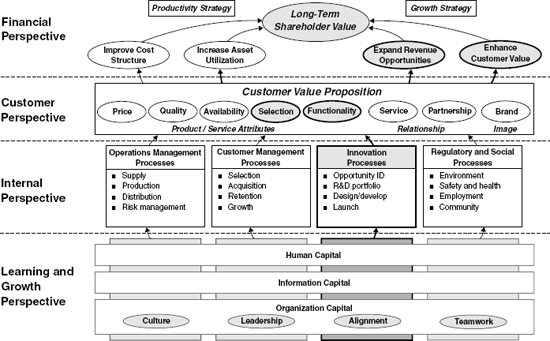
Figure 5-2 Innovation Management Strategy Map Template
1. Identify Opportunities
Ideas for new products can arise from many sources. Typically, the research and development organization generates ideas based on the skills and technological understanding that it has accumulated from past product and process innovations. For example, the research labs of pharmaceutical companies screen and evaluate new compounds for their abilities to mitigate specific diseases. More recently, these labs have been applying the science of molecular biology to determine the characteristics of drugs that would affect specific biological targets, such as cell receptors and enzymes.
But organizations should not be too inwardly focused in their search for new ideas. They need to generate ideas from external sources, such as research laboratories, universities, and, especially, suppliers and customers. Companies that treat suppliers as strategic partners, rather than just as a source of low-priced materials and components, can benefit from suppliers’ new product ideas and capabilities. Leading-edge customers are often a prime source of ideas for new products and new capabilities. For example, medical instrument companies continually speak with leading physicians around the world to learn about opportunities for new capabilities to make their care delivery more effective. Consumer electronics companies study how teenagers use newly introduced products to gain ideas for the next generation of products. A considerable body of literature (well beyond the scope of this book to summarize) describes the benefits and limitations of soliciting customer input for product innovation ideas. For example, Anthony Ulwick and Dorothy Leonard explain why companies should ask customers for the outcomes they want, not for particular features of new products.2 Clayton Christensen describes the dangers of soliciting ideas solely from existing customers and missing the initially simpler needs of low-end consumers in rapidly growing customer segments.3 W. Chan Kim and Renée Mauborgne’s value innovation work describes how companies can customize the functionality of their products and services to meet the preferences of mass-market customers at substantially lower prices than competitors.4
Some typical objectives and measures for the idea and opportunity innovation process include:
| Identify Opportunities Objectives | Measures |
| Anticipate future customer | |
| Discover and develop new, more effective, or safer products and services |
|
2. Manage the Research and Development Portfolio
Once ideas for new products and services have been generated, managers must decide which projects to fund, which to defer, and which to kill. Managers must determine whether a project should be done entirely with internal resources, done collaboratively in a joint venture, licensed from another organization, or outsourced. Even after a new project is funded, managers must continue to review, in light of new opportunities and resource constraints, whether to continue supporting the project at the current level of resources (money, capital equipment, and people), reduce resource commitments, or stop the project in light of limited progress made to date or more attractive opportunities that may have recently been identified. The output from the evaluation process is an aggregate project plan that defines the portfolio of projects the organization is investing in, the specific objectives to be achieved by the collection of projects, the resources required, and the mix between internal and external sources.
The research and development portfolio should include a mix of different types of projects drawn from the following categories:5
- Basic research and advanced development projects create new science and technology knowledge that can subsequently be applied in commercial projects. Often such basic research is done in a separate organization.
- Breakthrough development projects create entirely new products, based on applying science and technology in a new way. Typically, such projects establish a new product category or a new line of business for the company. The development of a lightweight, portable laptop computer in the late 1980s was a breakthrough product in the personal computer industry. Breakthrough product development projects typically extend over several years.
- Platform development projects develop the next generation of products in a given category. The new platform defines the basic architecture for an extended set of products likely to be developed and launched for the next several years. Such projects may incorporate many technological features of the previous generation, but they also must introduce recent technological advances that offer significantly enhanced features and functionality. Platform projects generally require considerable resources since they deliver fundamental improvements in cost, quality, and performance over the previous generation of products.
- Derivative development projects enhance particular features of the platform product to deliver a product targeted at a specific market segment. The modifications can lower the cost or enhance the functionality of an existing product. For example, a desktop computer product can offer one model with a faster processor for high-end users who require complex graphics or play interactive video games, as well as one with a slower processor for people who use their computer just for e-mail, simple spreadsheets, and word processing. Derivative development projects require far fewer resources than platform or breakthrough development projects since they leverage existing product and process capabilities.
- Alliance projects enable a company to acquire a new product (or process) from another firm, either through licensing or through subcontracting. Companies turn to alliance projects when sufficient internal resources are not available for a desired project, when in-house development efforts fail to deliver desired results, or when smaller firms have already developed the basic capability for a new product or process, and purchasing this capability is less expensive than duplicating the development effort internally.
Consider the project portfolio for an automobile company. A basic research project could be the development of a fuel cell that would replace the gasoline-powered engine. A breakthrough development project would produce a hybrid car, capable of running on either batteries or gasoline. A platform product would be a new line of hybrid cars that the company would market over the next five to seven years. And derivative projects would develop the different models of the hybrid car—sedan, coupe, convertible—and options that would be offered to consumers. The derivative projects would also include annual enhancements to the basic hybrid platform. An alliance project occurs when the company has insufficient resources to design and develop all the car models it wants to market, so it turns to an independent company, such as Porsche, for design and product development of a particular car model or component.
The five types of projects have quite different resource requirements, project times, and risk profiles. The aggregate project plan determines the mix among the five project types and ensures that adequate resources are available for the selected project mix. The aggregate project plan links the various development projects to the business strategy, relates each project to specific product lines and markets served, allocates people, capacity, and financial resources to each project so that each has adequate resources to accomplish its objectives, and establishes a schedule for the sequencing of the projects within available resources.
Typical objectives and measures for managing the R&D portfolio process include the following:
| Manage the R&D Portfolio Objectives | Measures |
| Actively manage the product/offer portfolio for superior innovation and customer positioning, performance, and profitability |
|
| Extend current product platforms into new and existing markets | |
| Extend product portfolio through collaboration |
|
3. Design and Develop New Products and Services
The design and development process, the core of product development, brings new concepts to market.6 A successful design and development process culminates in a product that has the desired functionality, is attractive to the targeted market, and can be produced with consistent quality and at a cost enabling satisfactory profit margins to be earned. In addition to these demanding specifications for the output it delivers, the development process has to meet its own targets for completion time and development cost.
The product development process is a complex set of activities that cut across multiple functions of a business. The process typically consists of a series of stages:
- Concept development: The project team studies market research, competitive products, technology, and production capabilities to define the basic architecture for the new product. This stage starts with a conceptual design, including product functionality and attributes, and estimates of the target market, price, and production cost.
- Product planning: The project team tests the product concept by model building, small scale testing, and initial investment and financial planning.
- Detailed product and process engineering: The project team designs and produces working prototypes of the product. Simultaneously, the team undertakes the design of tools and equipment that will be used in large-scale production. Several design-build-test cycles can occur, in which the product design and the production process are modified to achieve the desired performance characteristics of functionality, cost, and quality.
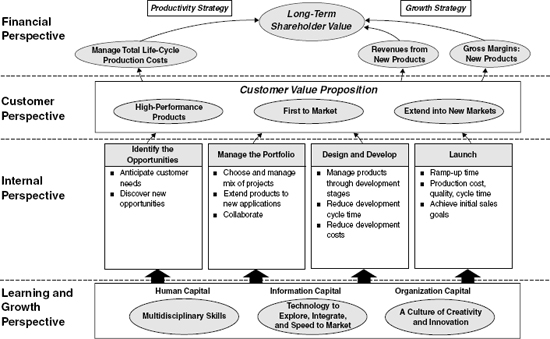
Some authors have described the product development process as a funnel (see Figure 5-3) in which the wide opening at the beginning indicates the maximum flexibility for concepts, product design, and manufacturing processes. As the project evolves, the concepts, designs, and processes become better defined as options get discarded.
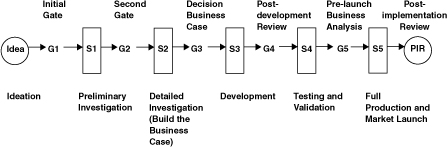
Many companies introduce a formal stage-gate process that specifically identifies a series of development stages through which a new product must pass as it moves from an initial concept to a fully defined product ready for release to large-scale production (see Figure 5-4).
The product development funnel and the stage-gate model give a structure for allocating resources among projects based on project experience to date and evolutions in technologies, customer preferences, competitors, and regulations. Each gate represents a go/no go decision, at which engineers and managers compare the project to others in the company’s new product funnel that compete for the company’s scarce development resources. A project can be deferred based on its performance to date, or because of new information about customers, technology, and competitor activity. The stage-gate model provides discipline to the often chaotic product development processes. It forces managers to periodically review every project in their pipeline and gives them the option to pull the plug on those projects that no longer seem promising, based on new information. Thinning the population of product development projects enables the company’s development resources to be focused on the most promising opportunities.
Figure 5-3 The Product Development Funnel
Figure 5-4 The Stage-Gate Model of New Product Development
Pharmaceutical and biotechnology companies, of course, have different product development activities. Initially, scientists perform preclinical research involving laboratory and animal testing of new compounds. Promising drugs then require three phases of human clinical trials. Phase I trials are done on normal, healthy people (volunteers) to determine the safety, tolerability, and effective dosages of the drug. Phase II trials are performed on ill people to determine the clinical effects of the drug and to explore alternative dosage levels. Phase III trials are by far the most expensive, involving extensive testing of the drug against a control group receiving either a placebo or the best existing treatment to determine the benefits from the new drug, as well as knowledge of side effects. The cost of testing can be from $1 to $5 million in Phase I, from $10 to $20 million in Phase II, and from $20 to $70 million for each Phase III trial, which can last up to three years. At the end of Phase III, the drug is submitted for regulatory approval to be marketed and sold to the public. Even after the drug has been cleared for public use, companies often continue with Phase IV trials to look for rare adverse reactions and opportunities to decrease the dosage, and to extend the range of situations for which the drug can be prescribed. Thus, for pharmaceutical and biotechnology companies, managing the pipeline of drugs and the cost and time of each phase of development is perhaps their most important set of processes.
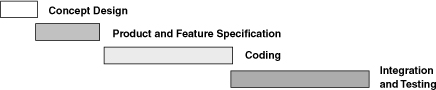
Software development companies follow routines similar to those used for developing traditional hardware products. For years, software companies followed a structured waterfall process (see Figure 5-5) in which one phase spilled into the next in a well-defined, sequential progression: concept design, product and feature specification, coding, and integration and testing. This process is used when customer requirements and requisite technology are well understood.
Figure 5-5 The Waterfall Model of Development
Recently, however, software companies have been doing their software development much more iteratively, enabling designers to incorporate changing customer requirements and evolving technologies into designs throughout the product development process. Following this evolutionary delivery model, companies post new beta versions of the software on the Internet for select, sophisticated users every few weeks, so that they can react quickly to feedback from users on capabilities and bugs and respond to new competitor products that may have just appeared on the market. The development process involves many “design-build-test” cycles, with each cycle incorporating and integrating more functionality into the high-level product.7
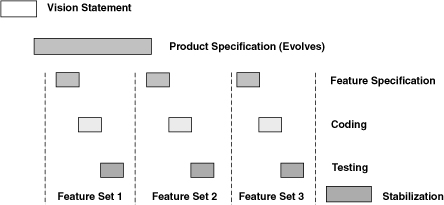
In developing the complex release of Office 2000, Microsoft used a flexible development process that exploited two key processes: Milestones and Daily Builds. For each software application, the project team broke the development work into several stages, each one encompassing the design, coding, and testing of a subset of the product’s functionality (see Figure 5-6). The milestone process enabled engineers to test the functionality of the new product throughout the project rather than defer testing, as in the waterfall approach, until all the functionality had been coded into the final product. The project team established three development milestones several months apart, and allocated particular features to each milestone. If some features or functionality proved difficult to implement for the planned milestone, the feature was either deferred to a later milestone or eliminated entirely. In the milestone process, engineers must adhere to a targeted and inflexible final shipping date. They are allowed to reduce the planned functionality to adhere to the schedule. In contrast, the usual product development process allows the shipping date to be deferred until all the features have been incorporated, tested, and validated in the final product.
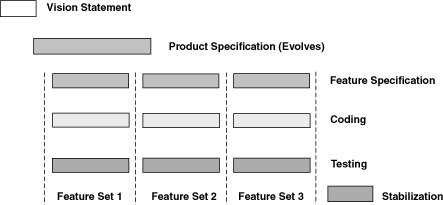
In the daily build process (see Figure 5-7), programmers check out a portion of the code to work on each day and submit their work at the end of the day. Special teams test the revised product overnight to ensure that the additions worked well with the existing design, and to identify the bugs in the code for the programmers to work on in subsequent days. Revisions to the program are not accepted until a sufficiently low level of “bugginess” has been achieved, and the new code does not create problems elsewhere in the complete product. This process enables, in principle, a usable version of the final product to be available each day for testing and feedback by sophisticated users as the project evolved.8
Figure 5-6 The Milestone Process
With the considerable diversity in project management processes in different industries, companies need to develop their own customized objectives and measures. Some ideas to stimulate thinking can be drawn from the following table:
Figure 5-7 The Milestone Process with Daily Build
| Design and Development Objectives | Measures |
| Manage the project portfolio |
|
| Reduce development cycle time |
|
| Manage development cycle cost |
|
4. Bring New Products to Market
At the conclusion of the product development cycle, the project team releases the product for initial ramp-up into commercial production. In this fourth process, the project team starts pilot production to finalize the specifications for the production process. The team builds all the components on the prototype production equipment and then assembles and tests the finished product. This process tests whether the new or modified manufacturing processes can produce the finished product at commercial volume levels that meet functional and quality standards. It also validates that all suppliers can deliver their materials and components within specifications, on-time, and at targeted costs.
In a final phase, the company starts commercial production at low volume levels to ensure that its production processes and those of suppliers can consistently produce and deliver the product. The marketing and sales organization also begins to sell the new product to customers. As customer orders increase and the supply and production processes stabilize, the production process ramps up further. Ultimately, the development project concludes when the company achieves targeted levels of sales and production, at specified levels of product functionality, quality, and cost.
| Product Launch Objectives | Measures |
| Rapid launch of new products |
|
| Effective production of new products |
|
| Effective marketing, distribution, and sales of new products |
|
INNOVATION LINKAGES TO OBJECTIVES IN THE CUSTOMER PERSPECTIVE
Excellent innovation processes offer customers a value proposition consisting of two important components (see Figure 5-2). The first component represents the specific performance attributes of the company’s products and services that describe how the performance of the new product or service dominates the performance of competitive offerings. By describing and communicating the most important functionality aspects of newly introduced products and services, all employees learn about the specific performance dimensions that the company must continually strive to enhance.
For example, in semiconductors, continual reductions in the size of the basic memory or processing chip generate advantages in the speed and functionality of the device. For displays, clarity, brightness, and power consumption are critical attributes. For pharmaceuticals, safety and relative product effectiveness for specific diseases and therapeutic categories generate competitive advantage. For medical devices and portable consumer electronics, customers desire reduced size and weight. For instruments, accuracy is an important performance attribute. Companies should identify the specific functionality that its innovation process produces for its customers. This functionality then becomes the basis for measuring the value proposition in the customer perspective of the strategy map.
The second component of the value proposition is the time at which the enhanced functionality becomes available to customers. Offering excellent functionality but getting to the market several months or years after competitors will not be the basis for high margins. Companies that excel at innovation and product leadership bring their superior products and services to the market faster than competitors. Being six months late in many product innovations may be far more costly to a company than incurring a cost overrun of 20 percent or more on the innovation process itself. Therefore an objective for being first-to-market with new products and services is an important source of revenue and margin growth for product leaders.
A third customer objective from the innovation process is to extend existing or new products into new markets. Pharmaceutical firms frequently discover that a new drug therapy is effective for diseases beyond the one initially targeted. Since the drug has already passed governmental approval for safety and toxicity, the approval process for applying the drug to new diseases is less onerous. Similarly, agricultural chemical companies can find that their treatments are effective on additional crops, pests, or diseases beyond the specific ones initially targeted and approved.
The core competency literature emphasizes how product excellence along a given functionality dimension can often be leveraged into many other applications and market segments.10 For example, Honda’s excellence in engine performance, originally developed for motorcycles and automobiles, has enabled it to enter such diverse segments as lawn-mowers and backup engines for utilities. Canon’s product leadership in optics for cameras has been leveraged into superb products for printers, copiers, and medical electronics. And eBay expanded its consumer auction capability into a powerful tool for selling used and reconditioned commercial equipment. The innovation process we described earlier in this chapter is very expensive. Companies should strive to get the maximum return from such investments by applying their leading products, services, and processes to applications well beyond the one initially targeted.
Customer objectives and measures for the output from an effective innovation process therefore encompass functionality, timeliness, and market innovation as shown in the table below:
| Customer Objective | Measures |
| Offer enhanced product/service functionality to customers |
|
| First-to-market with new product/service |
|
| Extend products/services to new segments |
|
Financial
The financial objectives from innovation relate, of course, to revenue growth and enhanced margins from new products and services (see Figure 5-2). Products and services that offer distinct advantages over those of competitors and that are first-to-market should either command a price premium or generate sales growth that is faster than industry (and frequently both—higher prices and higher sales growth). The revenue and margin growth can occur with existing customers and markets as well as for entirely new customers and markets. Thus revenue and margin objectives can be developed for both existing and new customers. Also, the company should have an objective to get a return on the research and development spending it has done to develop new products and services.
Innovation is not often associated with productivity and cost reductions. Perhaps the main benefit from thinking about the relationship between innovation and cost management arises from the opportunity to manage costs over the entire life cycle of products. Companies may wish to have an objective to lower the cost of maintenance, repair, and disposal of their products. Product environmental issues are especially important in European countries where regulations require companies to internalize the cost of “put-back” for their products.
| Financial Objective | Measures |
| Return on R&D investments |
|
| Revenue growth from existing customers |
|
| Revenue growth from new customers |
|
| Manage life-cycle costs |
|
Learning and Growth
Competencies, technologies, and organizational climate (see learning and growth perspective in Figure 5-2) are vital for fostering effective innovative processes.
Human Capital
Clearly, innovation would be impossible without deep expertise in the underlying science and technology for new products and processes. Innovative companies need scientists and engineers with the appropriate education and experience in the organization’s fundamental technologies. The competency requirement can shift over time as new science is developed and new customer segments appear. In the pharmaceutical industry, for example, the scientific requirements in the search for new drugs have shifted from chemistry to molecular biology and computational genetics. In software, computer engineering skills that developed superb but highly proprietary architectures may be worth little as customer preferences shift to open architecture software. So companies must be continually alert to the mix of skills required to develop the next generation of products and services.
But deep competency in a given science or engineering field is unlikely to be successful by itself. Most important advances today require the integration of science and technology from several disciplines. Another key competency, therefore, is an employee’s ability to work with scientists and engineers from other disciplines and backgrounds and to fuse the diverse knowledge bases into product performance breakthroughs.
Beyond the integration of technical expertise, all people in product development projects need to be able to interact effectively with employees from functions outside research and development, such as marketing, operations, and finance. Such integration enables development projects to meet their goals for functionality, launch time, quality, and manufacturing cost. Thus the competency theme that supports innovation processes encompasses having scientists and engineers with strong skills in all the underlying disciplines, and an ability to work effectively on multidisciplinary projects with multifunctional teams.
Information Capital
Information technology is increasingly a vital component for any important product development process. Project teams now use advanced three-dimensional simulation in lieu of physical mockups to experiment with and test alternative designs. Virtual prototyping is faster and less expensive, and allows more design cycles and learning than traditional prototyping with physical models. In pharmaceutical research, computational skills and capabilities have become as central to the research effort as biology and chemistry.12
Information technology also enhances the communication of knowledge and project experiences across functions, departments, and geographic units and fosters the sharing of best practices.
Beyond the use of technology for the innovation process itself, innovative companies can exploit information technology to achieve rapid introduction of new products to commercial production. Flexible manufacturing equipment enables new products to be introduced into production quickly and produced at commercial levels without having to acquire entirely new machines. The handoff from design to manufacturing is expedited considerably when project engineers’ computer-aided-design (CAD) terminals interface with production’s computer-aided-manufacturing (CAM) equipment.
Organization Capital
Teamwork. As we stated earlier, teamwork is critical for successful innovation projects. But beyond teaming with internal employees from other disciplines and functions, the people working on the innovation processes must also be actively involved with the external scientific and technological community. Not all inventions arise within the company’s research laboratories. Company scientists and engineers should continually be engaged with scientific conferences, leading universities, and the scientific literature so that they stay alert for advances that can affect the company’s products and services.
Culture. The organizational culture must emphasize innovation, disruption, and change as core values. The culture should also foster the acquisition of knowledge from outside the company and overcome the natural tendency, called the not-invented-here (NIH) syndrome, to derogate advances made by scientists and engineers outside the company, even if they work for competitive companies.
A summary of learning and growth objectives and measures appears below:
| Learning and Growth Objectives | Sample Measures |
| Achieve deep functional expertise |
|
| Develop effective interdisciplinary and cross-functional teams |
|
| Deploy computer technology for simulation and virtual prototyping |
|
| Use technology for rapid product launch |
|
| Capture leading knowledge from scientific and technological community |
|
| Foster a culture of innovation |
|
SUMMARY
Innovation processes can be the most important processes an organization performs to sustain competitive advantage. In this chapter we identify high-level objectives and associated measures for four innovation processes:
- Identify opportunities for new products and services
- Manage the research and development portfolio
- Design and develop the new products and services
- Bring the new products and services to market
Despite their importance, innovation processes often receive far less management attention than the more visible, repetitive, and predictable operating and customer management processes. All organizations, regardless of strategy, should strive to have at least one innovation objective on their strategy maps. And for companies following product leadership and system lock-in strategies, performance on innovation processes can be the most decisive for their success.
In the case study following this chapter, we describe the strategy map for Saatchi & Saatchi, a leading global advertising firm. Saatchi & Saatchi had adopted a new strategy based on its new vision for innovation, “to be revered as the hothouse for world-changing creative ideas that transform our clients’ businesses, brands, and reputations.” It wanted to excel at creating new advertising messages and vehicles that would provide breakthrough transformations in its clients’ images.
NOTES
1. Steven C. Wheelwright and Kim B. Clark, Revolutionizing Product Development: Quantum Leaps in Speed, Efficiency, and Quality (New York: Free Press, 1992), 1.
2. A. W. Ulwick, “Turn Customer Input into Innovation,” Harvard Business Review (January 2002): 91–97; D. Leonard, “The Limitations of Listening,” Harvard Business Review (January 2002): 93.
3. Clayton Christensen, The Innovator’s Dilemma: When New Technologies Cause Great Firms to Fail (Boston: Harvard Business School Press, 1997).
4. W. C. Kim and R. Mauborgne, “Value Innovation: The Strategic Logic of High Growth,” Harvard Business Review (January–February 1997): 91–101; and “Creating New Market Space,” Harvard Business Review (January–February 1999): 83–93.
5. Material in this section draws from S. C. Wheelwright, “The New Product Development Imperative,” note 9-699-152, Harvard Business School, Boston, 1999.
6. Material in this section was drawn from Wheelwright and Clark, Revolutionizing Product Development, and M. Iansiti and T. Kosnik, “Product Development: A Customer-Driven Approach,” note 9-695-016, Harvard Business School, Boston, 1995.
7. M. Iansiti and A. MacCormack, “Developing Products on Internet Time,” Harvard Business Review (September–October 1997): 108–117; Tom Gilb, Principles of Software Engineering Management (Reading, MA: Addison-Wesley, 1988); A. MacCormack, “How Internet Companies Build Software,” Sloan Management Review (Winter 2001): 75–84.
8. A. MacCormack, “Microsoft Office 2000,” Case 9-600-097 (Boston: Harvard Business School, 2000).
9. The number of patents and patent citations has been identified in Baruch Lev, Intangibles: Management, Measurement, and Reporting (Washington, DC: Brookings Institution Press, 2001): 57–61, as a key indicator of research output.
10. C. K. Prahalad and Gary Hamel, “The Core Competence of the Corporation,” Harvard Business Review (May–June 1990); and Competing for the Future (Boston: Harvard Business School Press, 1994).
11. BET is the elapsed time from the start of project until the company recovers its product development costs from the margins earned from commercial sales. See C. H. House and R. L. Price, “The Return Map: Tracking Product Teams,” Harvard Business Review (January–February 1991): 92–100, and Robert S. Kaplan and David P. Norton, The Balanced Scorecard: Translating Strategy into Action (Boston: Harvard Business School Press, 1996), 102–103.
12. S. Thomke, Experimentation Matters (Boston: Harvard Business School Press, 2003).
CASE STUDY
SAATCHI & SAATCHI
Background
Saatchi & Saatchi, a wholly owned subsidiary of the French communications group Publicis Group S.A., is one of the world’s leading advertising agency networks. It has annual billings of $7 billion from its 40 agencies and 138 offices in 82 countries, and serves 60 of the world’s 100 top advertisers. Founded in 1970, Saatchi & Saatchi grew from a London boutique to a global giant through an ambitious series of acquisitions. With no unifying strategy, individual agencies operated as fiefdoms, unaware of the corporate bottom line. By the mid-1990s, Saatchi & Saatchi’s explosive growth proved near fatal; only a de-merger in 1997 and a new leadership team saved it from probable bankruptcy. Amid mounting shareholder pressure, the company proclaimed its goal of growing its revenue base competitively, with bottom-line margins (on that incremental growth) of 30 percent, and doubling earnings per share. New CEO Kevin Roberts crafted a sweeping strategic plan, called “The Way Ahead.” CFO Bill Cochrane introduced the BSC to help the firm achieve these ambitious targets. Both executives found the BSC unmatched for managing intan-gible assets—Saatchi & Saatchi’s source of value creation. They saw that client retention, not necessarily new sales, was the best indicator of financial health (20 percent of the client base supported 80 percent of Saatchi & Saatchi’s revenue). Hence the new strategy: creating permanently infatuated clients (PICs). As a global advertising network, the greatest source of return would be to serve its global client base superlatively in every market.
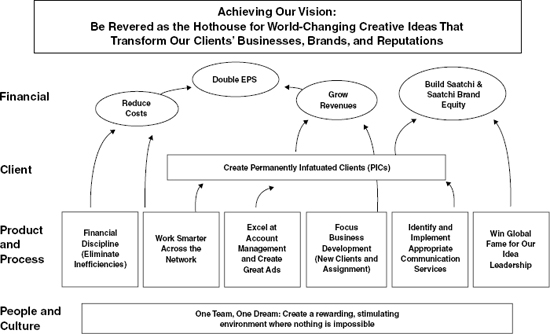
The Strategy Map
As shown in Figure 5-8, the executive team defined three strategic themes:
- Operational excellence, including objectives for financial discipline and working smarter across the network of worldwide agencies
- Customer management, to excel at account management and focus business development
- Innovation, including objectives to identify and implement appropriate communication services and win global fame for our idea leadership
Saatchi & Saatchi chose, for simplicity’s sake, not to overlay these themes on its strategy map, notes Paul Melter, director of strategy implementation. However, the firm’s new vision—“To be revered as the hothouse for world-changing creative ideas that transform our clients’ businesses, brands, and reputations”—is emblazoned across the top of the map.
Saatchi & Saatchi also reorganized from a geographic structure to one based on local mission. Each local agency was placed into one of three categories:
- Lead agency: One with the greatest potential for creating transformational ideas
- Drive agency: One that had excellent opportunities for profitable growth in its local market
- Prosper agency: A smaller agency with limited growth opportunities that would focus on optimizing near-term profits
Each agency type developed its own variation of the corporate strategy map.
Financial Perspective
Since December 1997, when Saatchi & Saatchi de-merged from Cordiant Communication, shareholder value has been the firm’s top priority. Saatchi & Saatchi’s financial targets remain aggressive. However, the executive team wanted to position financial performance as the result of pursuing excellence in the key themes and the client strategy, rather than as the explicit goal. Although the financial perspective appears at the top of the strategy map, Saatchi also uses an equation to emphasize the impact of the nonfinancial perspectives and their value as leading indicators:
A (People and Culture) + B (Internal Processes) + C (Client) = D (Financial)
Figure 5-8 Saatchi & Saatchi Strategy Map
Client Perspective
Creating PICs is Saatchi & Saatchi’s singular objective in the client perspective and the enterprise’s overarching goal. This proposition crystallized the need to maximize the value of relationships with global clients. Creating PICs directly supports the objectives to grow revenues and build brand equity.
Product and Process (Internal Business Process)
To help achieve “financial discipline and eliminate inefficiencies,” Cochrane created an annual health check each agency must undergo, in addition to the scorecard measures that help enforce fiscal accountability.
The major objective, “working smarter across the network,” has broad impact on both operational excellence and client management. For example, today it is understood that putting your best copywriter on a network account helps make that client permanently infatuated (even if that account represents only 10 percent of your revenues). Working smarter also helps agencies to allocate resources better and, as explained by Paul Melter, to access Saatchi & Saatchi’s vast organizational expertise—“getting support from the industry-savvy regional account directors, intelligence from a lead agency with major market experience for a client, or if necessary, going to another Publicis company for best-in-class thinking.”
Additional internal process themes were:
- Excel at account management and create great ads: Within this theme lies one of Saatchi & Saatchi’s core goals: creating “BFIs”—Big, Fabulous Ideas. More than just an ingenious ad concept, a BFI is a transformational idea; for example, a new product category (such as nonaspirin pain relievers, which Saatchi & Saatchi created for Tylenol), or a new product position (such as pitching Pepcid AC as a preventative, not just a relief, medicine).
Another process objective within this theme was to revise the “ideas brief” process by which an agency advances a concept from proposal to end product. To conserve resources and prevent burnout, agencies now start with only the four key team leaders (account, planning, media, and creative) to meet and figure out the client challenge. Within twenty-four to forty-eight hours they craft a “challenge brief” defining the client’s need. Only when the client approves the brief does the agency commit significant resources. This streamlined approach sharpened focus within Saatchi as well as within its client companies.
- Focus business development: Agency heads now must identify new business and new client opportunities—and demonstrate the greater payoff from investing to go after their business. This objective has forced a more strategic approach to business planning.
- “Identify and implement appropriate communication services”: This objective speaks to the innovation theme. “The best way to market isn’t always traditional media like TV or print,” notes Melter. “It might be event promotion or a direct-response insert in the phone bill.”
People and Culture
The single inspirationally worded objective in this perspective—“One Team, One Dream”—reflects CEO Roberts’s inspirational leadership. No arrows extend from this perspective, because the company considered this objective foundational to all other perspectives.
The value chain described by the strategy map has helped Saatchi executives achieve focus and make informed business decisions in accordance with their strategic mandates. This benefit is perhaps best exemplified by the new approach to what Melter considers the biggest “sticky” (Saatchi & Saatchi parlance for “issue”): How do we deliver first-rate creative content to the client, using existing resources?
By assigning pluses or minuses to each perspective, an agency head can see the long-term value of investing in, say, another copywriter, instead of making do with a junior one or spending freelance dollars. The salary cost is more than offset by the utilization gain (“working smarter”) and faster speed to market (making the client happy)—both of which can generate more assignments from that client, thereby boosting revenue.
Results
Between the introduction of the new strategy and Balanced Scorecard (which Saatchi & Saatchi has renamed “Compass”) in 1977 and Saatchi’s acquisition by Publicis in September 2000, shareholder value quintupled, an increase of $2 billion. This dramatic performance earned Saatchi & Saatchi membership in the Balanced Scorecard Hall of Fame.
_______________
Case prepared by Patricia Bush and Jan Koch of Balanced Scorecard Collaborative and Paul Melter of Saatchi & Saatchi. Our thanks to Bill Cochrane for sharing the Saatchi & Saatchi experience.