C H A P T E R S I X
REGULATORY AND SOCIAL PROCESSES
COMPANIES MUST CONTINUALLY earn the right to operate in the communities and countries in which they produce and sell (see Figure 6-1). National and local regulations—on the environment, on employee health and safety, and on hiring and employment practices—impose standards on companies’ operations. At a minimum, to avoid shutdowns or expensive litigation, companies must comply with all these regulations on business practices.
Many companies, however, seek to go beyond complying with the minimal standards established by regulations. They wish to perform better than the regulatory constraints, so that they develop a reputation as an employer of choice in every community in which they operate. Marc Epstein and Bill Birchard have stressed the importance of integrating social and environmental accounting into a company’s accountability reports to stakeholders.1
For example, see the following statement by Nova Chemicals:
At each of our plant sites, we have Responsible Care-based community initiatives that are designed to influence NOVA Chemicals’ philosophy of being a neighbor of choice. That commitment means demonstrating outstanding performance concerning safety, health and environmental standards in the communities where we operate.
Our commitment to community is further enhanced with corporate sponsorships and donations. We are very proud of our commitment to sustainable development programs everywhere we are located.
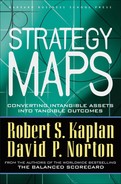
Figure 6-1 Regulatory and Social Processes
Highlighting regulatory and community performance in a strategy map and Balanced Scorecard is not a repackaging of the traditional stakeholder approach.2 We recognize companies’ responsibilities to employees, citizens, and their communities because failure to perform adequately on regulatory and social processes puts at risk the company’s ability to operate, grow, and deliver future value to shareholders. Even more important, many companies believe that achieving excellence in such processes enhances long-term shareholder value.
An excellent reputation for performance along regulatory and social dimensions assists companies in attracting and retaining high-quality employees, thereby making their human resources processes more effective and efficient. For example, after benchmarking its HR practices against companies such as Apple Computer and Microsoft, BellSouth added benefits for domestic partners. This was not done specifically to attract gay candidates, but because the company had determined that the young people it wished to recruit wanted to work for a company that they deemed “progressive.” It also added a diversity measure on HR department’s scorecards to ensure that the company attracted and retained a good mix of employees from the communities in which it operated and served.3
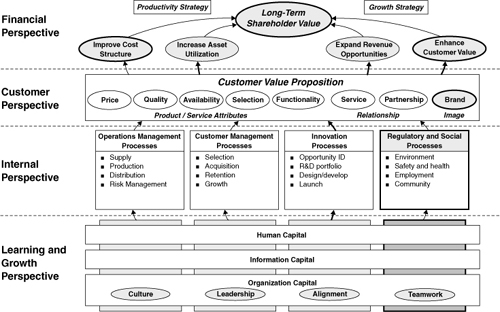
Reducing environmental incidents and improving employee safety and health also improve productivity and lower operating costs. And finally, companies with outstanding reputations generally enhance their images with customers and with socially conscious investors. All these linkages—to enhanced human resource, operating, customer, and financial processes—illustrate how effective management of regulatory and community performance drives long-term shareholder value creation (see Figure 6-2).
Novartis, the Swiss-based pharmaceutical company, provides an annual Health, Safety, and Environment Report. Chairman and CEO Dr. Daniel Vasella states:
Because our business activities and our societal and environmental performance are integrally connected, we are publishing our Health, Safety and Environmental Report this year at the same time as our Operational Review. We are also responding to the increasing range of corporate responsibility in today’s global economy by expanding our report to cover, in addition to the traditional HSE subjects, issues relating to sustainable development and its three principles of economic, social and environmental progress.
Figure 6-2 Regulatory and Social Strategy Map Template
An important way for us to ensure top HSE performance is through our annual Sector Reviews by top management. The objective of the Sector Reviews is continuous improvement: we collect important data and information (e.g., data on emissions, waste, accident statistics, etc.) and use it to identify areas for improvement and to establish new priorities and targets.4
Coca-Cola asserts:
Stewardship takes us beyond compliance with laws and regulations to form alliances with those who seek solutions to environmental challenges…. [W]e explore and invest in stewardship initiatives ranging beyond the scope of our immediate business…. The Coca-Cola eKO system demands that we continually examine every aspect of our business for opportunities to reduce our consumption of resources and production of waste, while increasing the amount of recycled material in our packaging and other supplies.5
DuPont issues an extensive, well-documented annual Global Progress Report. The company asserts its commitment to “conduct our business with respect and care for the environment”:
We will adhere to the highest standards for the safe operation of facilities and the protection of the environment, our employees, our customers and the people of the communities in which we do business.
We will strengthen our businesses by making safety, health and environmental issues an integral part of all business activities and by continuously striving to align our businesses with public expectations.6
These are just a few examples of how leading companies around the world pursue excellence in regulatory and social processes as an integral component of their long-term value creating strategies.
MANAGING REGULATORY AND SOCIAL PROCESSES
Companies manage and report their regulatory and social performance along several dimensions:
Below, we provide examples of the measurements and disclosures companies currently use for each of these dimensions. We then discuss the links between strategy and regulatory and social performance.
1. Environmental Performance
Because of extensive regulation in developed nations, environmental performance is the most developed of the regulatory and social measurement systems for company reporting. In general, companies have several components to their environmental performance report:
A. Energy and resource consumption
B. Water emissions
C. Air emissions
D. Solid waste production and disposal
E. Product performance
F. Aggregate environmental measures
A. Energy and Resource Consumption
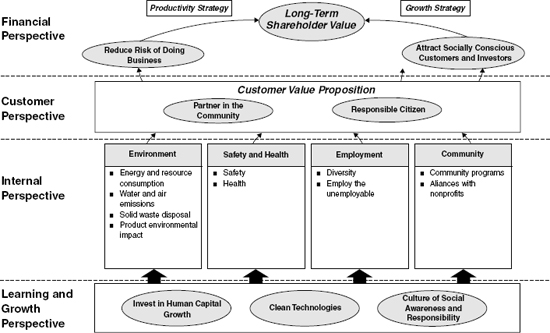
Energy consumption can be measured for all energy sources (total joules of energy consumed) or by type of energy, such as electricity and fuel. Companies typically report total energy consumption, compared to previous years, and also normalized for units of output (kilowatts or joules per pound [or barrel] produced). When a homogeneous measure of output is not available, because of the diversity of products and services produced, companies normalize by sales revenue or cost of goods sold (for example, joules per $1,000 cost of sales). See Figure 6-3 for an example of Bristol-Myers Squibb’s disclosure of energy consumption.
In addition to measuring energy consumption, companies measure total and normalized consumption of other resources, principally water and materials. For example, Nokia gets considerable reduction in materials usage per unit by continually shrinking and lightening its core product, a cellular telephone.
Figure 6-3 Bristol-Myers Squibb Energy Consumption, 1999–2001
Source: Briston-Myers Squibb 2001 Sustainability Report.
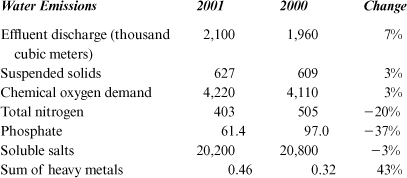
B. Water Emissions
Clean water is a scarce resource. Companies are sensitive to their usage of clean water and their discharges back to water supplies. They measure the demands they make on clean water supplies and their total wastewater released (effluent discharges). See, for example, the disclosure by Novartis in its 2001/2002 Corporate Citizenship report, shown in Figure 6-4.
Figure 6-4 Novartis 2001/2002 Corporate Citizenship Report
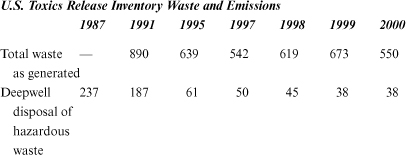
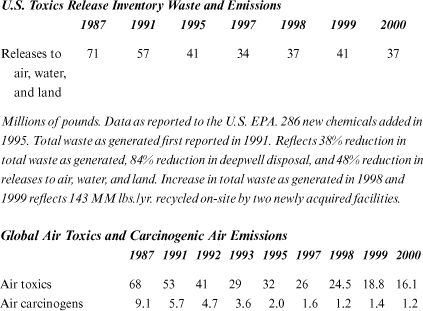
C. Air Emissions
Air pollution is a problem around the world. Companies report on their releases of toxic gases and air carcinogens. For example, DuPont provides data on air discharges in its Annual Global Report, shown in Figure 6-5.
With the concern about greenhouse gases as a potential cause of global warming, many companies report their releases of carbon dioxide (CO2) gases. Similarly, the concern over acid rain motivates corporate reporting on nitrous oxide (NO) and sulphur dioxide (SO2) gases. Chemical and other manufacturing companies commonly report on ozone depleting substances, such as chlorofluorocarbons (CFCs) and hydrochlorofluorocarbons (HCFCs). Air emissions are typically measured in kilograms of gas released, and normalized by output (kilograms/dollars of sales or kilograms/dollars of cost of goods sold).
Figure 6-5 Dupont Annual Report (Air Discharge Data)
D. Solid Waste Production and Disposal
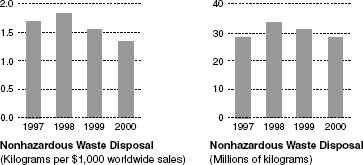
Companies report on the production and disposal of both hazardous and nonhazardous waste. Bristol-Myers Squibb, for example, provides extensive data and descriptions of its solid waste reported (see Figure 6-6).
IBM reported that in 2000, despite increases in production, hazardous waste generation decreased by 15,703 metric tons (41.6 percent). Of hazardous waste generated, 61 percent was recycled. IBM also reduced the percentage of product-related scrap sent to landfill by 12.5 percent. Only 3.2 percent of material processed was sent to landfills in 2000.
E. Product Performance
Companies are increasingly sensitive to what happens to their products even after they have been sold to end-use consumers. Product leadership companies, such as Hewlett-Packard and Sony, continually introduce new products and therefore are concerned with the disposal and recycling of previous generations of products. Hewlett-Packard explicitly develops product end-of-life solutions, such as recycling technologies and infrastructures, to create reliable streams of recycled materials. Its engineers employ a design-for-environment perspective to optimize the environmentally related characteristics of a product, process, and facility. These guidelines urge its product designers to consider the following issues when designing a new product:
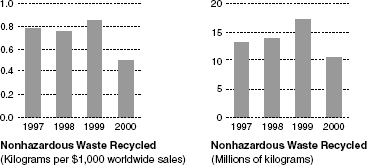
Figure 6-6 Bristol-Myers Squibb Materials Report
Nonproduct Output Returned to Process or Market
Each of our facilities worldwide is required to track its recycling of nonhazardous waste. We track data on plastic, cardboard, paper, and aluminum. As the chart indicates, nonhazardous waste recycling decreased 37 percent since 1997, with a significant drop in 2000 due primarily to increasing costs of recycling versus disposal. Bristol-Myers Squibb continues to promote recycling as a preferred alternative to disposal, although our ultimate goal is to reduce nonhazardous waste generation through source reduction. One of our Sustainability 2010 goals is to decrease non-hazardous waste generation, which should help drive change and increase our nonhazardous waste recycling.
Nonproduct Output to Land
Nonhazardous waste disposal includes plastic, cardboard, paper, aluminum, off-specification or out-of-date product, chemicals not regulated as hazardous waste, general trash, and medical waste. Nonhazardous waste disposal has decreased 20 percent since 1997, in large measure due to source reduction.
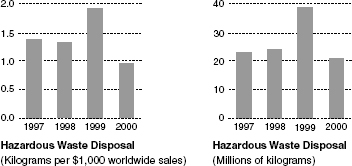
Hazardous Waste
We track hazardous waste sent off-site from our facilities worldwide. The chart shows the amount of hazardous waste (as defined by local requirements) sent off-site for disposal. The data do not include hazardous waste generated as a result of on-site remediation activities. The vast majority of hazardous waste is incinerated, with only the residual ash land disposed. As the chart indicates, hazardous waste disposal decreased 30 percent since 1997. The decrease from 1999 to 2000 was due, in part, to eliminating a process at one facility that had generated significant amounts of hazardous waste as well as increased treatment of waste on-site.
- Identify design changes that reduce environmental impact throughout a product’s life cycle
- Eliminate hazardous or toxic plastics and chemicals whenever possible
- Reduce the number and types of materials used, and standardize on types of plastic resins
- Use molded-in colors and finishes instead of paint, coatings, or platings whenever possible
- Help customers use resources responsibly by minimizing energy consumption of HP’s printing, imaging, and computing products
- Increase use of pre- and post-consumer recycled materials in product packaging
- Minimize customer waste burdens by using fewer product or packaging materials overall
- Design for easy disassembly and recyclability
Each of HP’s products includes environmental certifications, such as the absence of hazardous materials, for example cadmium and mercury, and of voluntary restricted materials (halogenated flame-retardants, halogenated plastics, and antimony trioxide), plus indications of features that conserve energy and other resources.
Sony similarly reports on the environmental impact of its products. For example:
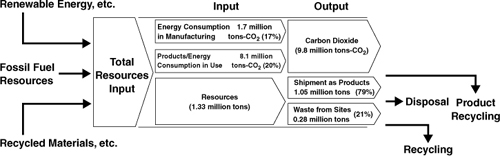
When the entire life cycle of a product is considered, the greater part of energy consumption results from the use of electric power by customers when operating Sony products. The CO2 generated over the whole lifetime of the products shipped during FY2000, for instance, is estimated at approximately 8.1 million tons. Sony is responding with efforts to reduce product power consumption and minimize CO2 discharges through improved product design and the introduction of new types of products and services.
F. Aggregate Environmental Measures
Some companies want to provide an aggregate picture of their total environmental impact; see, for example, Sony’s simple diagram (Figure 6-7) of environmental impact, which is supplemented with detailed data for each aggregate measure shown.
Figure 6-7 Sony Group’s Total Environmental Impact
Companies often create indexes of environmental incidents for their Balanced Scorecards. Company environmental experts develop strict definitions of what constitutes an environmental incident, such as an unexpected discharge of air, water, or solid waste. For example, Nova Chemicals, concerned about avoiding fires, started an initiative in 2000 to emphasize the triggering event for a process fire—the loss of process containment (LOPC). A team developed a definition of LOPC:
An unanticipated leak, spill or release of a process material in sufficient quantity or concentration to the air, water, land or work environment that resulted in, or could have resulted in, a process safety or environmental incident.
Nova Chemicals was also concerned about product releases during transportation by rail, truck, and marine and pipeline routes. It developed a measure, Non-Accident Releases (NAR), to track any product release, in quantities as small as 250 milliliters, that is judged to have been preventable through maintenance or inspection.
Once environmental indexes have been defined, targets established, and systems installed for tracking the data, operating managers are then responsible for reporting (and the environmental group for auditing) all incidents. The environmental index alerts employees to the nature of incidents to be avoided, thereby affecting their behavior. It serves as a lead indicator on the scorecard for driving improvements in the company’s environmental performance.
The International Organization for Standardization (ISO) develops voluntary technical standards for businesses around the world, helping to make “the development, manufacturing, and supply of products and services more efficient, safer, and cleaner.” Starting in 1996, ISO has developed the 14000 family of standards for environmental management. To date, the family includes more than 350 specific standards for the monitoring of the quality of air, water, and soil, as well as standards for developing environmental management systems. Companies are beginning to report on compliance with the ISO 14000 family of international environmental standards on their environmental scorecards.
Other voluntary environmental standards have also arisen. In the United Kingdom, a group of companies established the Business in the Environment (BiE) Index of Corporate Environmental Engagement. The BiE survey compares the extent to which participating companies engage in environmental management, and how they assess and manage their environmental performances. For example, Diageo, the U.K.-based wine and spirits company, provided the following information in its 2001 Environmental Report:
| BiE Index | |||
| 1999 | 2000 | ||
| Diageo score | 63.8% | 73.9% | |
| Diageo overall ranking (184 participating companies) | n/a | 74 | |
| Diageo ranking (industry segment) | 10th/17 | 10th/23 | |
| Diageo ranking (FT100) | 56 | 48 |
Acknowledging the need to improve in areas of weakness in suppliers, environmental management systems, transport, and biodiversity, Diageo pledged to improve environmental processes that would raise its performance in the future.
BT also participates in the BiE survey. In the BT 2001 report, “Better World: our commitment to society,” the company disclosed:
In the BiE Index of Corporate Environmental Engagement (2000), BT was the top placed telecommunication company, and we were placed eight overall, out of the 78 FTSE 100 companies that participated. Our overall score was 96 percent compared with an industry average of 47 percent and a FTSE 100 companies average score of 68 percent.
At the end of 1999, Lloyds Register Quality Assurance awarded ISO14001 certification to BT’s environmental management system covering all our UK operations.
The International Chamber of Commerce established the Business Charter for Sustainable Development. The charter articulates sixteen principles for environmental management, which it urges businesses to adopt and express public support for. But, to date, the charter offers no consistent quantitative way for companies to report their performance for each of the sixteen principles.
In summary, many companies already provide extensive quantitative information on their environmental performances. Most of these likely have such data to satisfy regulatory reporting requirements, and they repackage the regulatory data in supplementary reports, often called a Citizenship or Sustainability Report. For these measures to be relevant for a Balanced Scorecard, executives must identify those environmental measurements that are relevant and important to their strategy for long-term value creation. In the next section, we discuss how executives can think strategically about their environmental performance.
Linking Environmental Measures to Strategy
Forest Reinhardt has identified five ways in which companies can leverage their environmental capabilities to create shareholder value:7
- Reduce cost
- Differentiate products
- Manage competitors
- Redefine markets
- Manage risk
1. Reduce cost. For some companies, improved environmental performance may constitute a rare instance of a “free lunch,” much like the “quality is free” experience of early adopters of total quality management.8 Michael Porter popularized the idea that companies could simultaneously cut costs and improve environmental performance.9 While this is not a universal phenomenon, companies such as Xerox, with its Environmental Leadership Program, discovered that they could save substantial amounts in waste management (shipping waste to landfills) and raw materials purchasing by paying more attention to environmental impacts during the product design stage and by operating effective product take-back programs.
Activity-based cost systems can reveal total life cycle costs by assigning the costs of waste and disposal to individual processes and products. Such an analysis reveals which processes and products incur high environmental costs, and where opportunities exist for design and process improvements that will lower the total cost of producing and recycling products. Such cost reduction will be accompanied by a reduction in the company’s environmental footprint.
2. Differentiate products. In the more usual circumstance, in which improved environmental performance does not come with more-than-offsetting cost-reduction benefits, companies can strive to recover their higher environmental costs by differentiating their products. Some customers are willing to pay higher prices or purchase more from companies known to have environmentally friendly products and processes. In some instances, the customers are not being altruistic; they may capture some of the benefits of the environmentally friendly product by having their own costs lowered.
Reinhardt points out the three necessary conditions for successful environmental product differentiation:
- Customers are willing to pay more for an environmentally friendly product
- Company has been able to communicate credibly its product’s environmental (or cost reducing) benefits
- Company can protect its environmental advantages from competitors
Shell and BP are actively trying such a differentiating strategy in the petroleum industry, and Patagonia, a manufacturer of recreational clothing, has developed a loyal base of customers who purchase its clothing for active outdoor sports, because of the company’s well-publicized commitment to conservation.
3. Manage competitors. Chemical companies have worked through their industry associations to develop voluntary environmental and safety standards for all companies in the industry. In this way, the companies are more likely to have standards that are both effective and achievable in cost-efficient ways, rather than have punitive and cost-ineffective regulations imposed by governmental authorities. Also, by gaining agreement among all the major companies in the industry to adopt the voluntary standards, the industry reduces the cost to the public through reduced pollution but does not put any single company at a competitive disadvantage. All companies in the industry agree to comply with the new standards.
A variation of this strategy is available to a company that already exceeds existing regulatory requirements with its products and processes, but whose competitors don’t (they are just complying with the requirement). The company can lobby the governmental regulatory agency to tighten the environmental standard to its current performance, thereby placing all competitors out of compliance and subject to costly remediation efforts.
4. Redefine markets. Some companies have redefined their business models in ways that lower their costs, increase customers’ willingness to pay, and reduce environmental impact. Manufacturers of expensive electronic equipment, such as Xerox, HP, Canon, and IBM, now often require that customers return their used equipment when they purchase or lease new equipment. The customer avoids the costs—both out-of-pocket and environmental—of disposing of their obsolete equipment, and the manufacturer can disassemble and recycle many of the components from the used equipment into its new machines. In 1995, Xerox estimated that this change accomplished several objectives simultaneously:
- Saving several hundred million dollars in raw materials purchases by recycling parts from used machines
- Consuming significantly less natural resources in the manufacture of its products
- Lowering its customers’ disposal costs
5. Manage environmental risk. Beyond benefits in higher revenues and lower costs, companies can enhance their overall risk management programs by improving their management of environmental risk. Environmental incidents can lead to heavy cleanup costs, litigation, consumer boycotts, and loss of reputation. Much like the management of foreign exchange, interest rate, and commodity price risks, companies may need to excel at managing their risk from environmental incidents. Companies can take several different steps to reduce their environmental risk exposure:
- Provide managers and employees with better information about how to avoid and mitigate environmental incidents
- Reduce the probability of environmental incidents through explicit prevention activities
- Reduce the total cost of an environmental incident should one occur through rapid response
- Transfer some of the risk through purchase of insurance policies
To summarize, companies should treat their environmental performance similarly to that of any important process. No company can expect to be the best across a broad range of environmental indicators. Companies need to identify where enhanced environmental performance provides the greatest opportunity for them to lower costs, differentiate their products, and reduce risk. Some environmental monitoring and reporting will be diagnostic, not strategic. It will ensure that the company complies with the regulations where it operates and sells, but will not provide a basis for differentiation. The environmental objectives and measures chosen for a company’s Balanced Scorecard should represent those areas in which environmental excellence can provide a synergy by simultaneously increasing shareholder value and reducing the company’s environmental footprint.
2. Safety and Health Performance
Unlike the considerable diversity of environmental measures, companies tend to use relatively few and more standardized measures of employee safety and health performance. As with environmental measures, safety and health reporting is largely triggered by regulatory requirements. In the United States, such requirements come from the Occupational Safety and Health Administration (OSHA). A commonly used safety incidence measure is the number of OSHA recordable cases per 100 employees.10 The effects of injuries and illnesses are summarized by lost workdays per 100 employees or per 200,000 hours worked (see Figure 6-8 for DuPont’s injury and illness report in its 2001 Global Progress Report). The table below shows the statistics reported each year by Hewlett-Packard:
| Region | Incidence Rate (OSHA recordable cases per 100 employees) | Lost Workday Case Rate (cases per 100 employees) | ||||
| 1999 | 2000 | 2001 | 1999 | 2000 | 2001 | |
| United States | 2.53 | 1.71 | 1.54 | 0.47 | 0.25 | 0.24 |
| EMEA | 0.61 | 0.67 | ** | 0.42 | 0.41 | ** |
| Asia Pacific | 0.36 | 0.37 | 0.1 | 0.23 | 0.14 | 0.06 |
| Canada | 1.36 | 1.41 | 2.19 | 0.16 | 0.41 | 0.51 |
| Latin America | 0.26 | 0.11 | 0.23 | 0.17 | 0.09 | 0.16 |
** 2001 EMEA data not yet available.
Figure 6-8 DuPont Total Recordable Injuries and Illnesses (per 200,000 Hours Worked)
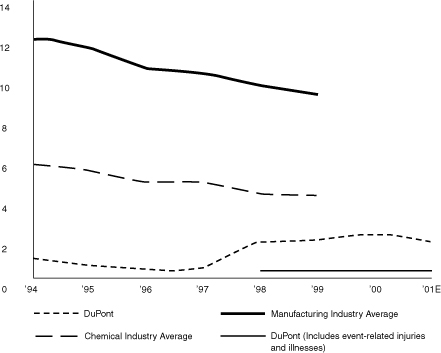
Royal Dutch/Shell reports health and safety performance using the Total Reportable Occupational Illness Frequency for illnesses per million hours worked, and Total Reportable Case Frequency for safety accidents and illnesses per million hours worked. DuPont goes one step further by including the incidence of employee off-job injuries, signaling that any injury to an employee, whether job-related or not, is costly to the individual, his or her family, and the company. Bristol-Myers Squibb measures employee exposure to hazardous compounds.
As with environmental measures, some companies develop definitions of safety-related incidents and track the frequency of such incidents.
3. Employment Practices
Much of the quantitative reporting about employment practices relates to increasing the diversity of employees. Companies attest to the ways in which increased diversity contributes to corporate success. For example, Siemens states:
Diversity is for us an invaluable source of talent, creativity and experience. It comprises all the differences in culture, religion, nationality, race, ethnicity, gender, age and social origin—in short, everything that makes the individual singular and unique.
Diversity improves competitiveness by enlarging the potential for ideas and innovation. Diverse teams addressing problems from varied perspectives will be more productive and achieve better solutions. We will benefit from the potential of diversity not only in a global context, but also within countries, locations and teams. Diversity is a business imperative and part of our social responsibility as well.
As a specific example, Siemens, in South Africa, established a target that 70 percent of all new trainees must be from previously disadvantaged communities, and that these employees should be increasingly represented at management levels. The initial target of 30 percent representation at middle and senior management levels was achieved eighteen months ahead of schedule, and the target was revised upward to 46 percent representation over the next five years.
Quantitative representation of diversity is often presented by companies in tables that summarize the percentage of women and minorities by type of employment: officials and managers, professionals, technicians, marketing and sales, office and clerical, crafts, operatives, laborers, and service workers. A global corporation, such as Royal Dutch/Shell, reports on the percentage of country head positions held by people from that country.
Benchmarking and rating organizations provide opportunities for companies to demonstrate superior performance in their diversity programs. For example, Race for Opportunity, a U.K. national network of business organizations, focuses on race and diversity as a business agenda. It did a 2002 benchmarking study in corporate Britain covering 2.75 million U.K. employees in 99 private- and public-sector organizations (including 18 of the FTSE 100). BT could report that it ranked number one among private sector organizations in its employment of black and Asian managers. Opportunity Now, another component in the U.K. Business in the Community organization, evaluates company performance on gender issues. In 2001, BT received a Gold Standard award for its approach to gender issues.
The decision about which safety, health, and employment practice measurements get incorporated into a company’s Balanced Scorecard should follow the same discipline as that articulated for environmental measurements. Compliance with regulatory reporting standards is not a sufficient rationale for such measurements to be incorporated. The Balanced Scorecard is not the only measurement and reporting system that a company needs. The BSC should represent those measures whose improvement will drive the company’s strategy forward, in some explicit way, and ultimately lead to enhancements in shareholder value. Executives must determine those safety, health, and employment measurements that reinforce other aspects of the company’s strategy through cost reductions, revenue and margin enhancement, and risk management.
4. Community Investment
Many companies provide extensive descriptions of the monetary contributions they make to community-based nonprofit organizations, and to the extensive volunteering done by company employees in communities. Most large corporations have established foundations by which money is systematically directed to worthy community-based organizations.
For example, Coca-Cola espouses, as one of its four core values:
Community
We will contribute our time, expertise and resources to help develop sustainable communities in partnership with local leaders. We will seek to improve the quality of life through locally relevant initiatives wherever we do business.
In its Citizen Report, Coca-Cola discloses:
The strongest communities are those that draw people together in common causes. We empower employees to support civic causes through volunteer programs designed together with community partners. We enhance their individual efforts by matching the donations to charitable organizations. Coca-Cola managers play key leadership roles on the boards of United Way, Big Brothers and Big Sisters, Boys & Girls Clubs of America, Special Olympics and other local, national and international nonprofit organizations.
Some companies provide specific quantitative information on their investment into communities. Bristol-Myers Squibb created “Secure the Future,” a five-year, $115 million commitment to partner with the African nations of South Africa, Botswana, Namibia, Lesotho and Swaziland, Senegal, Côte d’Ivoire, Mali, and Burkina Faso, to find sustainable and relevant solutions for the management of HIV/AIDS in women and children, and to provide resources to improve community education and patient support. The Bristol-Myers Squibb Foundation provides extensive support on issues relating to women’s health, health-care infrastructure in developing and transitioning economies, and science education and research.
Novartis established a Foundation for Sustainable Development that sponsors projects in the areas of health, social development, and emergency aid that will improve the quality of life to people living in poverty. Its Community Partnership Day gives its worldwide employees the opportunity to participate in social activities in the communities in which they live and work.
IBM has made education the top priority for its philanthropic efforts. Through its Reinventing Education program, IBM works with school partners throughout the world to develop and implement innovative technology solutions designed to enhance the education of disadvantaged children. For each grant site, IBM contributes money, researchers, educational consultants, and technology. In its KidSmart Early Learning program, IBM donates tens of thousands of Young Explorer computers to preschools in the United States and internationally to give computer access to millions of children, most from low-income families with little access to computers at home.
In April 2000, Nokia established the Make a Connection program, a global initiative with the International Youth Foundation to help young people connect with peers, families, and their communities. The program improves young peoples’ educational opportunities and teaches them life skills through direct training, mentoring, and volunteering opportunities, and by training adults (teachers, youth workers). In the United States, Nokia initiated ClassLink, a project that equips thousands of classrooms with wireless technology, enabling students, teachers, and parents to connect more effectively, and VisionOne, providing tens of thousands of Native Americans with wireless phones.
Corporate Community Investment: The Dark Side
The preceding descriptions are just a small fraction of the quite extraordinary investments that companies are making in the communities in which they operate and in disadvantaged countries around the world. The extent of enlightened corporate philanthropy is remarkable. Unfortunately, there is a dark side to this picture. Companies reporting on their community investments describe only the inputs they provide—money, people, equipment, and expertise. Extensive reporting on these investment inputs can be found in the detailed annual reports of their corporate foundations. Missing from all these reports, however, is any measure of the outcomes achieved by such philanthropy.
Consider the reporting standards that companies use for their environmental, health, and safety reports, and contrast these with standards used to report on community investment. The company environmental, health, and safety reports documented earlier in this chapter provide quantitative evidence of the effectiveness of company investments. The reports contain detailed statistics and trends on reduction in water, air, and soil pollution, on reductions in energy and materials requirements per unit of output produced, and on reductions in days lost from accidents and illnesses. For employee hiring and promotion policies, companies provide detailed statistics of the number of women and minority employees who have achieved senior technical and managerial positions.
Company reporting on community investments, however, reveals only how much has been spent, how many employees have been involved in community activities, and which programs the company is supporting. While the reports often show pictures of committed employee volunteers and the happy and grateful recipients of this corporate largesse, we learn nothing systematic about the impact of companies’ substantial investments. A Nokia statement, better than most, at least makes an attempt at output measures:
Altogether the Make a Connection program has already made a tangible difference in the lives of almost 20,000 young people, has trained almost 400 adults in reaching out to young people, and has indirectly benefited more than 1,000,000 young people and adults. Nokia has committed more than U.S.$11 million to the program.
But even this disclosure falls far short of what company executives should expect to learn about the returns from their $11 million investment. What tangible difference has been made in the skills, capabilities, motivations, or successes of the 20,000 young people who have been reached by Make a Connection? What social return has Nokia realized from its investment?
Executives demand detailed justification for capital investments, and they expect tangible returns from spending on research and development, advertising, employee training, and quality. Yet these same executives put their analytic side to sleep when committing substantial financial, personnel, and equipment resources to community-based programs. Rather than being a constructive force for change, corporate executives acquiesce in the general lack of accountability and performance information from the nonprofit and NGO sectors.
Perhaps companies’ community investments are in an early evolutionary stage, and company executives are not yet demanding quantitative performance data from these programs. But this complacency should not persist. Company executives should expect and demand performance data from any program in which they invest. The outcomes need not and likely should not be denominated in dollars, euros, or yen. But they should be denominated in measurable improvements in educational performance, women’s opportunities, health, or whatever outcome the community-based program is expected to produce. Mechanisms for performance-based social investing do exist. Organizations like the innovative venture philanthropy fund New Profit, Inc., in Cambridge, Massachusetts, demand that the social enterprises in which they invest have a detailed performance model, based in fact on the Balanced Scorecard, to describe their strategy for success and to provide feedback on the outcomes achieved.11 Companies need to demand output and outcome data from their foundation executives and from the executives of community-based programs that they support. The goal would be to have the quality of reporting from companies’ community investments match that from their environmental, health, and safety programs.
Deriving Competitive Advantage from Community Investment
Michael Porter and Mark Kramer echo our view about the need for companies to think much more strategically about their philanthropic activities.12 They argue that corporations should use their charitable efforts “to improve their competitive context—the quality of the business environment” in which they operate. For example, Cisco Systems invests in educational programs that train computer network administrators. The programs provide skills for an attractive job opportunity for high school graduates and simultaneously alleviates a potential constraint for expanded use of Cisco products. Porter and Kramer identify four elements of a competitive context that companies can influence through philanthropic activities:
- Input factor conditions: A company’s productivity and competitive position can be enhanced by increases in the supply of trained workers, high-quality scientific and technological institutions, good physical infrastructure (such as roads and telecommunications in developing nations, and excellent arts organizations in developed regions and nations that attract mobile, talented employees), and transparent, honest governmental processes.
- Demand conditions: Companies such as Digital Equipment Corporation in the 1960s and 1970s and Apple Computer donated their products to universities and schools. Upon graduation, students who had become computer literate with the donated equipment naturally preferred to purchase that equipment for their companies and their personal use.
- Rules for competition and rivalry: Companies that compete based on superior products, processes, and services don’t want to have their advantages undermined through theft of intellectual property and bribery and corruption activities by less able rivals. It is in the best interest of high-performing companies to compete on a level playing field. Companies can donate to organizations that improve the rule of law in countries where they produce and sell.
- Related and supporting industries: Porter had previously described the competitive benefits in geographic clusters of suppliers, producers, and sophisticated consumers.13 Companies can invest in suppliers and infrastructure that supports the industry in which it competes.
Porter and Kramer conclude:
The more tightly corporate philanthropy is aligned with a company’s unique strategy—increasing skills, technology, or infrastructure on which the firm is especially reliant, say, or increasing demand within a specialized segment where the company is strongest—the more disproportionately the company will benefit through enhancing the context.14
They concur with us that companies must “rigorously track and evaluate results. Monitoring achievements is essential to continually improving the philanthropic strategy and its implementation.”15
Company Strategic Alliances
Several companies have indeed moved beyond a pure “philanthropic but no results” stage in their community investments to active involvement and partnerships in the community organizations they support. Research by Jim Austin of the Harvard Business School documents how companies’ collaborations with nonprofits yield important benefits in:16
- Strategy enrichment: Generating business opportunities and promoting a positive and trusted image with customers (particularly important for retail service organizations), regulators, and legislators
- Human resource management: Attracting and retaining higher-quality employees; strengthening employee motivation and morale; developing leadership capabilities
- Culture building: Shaping and reinforcing the core values that elicit desired employee behavior
- Business generation: Enhancing a company’s reputation, building goodwill, expanding networks of relationships, increasing access to key consumers, and providing a venue for testing innovations
The partnership between Timberland, the outdoor boot and apparel outfitter, and City Year, an urban youth service corps, provides an excellent example of such a strategic collaborative relationship. It took several years for this relationship to evolve from the philanthropic stage—giving money and in-kind donations (Timberland boots to City Year corps members); to the transactional stage—joint events, such as cause-related marketing, event sponsorships, licensing, and paid service arrangements; to the integrative stage—the company and the community organization have become an integrated joint venture that is central to both organizations’ strategies. Value creation becomes a joint process, rather than two separate processes, one for the company and one for the community organization.
Georgia-Pacific and The Nature Conservancy (TNC) provide an example of a relationship that has evolved from confrontation to collaboration. TNC wanted to preserve land, untouched, and Georgia-Pacific wanted to use land intensively to harvest trees. The two organizations found common ground to jointly manage unique forested wetlands in ways that preserved biodiversity while also permitting commercial development. Other such integrative relationships include Starbucks and CARE; Bayer North America and the Bidwell Training Center in Pittsburgh; Reading is Fun and Visa, International; The College Fund (the largest minority educational assistance organization in the United States) and Merck; The National Science Resource Center (for improving the teaching of science in elementary and high school education) and Hewlett-Packard; Time to Read and Time Warner.
Successful collaborations generally occur when the community partner complements the company’s core business or strategy. As a senior executive of Bayer emphasized:
You need to be invested in something that has to do with your business…. You need to be able to give and to get. We’re a science-based company. It makes business sense for us to support science education…. It’s not that we don’t get good public relations from being involved, but we have a core reason to be involved.17
When companies enter into such strategic collaborations, they can help to shape the value that will be created and the metrics that will be used to assess performance. The social value generated will arise from the mission of the nonprofit community organization. The challenge is for the company to assess the incremental or distinctive social value created by the collaboration. The company needs to measure how society is better off from its investment and its collaboration with the community organization.
As companies shift their community investments from the philanthropic stage to the integrative or collaborative stage, they will, like the New Profit, Inc. venture philanthropy fund, be able to exert more leverage for measurable performance data from the community organizations in which they invest. Even for their passive, philanthropic-stage investments, companies can restrict funding to those organizations that can document successful outcomes. Companies can then use such outcome data in their reports, rather than simply itemizing all the resources contributed to organizations.
With a performance-based model for community investments, the community organizations and the NGOs that are more successful in generating superior outcomes will attract higher and more stable funding. Those organizations that are unable to deliver measurable performance improvements will receive less and eventually wither away. This performance-based competitive dynamic will make the non-profit/NGO “third sector” far more effective and much more efficient, thereby generating large aggregate benefits to society. But companies must take a lead role—through their foundations and through their voluntary contributions—in setting a standard that requires output and outcome measurement from their community investments. Continued simplistic reporting of money spent and programs supported, accompanied by pictures of grateful and happy recipients, should not be the preferred standard for companies’ community investments, any more than disclosing money spent on environmental cleanup and an occasional picture of a smokeless exhaust tower and fish swimming in a nearby river would be considered adequate for environmental reporting.
SUMMARY
Many companies today recognize that achieving excellence in environmental, safety, health, employment, and community practices are part of long-term value-creating strategies. At a minimum, achieving good regulatory and social performance is a long-term objective that enables companies to maintain their franchises to operate in all communities where they wish to make, market, sell, and distribute their products and services. Beyond just complying with local regulations and expectations, however, companies that excel in critical regulatory and social processes can enhance their reputations among customers and investors, and also help to attract and retain valuable employees who take pride in their companies’ roles in improving the environment, the workplace, and the community.
Companies should strive to identify the regulatory and social process objectives that will have the biggest impact for enhancing employee attraction and retention, the customer value proposition, and financial performance. In their investments in communities around the world, companies should seek opportunities that leverage their competencies and that enhance their strategic objectives. They should be as diligent and rigorous in assessing their returns from community investments as they are in evaluating the effectiveness of their investments in tangible and intangible assets.
Following this chapter is the case study and strategy map for Amanco, a Latin American company that is using the Balanced Scorecard to describe and implement its triple-bottom line strategy for simultaneously creating economic, social, and environmental value.
NOTES
1. M. Epstein and B. Birchard, Counting What Counts: Turning Corporate Accountability to Competitive Advantage (Reading, MA: Perseus Books, 1999), especially “The Figures of Social Responsibility,” 130–140, and “A Social Accounting,” 216–242.
2. Such (inaccurate) criticism has already appeared; see, for example, the statement, “The Balanced Scorecard is the managerial equivalent of stakeholder theory,” in M. Jensen, “Value Maximization, Stakeholder Theory, and the Corporate Objective Function,” Journal of Applied Corporate Finance (Fall 2001): 17.
3. “Diversity Lives at BellSouth,” Workforce (January 2002): 18.
4. Novartis, “Innovation and Accountability: Health, Safety and Environment Report 2000.”
5. Coca-Cola, “Keeping our Promise: Citizenship at Coca-Cola,” 27.
6. DuPont, Global Progress Report, <http://www.dupont.com/corp/social/SHE/usa/us3.html>.
7. Forest Reinhardt, Down to Earth: Applying Business Principles to Environmental Management (Boston: Harvard Business School Press, 2000), and “Bridging the Gap: How Improved Information Can Help Companies Integrate Shareholder Value and Environmental Quality,” in Environmental Performance Measurement: The Global Report 2001–2002, ed. D. Esty and P. Cornelius (New York: Oxford University Press, 2002).
8. See Philip B. Crosby, Quality Is Free (New York: McGraw Hill, 1979).
9. Michael E. Porter, “America’s Green Strategy,” Scientific American (April 1991): 168; and Michael E. Porter and C. van der Linde, “Green and Competitive: Ending the Stalemate,” Harvard Business Review (September–October 1995).
10. OSHA Regulation 1904.7 states: “Basic requirement. You must consider an injury or illness to meet the general recording criteria, and therefore to be recordable, if it results in any of the following: death, days away from work, restricted work or transfer to another job, medical treatment beyond first aid, or loss of consciousness. You must also consider a case to meet the general recording criteria if it involves a significant injury or illness diagnosed by a physician or other licensed health care professional, even if it does not result in death, days away from work, restricted work or job transfer, medical treatment beyond first aid, or loss of consciousness.”
11. See Robert S. Kaplan, “New Profit, Inc.: Governing the Nonprofit Enterprise,” Case 9-100-052 (Boston: Harvard Business School, 2000).
12. Michael E. Porter and Mark R. Kramer, “The Competitive Advantage of Corporate Philanthropy,” Harvard Business Review (December 2002): 57–78.
13. Michael E. Porter, The Competitive Advantage of Nations (New York: Free Press, 1990).
14. Porter and Kramer, “The Competitive Advantage of Corporate Philanthropy,” 63.
15. Ibid., 68.
16. James E. Austin, The Collaboration Challenge: How Nonprofits and Businesses Succeed Through Strategic Alliances (San Francisco: Jossey-Bass, 2000).
17. Ibid., 67.
CASE STUDY
AMANCO
Background
Amanco is a leading company in Latin America in the production and marketing of plastic pipes and fittings for fluid transportation, with solutions for buildings, infrastructure, irrigation, and environmental engineering. Amanco’s mission is to profitably produce and sell complete, innovative, world-class solutions for the transportation and control of fluids. The corporate vision is “to be recognized as a leading industrial group in Latin America, operating in a framework of ethics, eco-efficiency, and social responsibility, that generates economic value and improves our neighbors’ and our region’s quality of life.”
Amanco is part of Grupo Nueva, a privately owned group that consists of several business divisions and is supervised by a board of directors. Amanco is present in all major countries in Latin America including Mexico, Central America, Panama, and the Andean and Mercosur regions.
The Situation
The company introduced a sustainability scorecard in 2000 as its integrated management system, and to report on its activities based on the global reporting initiative. Julio Moura, president and CEO of GrupoNuevo, stated that “Customers want products that improve the society in which they exist, that protect its environment, and that team up with its people.” In 2002, Amanco revised its sustainability scorecard to align better with the Balanced Scorecard framework. The revision process ended in early December 2002. Strategy meetings, with the goal of managing Scorecard effectiveness and results, have been held from that date on. The company is also revising the sustainability score-card of its regional operational units.
The Strategy Map
Amanco’s strategy map shows the “triple bottom-line” results and the strategy it is following to achieve those results (see Figure 6-9).
The top of the strategy map shows Amanco’s commitment to triple bottom-line performance:
- Create economic value sustainably in the long run
- Generate value through a system of corporate social responsibility
- Generate value through environmental management
The financial dimension has an objective for sustainable profitable growth with targets of 10 percent annual sales increases and return on net assets of 24 percent. Amanco also wants to “operate efficiently,” and includes an objective to reduce working capital.
The customer dimension encompasses three objectives. The brand management objective describes the four Amanco brand attributes—integrity, innovation, solutions, and reliability—that would lead Amanco to be viewed as the number one pipe system supplier in Latin America. Innovation and high-margin products enable Amanco to offer differentiated solutions to its customers. Customer satisfaction measures relate to on-time delivery, first-pass yields for complete and accurate deliveries to its more than 35,000 customers, order lead time, and overall customer perception of satisfaction.
The process and technology dimension emphasizes effective product creation processes to produce environmentally friendly, innovative products that are reliable and long-lasting. The product development process includes a screening phase to evaluate the potential effects of all new products on health and the environment. It uses a cradle-to-grave approach that includes raw materials, production processes and equipment, use of finished goods, packaging, and final disposal. This dimension also includes initiatives in customer relationship management (CRM) and e-business to create a deeper knowledge of customers’ needs and expectations. A pilot CRM project in Mexico focuses on improving logistics processes, leading to more accurate orders, compliance with time and quality delivery commitments, and freight cost reductions.
Amanco’s special emphasis on social responsibility and eco-efficiency has led to a fifth dimension: environmental and social. In this dimension, Amanco measures health and safety performance by lost-time injury frequency. Its environmental performance objective, based on eco-efficiency concepts, is to reduce the per-unit inputs and wastes from its products and processes. It measures per-unit energy and water consumption and raw materials waste and scrap. In addition to contributing to lower costs, Amanco believes its eco-efficiency will add value to its products; it expects to attract more customers through the environmental and social responsibility embedded in its company branding and logo. Its social impacts objectives relate to community development projects throughout Latin America. Each operating company must have at least one project implemented, in collaboration with a nongovernmenal organization (NGO), in a local community. Amanco wants to add value where others are not taking action, particularly in areas related to its core businesses, such as housing, water, and sanitation.
Figure 6-9 Amanco Triple Bottom-Line Strategy Map
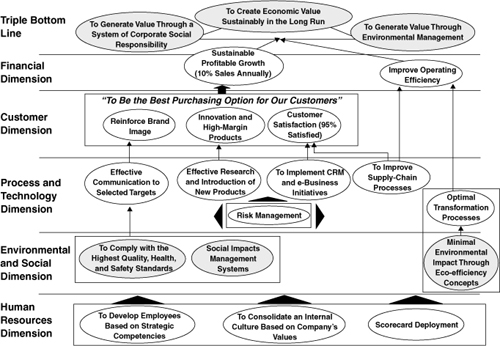
The human resources dimension includes measures of job satisfaction with the working environment, job turnover, and skills and competencies of employees. This dimension also includes measures of a healthy mix of youth and seniority, and availability of good employment opportunities for young workers.
Anecdotes
The company has been able to communicate the strategy in a more objective and clear way, helping executives and employees understand strategic goals and initiatives. The sustainability effect, with its triple bottom-line results, has been better understood and managed.
Amanco has scheduled and implemented quarterly meetings to manage and learn from the current strategy. A strategy management committee was created for these activities, and a yearly strategic planning process will ensure strategy updates when needed. Roberto Salas, Amanco’s CEO, states that “the Balanced Scorecard, in this new version, is a very powerful tool to align our people to the strategy and monitor the advances in our strategic goals.”
_______________
Mathias Mangels and Carlos Graham of Symnetics, the Latin American affiliate of the Balanced Scorecard Collaborative, helped to prepare this case study. Our thanks to Mr. Roberto Salas, CEO, for sharing the Amanco experience.