C H A P T E R T H R E E
OPERATIONS MANAGEMENT PROCESSES
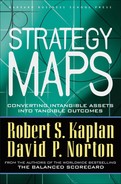
OPERATING PROCESSES PRODUCE and deliver goods and services to customers (see Figure 3-1). For a period in the late twentieth century, many scholars and companies believed that managing operations was the most critical component of any organization’s strategy. Inspired by the remarkable results achieved by Japanese manufacturers in transportation, electronics, and optical industries, most companies placed a high priority on redesigning, reengineering, and continuously improving their critical operating processes.
Companies’ efforts to achieve operational excellence were largely successful. Many enjoyed dramatic improvements in the quality, cost, and responsiveness of manufacturing and service delivery processes. While operational excellence alone is not the basis of a sustainable strategy, managing operations remains a priority for all organizations.1 Without excellent operations, companies will find it difficult to execute strategies, even strategies that are not dependent on having the lowest cost structure in the industry.
FOUR OPERATIONS MANAGEMENT PROCESSES
Operations management can encompass up to four important processes (see Figure 3-2):
- Develop and sustain supplier relationships
- Produce products and services
- Distribute and deliver products and services to customers
- Manage risk
Figure 3-1 Operations Management
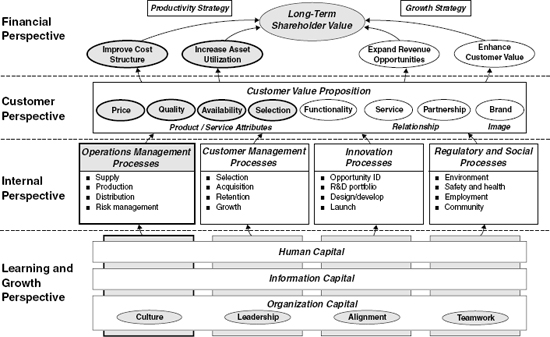
Figure 3-2 Operations Management Strategy Map Template

We discuss each in turn.
1. Develop and Sustain Supplier Relationships
Companies, such as Toyota and Wal-Mart, depend on their suppliers to produce high-quality products on short notice and deliver them reliably to their point of use. These companies enjoy significant competitive advantages from their established networks of superb supplier relationships.
One objective for effective supplier relationships is to lower the total “cost of ownership.” This objective represents the total cost of acquiring goods, materials, and services. In addition to purchase price, companies incur costs to perform the following activities when acquiring goods:
- Perform design and engineering work to determine materials specifications
- Order materials
- Receive materials
- Inspect materials
- Return materials
- Move materials
- Store materials
- Scrap obsolete materials
- Scrap and rework products because of (undetected) defective incoming materials
- Delay production because of late deliveries
- Expedite materials to avoid shutdowns because of late-arriving materials
- Pay for materials
The best suppliers are low-cost, not merely low-price. Purchase price is only one component of the total cost of acquiring materials. The total cost of ownership of acquiring goods or services from an individual supplier includes the purchase price plus the cost of performing all the procurement-related activities listed above for the items purchased from that supplier. Activity-based costing (ABC) enables companies to assign aggregate procurement costs to the procurement activities and then trace these activity costs to the goods and services acquired from individual suppliers.2
To lower the costs of acquiring products, companies strive to find suppliers that accept electronic orders (Internet or EDI) and that deliver products with no defects, requiring no inspection, just-in-time, and directly to the manufacturing process or point of use. Further, low-cost suppliers issue no invoices and accept automatic electronic payments.
Some companies have gone even further by eliminating their purchasing function for certain items entirely. Suppliers station their own person at the company’s site and that person orders and manages the flow of incoming materials (including any local storage) before releasing the materials to the company’s production process, as needed.
Other supplier objectives, beyond cost reduction, relate to the timeliness and quality of supplied goods and services. Many companies aggregate their supplier cost, time, and quality metrics into an overall supplier scorecard measure. For example, Visteon maintains a Web site on which suppliers can continually see their ratings on delivery and quality performance.
In recent years, many organizations have outsourced noncore functions, such as information technology, telecommunications, financial transaction processing, and plant maintenance, as well as the production of mature products and services. Such outsourcing enables the company to focus its resources and management time on the processes that provide differentiation, uniqueness, and competitive advantage. When extensive outsourcing is part of the organization’s strategy, enhancing the performance (cost, quality, and response time) of outsourced services represents an important strategic objective for operations management.
Some companies depend on their suppliers for product innovation and design, freeing up internal engineering resources for advanced product development and systems integration. Others integrate their supplier products and services with their own to enhance the value proposition offered to customers. For example, financial service companies partner with their suppliers to provide customers with a single source for a broad range of financial products. In these situations, managing supplier relationships would include objectives for supplier innovation or the provision of value-adding services directly to the company’s customers.
Once supplier relationships have been established, companies strive to lower the cost and time required to acquire materials and services from their suppliers and to eliminate errors. Drivers of efficient purchasing include the percentage of purchase transactions performed electronically, and the percentage of transactions done on a decentralized basis, say, by using a credit card with a specified upper limit, rather than through centrally approved purchase orders. Companies can explicitly measure the cost of operating the purchasing process with measures such as the (activity-based) cost per purchase order, and purchasing costs as a percentage of total purchases. The time required for purchases is measured by the elapsed time from when a request is made for an item until the item is delivered and ready for use. Of course, for organizations that have linked their operations to suppliers, replenishment can be continuous as suppliers track electronically the demands for their products and ship them without requiring an explicit purchase order. The quality of the purchasing process can be measured by the percentage of orders that arrive with the correct volume and mix of items at the correct time.
In summary, examples of objectives and measures for managing supplier relationships include the following:
2. Produce Products and Services
At the core of the operations management theme are the efficient, high-quality, and responsive operating processes that produce the goods and services used by the organization’s customers. The books that have been written on improving process cost, quality, and cycle times could fill a library.3 Initiatives such as reengineering, business process redesign, continuous improvement, activity-based management, total quality management, and time-based management are examples of the myriad programs that have been applied during the past quarter century to help employees improve process performance. We discuss the relevance of activity-based and total quality management later in this chapter.
Examples of objectives and measures for processes to be more efficient in the production of goods and services include the following:
| Objectives | Measures |
| Lower the cost of producing products/services |
|
| Continuously improve processes |
|
| Improve process responsiveness |
|
| Improve fixed asset utilization 5 |
|
| Improve working capital efficiency |
|
3. Distribute Products and Services to Customers
The third process within the managing operations theme is delivering the product or service to the customer. This objective is really the downstream version of lowering the total cost of working with suppliers. As with the previous supplier and operating processes, the typical objectives for distribution processes encompass the company’s cost, quality, and time performance as shown in the table below:
4. Risk Management
We have encountered, particularly in financial service companies, important objectives relating to managing risk, such as that arising from credit operations, interest rate movements, and foreign exchange fluctuations. For example, the Swiss Re strategy map (see Figure 3-3) includes two client (customer) objectives related to risk management:
- Long-term partner for risk and capital management
- The right risk and capital solutions
and several risk management objectives in the internal perspective:
- Leverage leadership in risk intelligence
- Comply with risk management processes
- Manage our book of risks
Of course, as a company offering risk management and diversification services to its customers, it is not surprising that Swiss Re has multiple risk management objectives in its strategy map.
Risk management should be about more than avoiding fluctuations in income and cash flow. A company’s investors generally hold diversified portfolios that allow unsystematic variation in the outcome from any single company’s performance to have minimum impact on their overall returns. Lisa Meulbroek describes five ways by which corporate-level risk management can create shareholder value in ways that investors cannot accomplish on their own:6
- Reduce the costs associated with financial distress, such as bankruptcy
- Moderate the risk faced by important nondiversified investors and stakeholders
- Decrease taxes
- Reduce monitoring costs
- Lower the cost of capital
Figure 3-3 Swiss Re Strategy Map
1. Reduce the Costs Associated with Financial Distress
Defaulting on debt covenants or working through bankruptcy proceedings incurs considerable costs to shareholders. The mere prospect of financial distress can cause important customers and suppliers to restrict their business with the company, or change the terms under which such business is conducted. Risk management processes that reduce the likelihood of such costly renegotiations can add value. Some companies hold large cash balances to reduce the likelihood of financial distress during an economic slowdown. For a somewhat extreme form of such risk management, Bill Gates, Microsoft founder and chairman, explained:
I wanted to have enough money in the bank to pay a year’s worth of payroll, even if we didn’t get any payments coming in…. We have about $10 billion now, which is pretty much enough for the next year.7
2. Reduce Risk Faced by Key Undiversified Investors
Many managers and employees have a disproportionate share of their wealth, both financial and human capital, tied up in the company for which they work. This wealth concentration arises from stock option plans, employee retirement plans, and company-specific skills that would be worth far less were their employment with the company to cease. Effective risk-management policies reduce the risks faced by these undiversified employees and perhaps lower the total compensation that otherwise would have to be paid to employees to compensate for the high company-specific risks they bear.
3. Decrease Taxes
Corporations that face a graduated income tax have an incentive to smooth earnings to make maximum use of the lower tax rates on lower levels of income. Also, because of limits on tax loss carrybacks and carryforwards, companies that can shift income from good periods to loss periods can lower the total taxes paid over an economic cycle. Finally, if risk management reduces total firm risk, the company can increase its debt capacity and take greater advantage of the tax deduction for interest payments.
4. Reduce Monitoring Costs
Companies, especially financial service companies, can have risks that investors find difficult to assess. To the extent that outside investors and creditors have difficulty quantifying the risks of a company, they will demand higher returns to compensate them for their higher monitoring costs or the extra risk they feel they are absorbing. Therefore, a company could lower its cost of capital by implementing sophisticated risk management techniques that lower the unpredictability of its cash flows and earnings.
5. Provide Internal Funds for Investment
Companies should hedge against risks that would cause them to have inadequate funds to invest in positive net present value investments. For example, one group of risk management scholars concludes:
A risk-management program should… ensure that a company has the cash available to make value-enhancing investments…. A proper risk-management strategy ensures that companies have the cash when they need it for investment, but it does not seek to insulate them completely from risks of all kinds.8
To accomplish the value-adding risk management objectives described above, a company can manage risk in three ways: Modify its operations, adjust its capital structure, and employ targeted financial instruments such as derivatives. Microsoft is an example of a company that uses an operating policy—to employ large numbers of temporary workers who can be laid off if business slows down—and a capital structure policy—a high stockpile of cash—to reduce its risk. Disney built its major theme parks in areas—Anaheim, California, and Orlando, Florida—where weather is generally pleasant and predictable. This lowers the volatility of its theme park revenues due to weather conditions. Additionally, companies take operating actions to reduce the risk that their products or services will be made technologically obsolete by competitors, or by actions taken by employees that can damage their brand and company reputations.
Choosing the appropriate level of debt clearly influences risk. Companies with high levels of debt, and low values of a key financial ratio—interest coverage, the ratio of earnings before interest, taxes, depreciation, and amortization (EBITDA) to interest expense—are more likely to encounter financial distress and be unable to fund positive net present value projects when they encounter business slowdowns. Conversely, high-debt companies reap benefits, when they are profitable, from the tax shield of interest payments and the leverage from earning high returns for shareholders using other people’s (creditors’) money. So lowering debt levels so that risk is totally avoided is not optimal.
Finally, by purchasing insurance and targeted financial instruments, such as futures, swaps, and options, companies can hedge their exposure risk to fluctuations in commodity prices, currency rates, interest rates, inflation, and stock market prices.
In summary, all companies should consider objectives for managing risk. Representative objectives and measures are shown in the table below:
| Objectives | Measures 9 |
| Manage financial risk/maintain high credit quality |
|
| Manage operating risk |
|
| Manage technological risk |
|
LINKAGE TO CUSTOMER PERSPECTIVE OBJECTIVES
Managing operations for effectiveness and efficiency enables organizations to offer their customers important elements of an attractive value proposition (see Figure 3-2):
- Competitive prices and low total cost of supply
- Perfect quality
- Speedy, timely purchase
- Excellent selection
Competitive Prices, Low Total Cost of Supply
Efficient operations enable companies to earn a margin on sales sufficient to recover costs and earn a return on invested capital while still offering customers attractive prices. Companies that strive to be the low-cost producer and supplier would have an objective to be profitable at the lowest price point in the industry. As we discussed in the managing supplier relationships process above, an excellent supplier may be able to realize somewhat higher prices than competitors by becoming its customers’ lowest-cost supplier. Such a company reduces its customers’ internal costs by eliminating many activities formerly done by the customer. So an even better price measure is the total cost incurred by the customer to acquire the company’s product or service. Of course, the customer must have a credible activity-based cost system to be able to attribute, and realize, the cost savings from having such a low-cost supplier.
Some companies’ customers are distributors, wholesalers, or retailers who resell the company’s product without changing its basic form. Such companies have an even more attractive value proposition for their customers. They would like to demonstrate that they are their customers’ most profitable supplier. Again, the customer would require a good activity-based cost system to do such granular measurement, but if feasible, you can hardly find a more compelling value proposition than proving that your company’s products make more profit for your customer than that made from any alternative supplier.
Perfect Quality
A company’s operations should strive to have its customers experience zero defects with its products or services. This objective is straightforward. The ideal customer experience is a product that meets customer specifications and is suitable for immediate use by the customer.
Speedy, Timely Purchase
Customers value rapid, reliable delivery of goods and services. Reliable delivery means delivering on time based on the customer’s expectation of the time window in which the delivery should occur. Most of us are unfortunately all too familiar with the quality of service from local monopolies, such as the telephone or cable company. Customers are told the serviceperson will arrive on a certain day, or, slightly better, in a four-hour time block (say, 8 A.M. to noon, or 1 P.M. to 5 P.M.). For people with fulltime jobs or busy schedules, being forced to remain at home for several hours to a day waiting for a serviceperson to arrive is not a high-quality experience. Many manufacturers or retailers now expect their just-in-time deliveries from suppliers to arrive within a one-hour period, not a daily, or even four-hour, time block.
On-time delivery, by itself, may not be a sufficient indicator of timeliness. Companies can often improve their on-time delivery performance by quoting long lead times for the delivery of the product or service. Long lead times provide a comfortable buffer to produce the product or service. But most customers prefer receiving the product or service sooner rather than later. So measures, beyond on-time delivery, could include the lead time quoted by the company, and the difference between customer-requested lead time and the lead time quoted and committed to by the company.
From the customer perspective, the company must measure the lead time experienced by the customer, not how long it takes the company to produce the good or perform the service. Jack Welch describes how the GE engine repair business formerly measured its performance by the time taken to repair a customer’s engine. The business took pride in having reduced this time from two days to one day. Welch challenged the business by asking how long the engine was out of service for the customer, the “wing-to-wing” time measured from the time the engine was taken off the plane to the time it was subsequently reattached. This total time was about thirty days. Looking at the issue from the customer’s perspective led the engine repair business to expand its thinking beyond its own walls to incorporate improving the processes of external partners so that the entire process would be faster and more responsive to end-use customers.
Excellent Selection
A fourth dimension of a customer’s value proposition relates to the range of products, merchandise, and services offered to customers. Some companies want to be like supermarkets, offering customers a full range of products and services. Other companies, especially those who wish to offer their customers some of the lowest prices in their industries, recognize that they may not be able to offer every possible product or service and still execute in a superb way. These companies exploit the empirical regularity of Pareto’s Law, in which 20 percent of the possible variety will likely satisfy 80 percent of customers’ demands. Excellent retailers, such as Wal-Mart and Costco, will typically offer less selection than full-line and more expensive retailers. But Wal-Mart and Costco know the top products and brands that most of its customers prefer, supplement these with a lower-price retailer-branded product line, and meet most of its customers’ expectations for consistent quality, low-priced merchandise. Similarly, Southwest Airlines contributes to its low-cost strategy by avoiding congested, expensive airports like Logan Airport in Boston, La Guardia in New York, and Reagan National in Washington, DC. Instead, it offers customers nearby airports—Providence, Rhode Island, and Manchester, New Hampshire, for New England customers; Baltimore for the Washington, DC, area; and Islip, Long Island, for New York customers—that are less convenient for many customers but keep Southwest’s costs down by so much that its lower prices still attract travelers from the high-density urban areas. Also, Southwest avoids the delays typical at congested urban airports, enabling it to offer more reliable departure and arrival times to its customers.
Customer objectives and measures for the value proposition offered by excellent operations management processes can be drawn from the following table:
| Objectives | Measures |
| Lower the customer’s cost; increase the customer’s profit |
|
| Deliver zero-defect products and services to customers |
|
| Deliver products on time | |
| Offer excellent selection |
|
FINANCIAL
Excellence in operations management has a direct connection to the productivity theme in the financial perspective, and an indirect link to the financial perspective’s revenue growth theme (see Figure 3-2). Reductions in the cost of ownership and in the cost of operations and distribution processes should lead directly to improvements in the company’s overall cost structure. Companies that sell relatively homogeneous products strive to have the lowest costs per unit in the industry. These companies typically benchmark their unit costs against competitors.
As companies improve their asset utilization—through better capacity planning, maintenance practices, and process improvements (which allow for more units to be produced with the same physical assets)—they reap benefits in asset productivity, the volume of throughput per unit of fixed asset capacity. Production planning and improved inventory management approaches, combined with optimized supply chains and distribution channels, enable companies to improve their inventory turnover working capital ratios.
The indirect link from improved operations to financial performance occurs as companies improve their price, quality, and delivery performance to customers. Such improvements should result in increased revenues from satisfied customers and opportunities to capture customers from competitors in price-sensitive and value-preferring market segments. A summary of the direct and indirect financial objectives and measures that can be influenced by excellent operations is shown below:
| Objectives | Measures |
| Become the industry cost leader | |
| Maximize use of existing assets |
|
| Increase account share with existing customers |
|
| Increase revenue from new customers |
|
LEARNING AND GROWTH
Linking downward from internal processes to learning and growth objectives, we can identify the competencies, technologies, and organizational climates that foster excellence in managing operations.
Human Capital
Employee competencies in process improvement are foundational for improving operations. Especially important will be employee competencies in total quality management and six sigma. Objectives include increasing the percentage of employees who have achieved various competency levels of total quality management, including percentages that have achieved six sigma “green belt” and “black belt” status.
Information Capital
Technology plays a critical role in improving operational performance. Many repetitive, labor-intensive processes can be automated to provide lower-cost, more consistent quality and more rapid processing times. This is the traditional role for automation. But technology also plays a role in continuous process improvements. Employees need rapid feedback, including detailed, accurate measurements on the products and services they produce and the processes they control. Timely and understandable display of product and process information provides the foundation for more extensive data analysis, root cause analysis, and a whole range of other quality tools that lead to ongoing improvements in cost, quality, and process time.10
Offering customers the ability to track their order status improves the quality of customers’ experiences with the company. FedEx and UPS use technology to continually track a package’s position from the time it leaves a shipper’s hands until it has been received and signed for by the customer. Customers can follow the progress of the package on the distributor’s Web site. Measures on the availability of information for frontline employees about processes, products, services, and customers will be critical for an organization wishing to continuously improve cost, quality, lead time, and customer service.
Technology also lowers the company’s cost of working with its suppliers and the customers’ cost of working with the company. Supply-chain management software can contribute to an operations management objective to reduce the cost of supplier relationships and a customer objective to lower customers’ cost of acquiring products or services.
Organization Capital
Teamwork and Learning
Organizations should not rely on each individual operating unit to devise its own ways of improving process cost, quality, time, and service. Many units throughout the organization generally work on similar problems every day. A critical learning and growth objective, therefore, is to identify innovations and best practices wherever they occur in the organization (or even outside the organization) and to disseminate the best practice rapidly to every organizational unit. Knowledge management systems should be key enablers of such best practice sharing throughout the organization. Measures such as number of new ideas posted or shared and number of new ideas adopted from other organizations will attest to the success of such a learning culture and the capability of the organization’s knowledge management system.11
Culture
Employees must have an intense focus on continuous process improvement and consistent service delivery to customers. Periodic surveys should measure employees’ understanding of the importance of operations management processes and how their daily actions are contributing to making processes better, faster, more responsive, and less expensive. The culture must encourage generating new ideas and solutions for process improvement, and sharing these ideas with other workgroups in the organization. And finally, the culture must overcome the typical “not-invented-here” syndrome that exists in most organizations. Employees must enthusiastically search for new process-improving, customer-service ideas, wherever these ideas arise, inside or outside the organization.
Objectives, measures, and programs in the learning and growth perspective that drive improvements in managing operations are summarized below:
INTEGRATION WITH INITIATIVES TO DRIVE OPERATIONAL EXCELLENCE
We have now described how to formulate objectives and measures for four operations management processes, and how these link upward to customer and financial objectives, and downward to learning and growth objectives. Activity-based management and total quality management are two important initiatives that help employees make fundamental improvements in operating processes.
Activity-Based Management
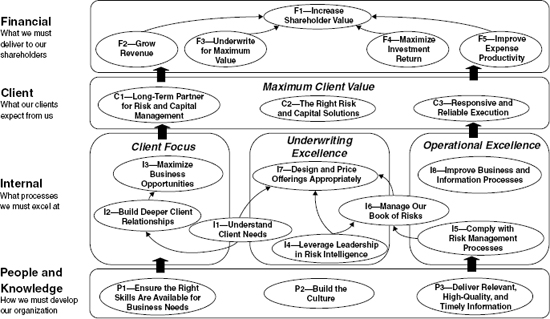
Activity-based costing (ABC) provides an analytic model that represents how individual products and customers use different quantities of the services supplied by indirect and support resources. In the first stage of an ABC model (see Figure 3-4), resource drivers link the expenses of resources supplied (as measured in a company’s general ledger) to the activities and processes performed. Assigning resource expenses to activity and process costs illustrates a powerful link between ABC and the Balanced Scorecard. Cost, quality, and time usually define the performance of any process. Quality and time are relatively easy to measure, since they are based on physical measurements. Cost, however, is an analytic construct, not something tangible that can be measured by a stopwatch or a laser-gauging instrument. Only an ABC model can accurately trace organizational expenses to a procurement, manufacturing, distribution, or delivery process. So a properly constructed ABC model is central to measuring costs in the BSC’s internal perspective.
But knowing the cost of a process is only the first step. Managers and employees must then act to improve the performance of the process. Activity-based management (ABM) encompasses actions that increase efficiency, lower costs, and enhance asset utilization. ABM strives to either increase capacity or lower spending, so that fewer physical, human, and working capital resources are required to generate the firm’s products and services. The financial benefits from ABM can be measured by reduced costs, higher revenues (through better resource utilization), and cost avoidance (because the expanded capacity of existing resources obviates the need for additional investments in capital and people).
Figure 3-4 Activity-Based Costing: From Expense Categories to Activities
Activity-based management yields operational improvements through a five-step process:
- Develop the business case
- Establish priorities
- Provide cost justification
- Track the benefits
- Measure performance for ongoing improvement
1. Develop the Business Case
Managers are often unaware of the many currently available opportunities for cost reduction and improved efficiency of activities and processes. Industrial engineers have focused for decades on improving frontline manufacturing and service operations within existing departments. But until recently, they have not been studying and attempting to improve support activities and processes, nor have they been improving cross-functional activities and business processes. When spending on support activities and processes was small relative to frontline operations, and operations and business processes were simple to understand, such a priority of effort was undoubtedly correct. In today’s organizations, however, an increasing proportion of organizational expenses is associated with indirect and support activities, and the same activity or business process is affected by the actions taken in many different departments and functions. Until recently such activities and processes have not been subjected to process improvement activities.
Typically, collecting ABC process cost information on activities performed reveals to managers how much existing spending occurs in inefficient activities, and in defect-detection and correction activities. For managers who are still skeptical and suspicious about the potential benefits from process improvement, such as total quality management and six sigma programs, such information can provide them with the motivation to launch change initiatives. The activity data will show that while TQM and six sigma may be expensive programs to launch and sustain, the organization is already paying a high price, every day it operates, for inefficiencies and poor quality. To paraphrase an old Henry Ford axiom, “If you need quality process improvements and don’t deploy them, you pay for them without getting them.”
The ABC process cost information also provides the basis for benchmarking, both internally and externally. The use of a standard activity dictionary and data collection process across plants and companies enables the same activity to be compared across multiple organizational units. Awareness that activity costs are out of line with that of other organizational units provides visibility for where a unit should be focusing its process improvements.
In summary, the first benefit from an activity analysis occurs from classifying activity expenses by opportunities for cost improvement. The improvements get realized either by designing entirely new processes or by improving the quality and performance of existing processes. The activity classification enables managers to see how much of their current operating expenses occur in inefficient and low-quality processes. Used in this way, the ABC information provides the front-end insight and motivation for launching continuous and discontinuous improvement programs.
2. Establish Priorities
Many organizations already have the religion for process improvement programs. They therefore do not need the additional data about current spending on inefficient and low-quality activities, obtained during the first step of an ABM project, to become committed to continuous improvement programs. But without the information from an activity analysis effort, the managers may not focus their improvement programs on the activities and business processes with the highest potential payoff. As an example, many organizations have “empowered” their employees and work teams to do continuous improvement or reengineering of their processes. These decentralized employee work teams might accomplish remarkable improvements in their local processes, but without noticeable impact on total organizational spending. Making a process improvement of 50 percent or even 100 percent (by eliminating the need to ever perform the activity) in an activity that consumes less than 0.01 percent of organizational expenses will produce an imperceptible benefit to the organization’s bottom line.
The scarcest resource in an organization is time. Rather than disperse employees’ improvement initiatives across isolated and low-impact processes, managers can direct employees’ efforts to improving activities and processes where the opportunity for substantial cost reduction is highest. The ABC model identifies where the largest opportunities for cost reduction exist. Managers can then use this information to set priorities for process improvement programs that, if successful, will deliver substantial and quantifiable financial benefits to the organization. The ABC information is not the ongoing operational tool for such improvement activities. For that, employees need direct feedback on quality, yield, and cycle time improvements. The ABC model provides the front-end guidance for deciding where process improvement initiatives should be launched.
3. Provide Cost Justification
In the early stages of the Total Quality Management movement, managers were told that “quality was free.”12 While initially skeptical that producing fewer defective items could be accomplished without increasing costs, the experience of both Japanese and U.S. companies with TQM programs soon convinced managers that they previously had been operating at highly inefficient production points. The early years of TQM implementation enabled lots of low-hanging fruit to be picked. Front-end TQM expenditures incurred by having employees focus on process improvement, robust product designs, and ongoing problem-solving and prevention activities were quickly and amply repaid with lower costs for appraisal, repair, rework, and scrap.
Once the early wins with low-hanging fruit have been achieved, however, then further improvements may not always come for free. That is, to get to pick the next level of fruit, someone may have to buy a ladder. Also, the original definition of quality for TQM programs was “conformance to specifications.” Managers strived to produce each item and deliver each service in accordance with the specifications established for that product or service. Once operations and delivery processes had been stabilized so that they could produce consistent output in conformance with specifications, the quality stakes got raised. The definition of quality shifted from conforming to specifications to meeting customers’ expectations. If targeted customers’ expectations for product or service delivery performance exceeded previously established specifications, then the specifications would have to be raised. Even the most ardent TQM advocates would not argue that achieving higher levels of performance, versus adhering to conformance, could be achieved at zero cost.
And reengineering cannot deliver its promises for breakthrough improvements in cost and performance without substantial front-end investments. Reengineering programs are not inexpensive. Many organizations may be understandably reluctant to launch such major and expensive initiatives on faith alone. They will usually want to see a benefits case to justify the heavy commitments of time, energy, and financial resources required for a successful reengineering effort.
To summarize the ABM process, first, managers use the initial activity analysis to identify large amounts of spending in inefficient operations. They and employees can propose projects for which TQM, process improvement, or reengineering could have a major impact. Second, based on the opportunities for cost savings, the managers set priorities about which projects should be done first. Managers and employees have limited time for new initiatives. They should select projects that will have the largest impact and that can be implemented in the shortest time. And third, even though the most desirable projects often come with a hefty front-end price tag, managers can now see a rapid payback from documented cost savings from a process improvement project.
These first three aspects of ABM—identifying process improvement opportunities, setting priorities for these opportunities, and committing resources to realize these benefits—can be done quickly. These steps provide relatively easy, near-term, visible wins without involving people outside the production or operations organization (such as marketing, sales, or engineering).
4. Track the Benefits
Assume that ABM actions have been taken—TQM, process redesign or reengineering—based on the initial activity cost information, as described above. Many organizations, however, never fully realize the benefits from these actions. They improve or change processes, enabling the same output to be achieved with much fewer organizational resources, but they never redeploy or eliminate the resources no longer needed. So organizational expenses remain the same as before.
The ABC model provides information about resource elements—general ledger expense code, assets, and full-time equivalent (FTE) personnel—assigned to an activity. By periodically refreshing and updating the basic ABC model, the organization can reestimate the resources (expenses, assets, and FTEs) deployed for performing activities and business processes. In this way, it can verify whether the operational improvements are yielding actual benefits in terms of reducing resource capacity: fewer assets, fewer people, and lower spending required for the activity. The periodic ABC models provide tangible, documented feedback on whether benefits have been achieved from prior operational improvements, and signal when anticipated benefits have yet to be realized.
5. Measure Performance for Ongoing Improvement
The final aspect of operational ABM links to ongoing and continuous improvement. Managers can define process drivers that help to explain the quantity of resources, and hence the cost, required to perform an activity. For example, an activity such as processing materials through a machine might have, as a process driver, the quality of incoming materials. If incoming materials are out of specifications, or just inside specifications, more time and rework might be required to convert them to finished goods. Another process driver might be the training and skill levels of employees operating the process. Process drivers are local performance indicators that employees can track and improve every day. They are not the strategic measures on the unit’s Balanced Scorecard; they are the operational indicators that measure, motivate, and evaluate daily improvement activities.
Summary
Activity-based management enables managers to get highly visible successes from a simple activity-based costing system. Opportunities for transformation, reengineering, and continuous process improvements get quickly identified and quantified. Learning the cost of each activity or process directs employee and manager attention and helps them to set priorities for attacking the most inefficient and least value-adding activities. The ABC model also provides the benefits case for launching the initiatives by revealing how much is spent each period by continuing to operate inefficiently. Many improvement projects turn out to be self-funding with even substantial front-end costs being rapidly repaid through much more efficient and responsive processes. Subsequent ABC models can track whether anticipated benefits have been achieved in the transformed processes. And process drivers can be defined to direct employees’ attention for ongoing, continuous improvement of the transformed or reengineered process.
Total Quality Management
Many organizations already have well-functioning quality improvement programs.
Strategy maps provide a high-level, strategic context for these quality programs. Strategy maps focus quality programs and make them more effective by aligning them to the organization’s strategic objectives. Let us explore the mutuality of benefits between strategy implementation and quality improvement programs.
Quality Measurement in Strategy Maps
Clearly, measures of process quality are important throughout operations management processes. Quality measures (such as PPM defects, yield, number of inspections) are used for several operations management objectives, such as purchasing, managing supplier relationships, producing goods and services, and distributing to customers. Quality measures also play a prominent role in the value proposition that excellent operating processes deliver to customers. Customer-detected defects, warranty and field service incidents, and on-time delivery all represent quality from the customer’s point of view. So a well-functioning quality measurement program provides critical measurements to internal and customer objectives in most organizations’ strategy maps.
A Strategy Map Enhances Quality Programs
We can identify four different ways in which strategy maps can provide significant value even to companies that are already far along in their TQM/six sigma journey.
1. The BSC provides explicit causal linkages through strategy maps and cascaded objectives. The outcomes from quality programs are often implicit and rarely tested. To build a Balanced Scorecard strategy map, the organization’s strategy must be explicit. The process of building a strategy map—and associated objectives, measures, targets, and initiatives—engages the senior executive team in an intense process that creates consensus, clarity, and commitment to the strategy. The hypotheses underlying the strategy become explicit and testable as data accumulate over time and across similar organizational units.
Some organizations, however, fail to link their quality programs to explicit customer and financial objectives. As an example of a failure from a quality scorecard, consider a crude precursor to our strategy scorecards and strategy maps introduced at Analog Devices in the late 1980s.13 In Analog’s quality scorecard, the customer measures—on-time delivery, lead time, and customer-measured defects—all related to quality, and not to a differentiating value proposition. The Analog scorecard also did not include customer outcome metrics such as acquisition, retention, account share, or market share. The internal process measures focused only on manufacturing measures, and there were no measures relating to customer management and innovation processes. The failure on Analog’s quality scorecard to link quality improvements to a customer value proposition or to any customer outcomes likely contributed to the 67 percent loss in shareholder value that occurred during the first three years that Analog used the scorecard. The disappointing initial results Analog experienced from its quality scorecard are in sharp contrast to the performance breakthroughs that companies have experienced when using a properly constructed strategy scorecard.14
Quality models can be local, tactical, and unlinked. The strategy map, in contrast, captures strategic objectives and only then identifies the initiatives and process improvements needed to support strategic objectives. As one executive has noted:
The BSC provided a unity and focus to our TQM efforts, and also to our annual and long-range planning. We had a lot of teams doing a lot of things, but the efforts were ad hoc. The BSC brought this all together into a unified systematic approach. Now when we assign responsibilities to departments, we do it within a framework.
2. The BSC establishes targets for breakthrough performance not merely to match existing best practices. Many quality programs evaluate their internal process performance against benchmarked best practice and focus as a result on continuous improvement. In contrast, target-setting with the Balanced Scorecard starts with aspirations for radical performance breakthroughs in financial and customer outcome measures. Balanced Scorecard companies expect to become the benchmarks for others. The targets for near-term performance are determined not by individual process benchmarks, but by what the organization must achieve in the short run to remain on a trajectory to longer-term performance breakthroughs. The targets for breakthrough financial and customer outcome performance get broken down into stretch targets for customer satisfaction and retention, internal process performance, and human resource and information technology capabilities and organizational alignment. Thus the targets for all BSC measures are linked together to drive breakthrough performance on high-level objectives. To be sure, quality programs’ disciplined approach to benchmarking will be useful for BSC programs by helping organizations bring their substandard processes at least up to competitive levels.
3. The BSC often identifies entirely new processes that are critical for achieving strategic objectives. Quality models strive to improve existing organizational processes, making them better, faster, and cheaper. But applying the Balanced Scorecard principles, particularly when implementing a new strategy, often reveals entirely new processes at which an organization must excel. For example, one company was shifting from a low-cost strategy to a differentiated customer intimacy strategy. A critical process for the new strategy was to work closely with targeted customers to anticipate their future needs. The company had never done such a process before. With the previous strategy, it waited until the customer asked for a bid on a project and then responded. In a financial services company undergoing a similar shift in strategy, frontline employees had to be retrained from reactive transaction processors to proactive financial planners. With only a quality measurement model, employees could have scored high on performance related to speedy, responsive, and zero-defect processing of customer transactions. But this process, which would soon be automated, was no longer critical for the new customer relationship strategy. Instead, employees would have to excel at an entirely new set of processes: anticipating and understanding customers’ emerging financial needs, developing deep knowledge of new financial products and services, and developing capabilities for customizing and selling financial products and services to individual customer needs. The BSC’s high-level strategy deployment process easily identified the criticality of these new processes, and the reduced emphasis that should be placed on transaction processing. Once new strategically vital processes have been identified, quality programs can then be deployed to improve the performance of these processes.
4. The BSC sets strategic priorities for process enhancements. Even without the strategic need to introduce entirely new processes into the organization, companies still need to assess priorities. Some processes are more essential to strategic success than others. Benchmarking can provide an assessment of all an organization’s processes by comparing them to industry best practice. Resources get committed to processes that have been identified as falling short of best practice. This allocation process, however, occurs independently of strategic priorities. The Balanced Score-card, in contrast, identifies which processes must perform at or beyond current best practice levels, and which processes are less critical for strategic success. The BSC provides the guidance for organizations to redeploy their scarce resources of people and funds away from nonstrategic process improvements and toward those processes and initiatives most critical for implementing the strategy.
Of course, once organizations have identified their most critical and essential processes, they can apply quality management principles to enhance them. The self-assessment helps to identify the level of process investment required and the time required for the Balanced Scorecard to achieve targeted performance.
Reengineering: Discontinuous Process Improvement
Quality programs are often referred to as “continuous improvement” programs. Sometimes, however, existing processes are so inefficient or technologically obsolete that continuous improvements will not be sufficient to achieve the targeted performance. In these cases, organizations can sensibly abandon their traditional quality management tools and instead embark on a program of reengineering or discontinuous improvement.15 The Balanced Scorecard enhances reengineering programs in the same manner as it does quality programs. It places reengineering programs in a strategic context linked to high-level organizational outcomes, it establishes performance targets (frequently nonfinancial ones) for the outputs from reengineering programs, and it sets priorities for where reengineered processes will have the highest impact on organizational performance.
Summary of Linkages Between Strategy Maps and Improvement Programs
A properly developed strategy map provides strategic focus to activity-based management and quality management programs. It embeds these improvement programs within a strategic framework that provides clear line-of-sight impact from process improvements to important organizational outcomes. We believe that each model—quality management and strategy maps—adds a useful dimension to the other. In using the two together, a management team leverages the knowledge and insights from each approach.
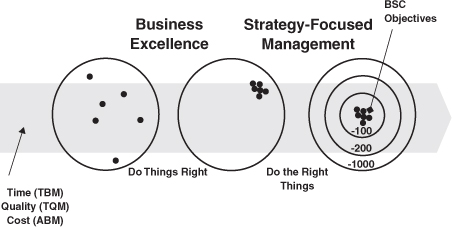
The continuous improvement from ABM and TQM programs helps organizations lower the cost of their processes and make these processes more consistent and more responsive. By avoiding defects, inefficiencies, and delays, organizations do things the right way. Strategy maps and the Balanced Scorecard focus an organization’s improvement programs on the internal processes that will have the greatest impact on successful strategy execution. Strategy maps focus organizational processes to do the right things. Combining improvement programs with strategy maps enables companies to do the “right things right” (see Figure 3-5). Both sets of management tools clearly have their place for organizations wanting to achieve performance breakthroughs.
SUMMARY
In this chapter, we have reviewed the cluster of operations management processes that produce and deliver the organization’s products and services. We have identified objectives and measures for operational excellence in processes that:
- Establish excellent supplier relationships and lower the total cost of purchasing goods and services
- Produce existing products and services for today’s customers
- Distribute and deliver products and services to customers
- Manage operating and business risk
We have shown how important organizational improvement programs, such as activity-based management and quality management, are vital for helping organizations to improve the cost, quality, and responsiveness of their critical operations management processes.
Figure 3-5 Business Excellence in Two Steps: Combining Business Excellence and Strategy-Focused Management Allows Organizations to Do the Right Things Right
In the case study following this chapter, we discuss the strategy map of Thornton Oil. Thornton, which operates a chain of gasoline and convenience stores, used the development of a strategy map and Balanced Score-card to drive dramatic improvements in operating processes so that it could become more competitive against recent entrants—including Wal-Mart, Meijer, Costco, and Kroger—to its business.
NOTES
1. Michael Porter, “What Is Strategy?” Harvard Business Review (November–December 1996): 61–64.
2. Robert S. Kaplan and Robin Cooper, Cost and Effect: Using Integrated Cost Systems to Drive Profitability and Performance (Boston: Harvard Business School Press, 1998), 203–210.
3. See the appendix to Chapter 5, “Internal Business Process Perspective,” in Robert S. Kaplan and David P. Norton, The Balanced Scorecard: Translating Strategy into Action (Boston: Harvard Business School Press, 1996), 116–120, for a discussion of typical cost, quality, and cycle time measures for operating processes.
4. Cycle time is the total time required from the start of production to completion of outputs. Process time represents the time actually required for processing, excluding waiting, movement, and setup times. For example, the cycle time for mortgage approval could be twenty-eight days, but with only forty minutes of actual processing time during the twenty-eight-day time period.
5. Equipment utilization and reliability objectives are most critical for bottleneck resources. See Eliyahu M. Goldratt and Jeff Cox, The Goal: A Process of Ongoing Improvement (Croton-on-Hudson, NY: North River Press, 1986).
6. L. Meulbroek, “A Senior Manager’s Guide to Integrated Risk Management,” Journal of Applied Corporate Finance (Winter 2002): 56–70.
7. B. Schlender, “The Bill & Warren Show,” Fortune, 20 July 1998.
8. K. Froot, D. Scharfstein, and J. Stein, “A Framework for Risk Management,” Harvard Business Review (November–December 1994).
9. Targeted values for the managing financial risk measures are unlikely to be zero. Some amount of risk is desirable since hedging is expensive, and selling to only the most creditworthy customers will sacrifice much in potential sales.
10. See Robert S. Kaplan, “Texas Eastman Company,” Case 9-190-039 (Boston: Harvard Business School, 1989) for an innovative example of how advanced information technology can drive daily process quality and cost improvements.
11. M. T. Hansen, N. Nohria, and T. Tierney, “What’s Your Strategy for Managing Knowledge?” Harvard Business Review (March–April 1999): 106–116.
12. Philip B. Crosby, Quality Is Free (New York: McGraw-Hill, 1979).
13. Robert S. Kaplan, “Analog Devices: The Half-Life System,” Case 9-190-061 (Boston: Harvard Business School, 1989).
14. Success stories from use of the Balanced Scorecard appear in Chapter 1 of Kaplan and Norton, The Strategy-Focused Organization. These experiences and others are documented in the Balanced Scorecard Hall of Fame, accessed at <http://www.bscol.com>.
15. Michael Hammer and James A. Champy, Reengineering the Corporation: A Manifesto for Business Revolution (New York: HarperBusiness, 1993).
CASE STUDY
THORNTON OIL CORPORATION
Background
Founded in 1971 by James H. Thornton, Kentucky-based Thornton Oil Corporation established a chain of convenience-store gas stations that ultimately grew to 140 units in nineteen states, and recorded annual revenues exceeding $700 million. Still family-owned, the company ranks among the five hundred largest privately held firms in the United States.
Things haven’t always been so rosy for this mom-and-pop chain turned major enterprise. In 1998, the president and CEO left the company owing to a commodities trading scandal. Later that fall, the company named Rick Claes, a twelve-year veteran of Thornton’s real-estate and construction division, the new chief executive. To meet his goal—aggressively growing the business—Claes knew that the company would have to address some big problems: a focus on short-term profitability; a lack of clear-cut strategy; a stifling command-and-control management style; and a poorly trained workforce plagued by internecine competition and lack of trust. Equally worrisome, Thornton faced stiffening external competition in the form of convenience-store gas stations launched by discount retail giants Wal-Mart, Kroger, and Costco. With rivals closing in, the new CEO was well aware that Thornton would have trouble maintaining its already slim gasoline profit margins. Clearly, something had to change.
The Strategy
The company decided to begin its transformation by clarifying its vision: to become a $1 billion company by 2005. Then it outlined a strategy for fulfilling this vision: Expand the convenience-store arm of the business, since profit margins from selling gasoline were notoriously meager. Expanding the convenience-store business, in turn, would hinge on customer intimacy: getting to know precisely who wandered into Thornton stores, what they bought, and what it would take to entice new customers into the fold. Thornton settled on a core theme of marketing excellence and growing its food franchise.
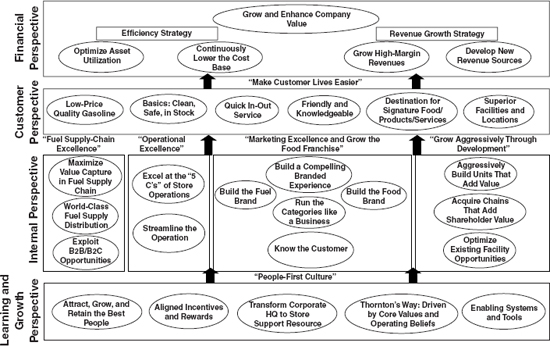
The Strategy Map
In the company’s strategy map, the logic of Thornton’s new strategy traveled inexorably through the four perspectives (see Figure 3-6). Some highlights from the map:
- Customer perspective: Success in growing the food franchise would lead directly to success in another key theme: making customers’ lives easier. Five objectives related to providing customers with a low-cost shopping experience, including:
- Low-price, quality gasoline
- Basics: clean, safe, in stock
- Quick in-out service
- Friendly and knowledgeable store employees
- Stores in locations easy for customers to access
In addition, beyond providing these fundamentals, Thornton adopted a merchandising selection objective that would make its stores “destinations for signature food, products, and services.” Simply put, the company wanted customers to head for Thornton’s whenever they had a yen for a particular snack food, beverage, or other essential item. In the past, the firm had partnered with Dunkin’ Donuts’s parent company to install donut-and-coffee shops in many of its stores. Now it set out to develop its own brand items; for example, Thornton’s coffee and pastries. Thus, Thornton wanted to excel at providing customers with the right selection and availability of differentiated food, products, and services.
- Internal processes perspective: Thornton had two themes for delivering a low-cost customer buying experience. The theme of fuel supply-chain excellence had three objectives related to lowering the cost of acquiring fuel to sell to customers. One of these was to “exploit B2B/B2C opportunities,” which entailed using the Internet to buy and sell oil among smaller gas stations. The operational excellence theme stressed “excelling at the ‘5 C’s’ of store operations” (such as cleanliness, customer service, and coaching) and improving store operating processes. In addition, finding new customers who would value the Thornton buying experience identified a theme of growing the food franchise. Internal processes included “knowing customers”—that is, identifying customer segments such as lunch-only shoppers, lunch-and-dinner buyers, gas-and-food customers, and finding ways to create new segments. Finally, the theme of growing aggressively through development included the objective to “optimize existing facility opportunities”; for example, improving selection by brainstorming new services to add to each store.
- Learning and growth perspective: To tap the intangible asset of employee knowledge and commitment essential to fulfilling its strategy, Thornton identified the key theme of establishing a “people-first culture.” Related objectives included “transforming company headquarters from a command-and-control center to a support resource” for store managers and employees. In the past, headquarters had merely dictated decrees down to the stores. Now, it had to focus on understanding and meeting store personnel’s needs.
- To further support the “people first” theme, the company defined the “Thornton’s Way” objective—ensuring that the firm was “driven by core values and operating beliefs.” Finally, to replace its antiquated communication systems, Thornton added the objective “enabling systems and tools,” which sparked the adoption of a new, more efficient e-mail system that made it possible for employees and managers to communicate.
- Financial perspective: If all went according to plan in the preceding perspectives, Thornton expected to see hard-core financial results. This perspective’s twin themes of efficiency and revenue growth were backed by four financial objectives: optimize asset utilization, continuously lower the cost base, maximize high-margin revenues, and develop new revenue sources.
Figure 3-6 Thornton’s: A Compelling Place to Work, Shop, and Invest
Results
By clarifying, communicating, and evaluating progress toward its strategy through the Balanced Scorecard, Thornton achieved impressive results.1 The company’s emphasis on the customer perspective led to an increase of 44 percent in customer-service scores. Mystery-shopper scores—measures provided by secret shoppers hired to ask yes/no questions about store standards such as cleanliness—rose 14 percent. Total operating expenses were under or at budget every month. Thornton employees were clearly happier as well—as evidenced by a 48 percent reduction in total turnover and a 62 percent decrease in recruiting expenses.
_______________
Case prepared by Patricia Bush of Balanced Scorecard Collaborative, and Lauren Keller Johnson, a Balanced Scorecard Report contributor. Our thanks to Rick Claes and his colleagues for sharing the Thornton Oil Corporation experience.
NOTE
1. As a private company, Thornton Oil’s actual financial results and improvement are unavailable.