C H A P T E R T W O
STRATEGY MAPS
STRATEGY DESCRIBES how an organization intends to create sustained value for its shareholders.1 In Chapter 1, we documented how organizations today must leverage their intangible assets for sustainable value creation. Creating value from intangible assets differs in several important ways from creating value by managing tangible physical and financial assets:
- Value creation is indirect. Intangible assets such as knowledge and technology seldom have a direct impact on financial outcomes such as increased revenues, lowered costs, and higher profits. Improvements in intangible assets affect financial outcomes through chains of cause-and-effect relationships. For example, employee training in total quality management (TQM) and six sigma techniques can directly improve process quality. Such improvement can then be expected to lead to improved customer satisfaction, which, in turn, should increase customer loyalty. Ultimately, customer loyalty leads to improved sales and margins from long-term customer relationships.
- Value is contextual. The value of an intangible asset depends on its alignment with the strategy. For example, training employees in TQM and six sigma techniques has greater value for organizations following a low total cost strategy than for one following a product leadership and innovation strategy.
- Value is potential. The cost of investing in an intangible asset represents a poor estimate of its value to the organization. Intangible assets, like employees trained in statistical quality control and root cause analysis, have potential value but not market value. Internal processes such as design, production, delivery, and customer service are required to transform the potential value of intangible assets into tangible value. If the internal processes are not directed at the customer value proposition or financial improvements, then the potential value of employee capabilities, and intangible assets in general, will not be realized.
- Assets are bundled. Intangible assets seldom create value by themselves. They do not have a value that can be isolated from organizational context and strategy. The value from intangible assets arises when they are combined effectively with other assets, both tangible and intangible. For example, quality training is enhanced when employees have access to timely, detailed data from process-oriented information systems. Maximum value is created when all the organization’s intangible assets are aligned with each other, with the organization’s tangible assets, and with the strategy.
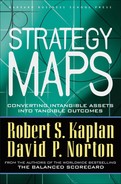
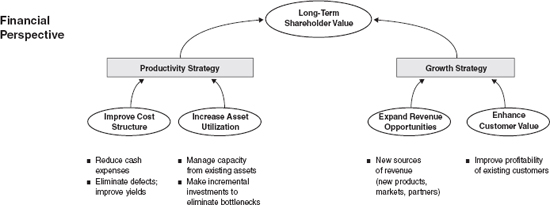
The Balanced Scorecard strategy map (see Figure 2-1), provides a framework to illustrate how strategy links intangible assets to value-creating processes. The financial perspective describes the tangible outcomes of the strategy in traditional financial terms. Measures such as ROI, shareholder value, profitability, revenue growth, and cost per unit are the lag indicators that show whether the organization’s strategy is succeeding or failing. The customer perspective defines the value proposition for targeted customers. The value proposition provides the context for the intangible assets to create value. If customers value consistent quality and timely delivery, then the skills, systems, and processes that produce and deliver quality products and services are highly valuable to the organization. If the customer values innovation and high performance, then the skills, systems, and processes that create new products and services with superior functionality take on high value. Consistent alignment of actions and capabilities with the customer value proposition is the core of strategy execution.
The financial and customer perspectives describe the desired outcomes from the strategy. Both perspectives contain many lag indicators. How does the organization create these desired outcomes? The internal process perspective identifies the critical few processes that are expected to have the greatest impact on the strategy. For example, one organization may increase its internal R&D investments and reengineer its product development processes so that it can develop high-performance, innovative products for its customers. Another organization, attempting to deliver the same value proposition, might choose to develop new products through joint-venture product partnerships.
Figure 2-1 The Balanced Scorecard Framework
The learning and growth perspective identifies the intangible assets that are most important to the strategy. The objectives in this perspective identify which jobs (the human capital), which systems (the information capital), and what kind of climate (the organization capital) are required to support the value-creating internal processes. These assets must be bundled together and aligned to the critical internal processes.
The objectives in the four perspectives are linked together by cause-and-effect relationships. Starting from the top is the hypothesis that financial outcomes can be achieved only if targeted customers are satisfied. The customer value proposition describes how to generate sales and loyalty from targeted customers. The internal processes create and deliver the customer value proposition. And intangible assets that support the internal processes provide the foundation for the strategy. Aligning objectives in these four perspectives is the key to value creation and, hence, to a focused and internally consistent strategy.
This architecture of cause and effect, linking the four perspectives, is the structure around which a strategy map is developed. Building a strategy map forces an organization to clarify the logic of how it will create value and for whom. In this chapter, we will describe the principles involved in building a strategy map.
STRATEGY IS A STEP IN A CONTINUUM
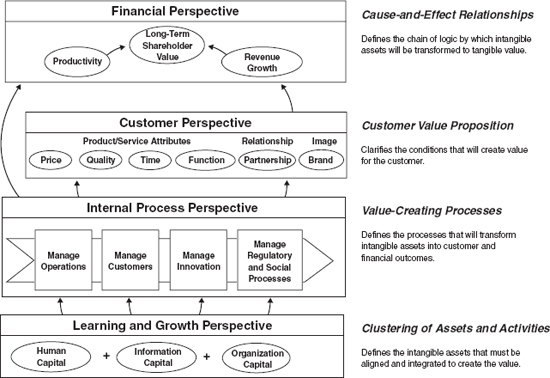
Strategy is not a stand-alone management process; it is one step in a logical continuum that moves an organization from a high-level mission statement to the work performed by frontline and back-office employees. Figure 2-2 presents a framework that we have found effective in practice.
The overarching mission of the organization provides the starting point by defining why the organization exists or how a business unit fits within a broader corporate architecture. The mission and the core values that accompany it remain fairly stable over time. The organization’s vision paints a picture of the future that clarifies the organization’s direction and helps individuals understand why and how they should support the organization. In addition, the vision sets the organization in motion, from the stability of the mission and core values to the dynamics of strategy, the next step in the continuum. Strategy is developed and evolves over time to meet the changing conditions posed by the external environment and internal capabilities.
Figure 2-2 The Balanced Scorecard Is a Step in a Continuum That Describes What Value Is and How It Is Created
Most organizations already have mission and vision statements. While the exact definitions of mission and vision can vary, the following provide helpful guidelines:
Mission. A concise, internally focused statement of the reason for the organization’s existence, the basic purpose toward which its activities are directed, and the values that guide employees’ activities. The mission should also describe how the organization expects to compete and deliver value to customers. Below are examples of the mission statements of two quite different organizations:
Ben & Jerry’s Mission Statement
Ben & Jerry’s is dedicated to the creation and demonstration of a new corporate concept of linked prosperity. Our mission consists of three interrelated parts.
Product. To make, distribute, and sell the finest quality, all-natural ice cream and related products in a wide variety of innovative flavors made from Vermont dairy products.
Economic. To operate the Company on a sound financial basis of profitable growth, increasing value for our shareholders, and creating career opportunities and financial rewards for our employees.
Social. To operate the Company in a way that actively recognizes the central role that business plays in the structure of society by initiating innovative ways to improve the quality of life of a broad community—local, national, and international.
City of Charlotte Mission Statement
The mission of the City of Charlotte is to ensure the delivery of quality public services that promote the safety, health and quality of life of its citizens. Charlotte attempts to identify and respond to community needs and focus on the customer through:
- Creating and maintaining effective partnerships
- Attracting and retaining skilled motivated employees
- Using strategic business planning
Vision. A concise statement that defines the mid- to long-term (three- to ten-year) goals of the organization. The vision should be external and market-oriented and should express—often in colorful or “visionary” terms—how the organization wants to be perceived by the world.
City of Charlotte Vision
The City of Charlotte will be a model of excellence that puts its citizens first. Skilled, motivated employees will be known for providing quality and value in all areas of service. We will be a platform for vital economic activity that gives Charlotte a competitive edge in the marketplace. We will partner with citizens and businesses to make Charlotte a community of choice for living, working, and leisure activities.
Financial Service Company Vision
We will become the respected leader in financial services with a focus on seamless customer relationships and satisfaction, producing financial returns in the top quartile of the industry.
Mission and vision statements set the general goals and direction for the organization. They help shareholders, customers, and employees understand what the company is about and what it intends to achieve. But these statements are far too vague to guide day-to-day actions and resource allocation decisions. Companies make their mission and vision statements operational when they define a strategy for how the mission and vision will be achieved.
Strategy. The strategy literature is uncommonly diverse. Scholars and practitioners have very different frameworks for strategy and don’t even agree on its definition.2 While strategy maps and Balanced Scorecards can be developed for any strategic approach, we base our approach on the general framework articulated by Michael Porter, a founder and outstanding leader in the strategy field. Porter argues that strategy is about selecting the set of activities in which an organization will excel to create a sustainable difference in the marketplace. The sustainable difference can be to deliver greater value to customers than competitors, or to provide comparable value but at lower cost than competitors. He states, “Differentiation arises from both the choice of activities and how they are performed.”3 We will provide specific examples of such strategies when we discuss the value proposition the organization selects to deliver for its customers.
With this brief background on establishing high-level direction—mission, vision, and strategy—for the organization, we can now develop the role for the strategy map to provide the needed specificity for statements of high-level direction to become more meaningful and actionable for all employees. We start with the financial perspective of the strategy map and work successively through the customer, internal, and learning and growth perspectives.
Financial Perspective: Strategy Balances Contradictory Forces—Long-Term Versus Short-Term
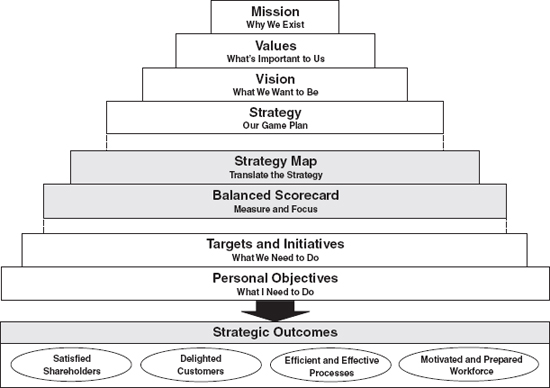
The BSC retains the financial perspective as the ultimate objective for profit-maximizing companies.4 Financial performance measures indicate whether the company’s strategy, including its implementation and execution, are contributing to bottom-line improvement. Financial objectives typically relate to profitability—measured, for example, by operating income and return on investment. Basically, financial strategies are simple; companies can make more money by (1) selling more, and (2) spending less. Everything else is background music. Any program—customer intimacy, six sigma quality, knowledge management, disruptive technology, just-in-time—creates more value for the company only if it leads to selling more or spending less. Thus, the company’s financial performance gets improved through two basic approaches—revenue growth and productivity (see Figure 2-3).
Companies can generate profitable revenue growth by deepening relationships with existing customers. This enables them to sell more of their existing product or service, or additional products and services. For example, banks can attempt to get their checking account customers to also use a credit card issued by the bank, and to borrow from the bank to purchase a home or car.
Companies can also generate revenue growth by selling entirely new products. For example, Amazon.com now sells CDs and electronic equipment in addition to books; Mobil encourages its customers to buy from its stations’ convenience stores in addition to filling their cars with gasoline. Companies can also expand revenues by selling to customers in entirely new segments—for example, Staples now sells to small businesses as well as to retail customers—and in new markets, such as by expanding from domestic sales to international sales.
Productivity improvements, the second dimension of a financial strategy, also can occur in two ways. First, companies reduce costs by lowering direct and indirect expenses. Such cost reductions enable a company to produce the same quantity of outputs while spending less on people, materials, energy, and supplies. Second, companies, by utilizing their financial and physical assets more efficiently, reduce the working and fixed capital needed to support a given level of business. For example, through just-in-time approaches, companies can support a given level of sales with less inventory. By reducing unscheduled downtime on equipment, companies can produce more without increasing their investments in plant and equipment.
Figure 2-3 The Financial Perspective Provides the Tangible Definition of Value
The link to strategy in the financial perspective arises as organizations choose a balance between the often contradictory levers of growth and productivity. Actions to improve revenue growth generally take longer to create value than actions to improve productivity. Under the day-to-day pressure to show financial results to shareholders, the tendency is to favor the short term over the long term. Developing the first layer of the strategy map forces the organization to deal with this tension. The overarching financial objective is, and must be, to sustain growth in shareholder value. Thus, the financial component of the strategy must have both long-term (growth) and short-term (productivity) dimensions. The simultaneous balancing of these two forces is the organizing framework for the remainder of the strategy map.
Customer Perspective: Strategy Is Based on a Differentiated Value Proposition
The revenue growth strategy requires a specific value proposition, in the customer perspective, that describes how the organization will create differentiated, sustainable value to targeted segments. In the customer perspective of the strategy map, managers identify the targeted customer segments in which the business unit competes and the measures of the business unit’s performance for customers in these targeted segments. The customer perspective typically includes several common measures of the successful outcomes from a well-formulated and implemented strategy (see Figure 2-4):
- Customer satisfaction
- Customer retention
- Customer acquisition
- Customer profitability
- Market share
- Account share5
Figure 2-4 Customer Perspective: Creating a Sustainable Differentiated Value Proposition Is the Heart of Strategy
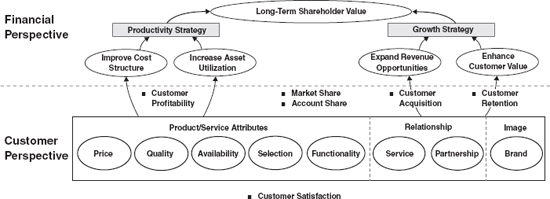
These common customer outcome measures can themselves be viewed in cause-and-effect relationships. For example, customer satisfaction generally leads to customer retention and, through word of mouth, the acquisition of new customers. By retaining customers, the company can increase the share of business—the account share—it does with its loyal customers. Combining customer acquisition and increased business done with existing customers, the company should increase its overall market share with targeted customers. Finally, retention of customers should lead to increases in customer profitability, since retaining a customer typically costs much less than acquiring new or replacement customers.
Virtually all organizations try to improve these common customer measures, but merely satisfying and retaining customers is hardly a strategy. A strategy should identify specific customer segments that the company is targeting for growth and profitability. For example, Southwest Airlines offers low prices to satisfy and retain price-sensitive customers. Neiman Marcus, on the other hand, targets customers with high disposable incomes who are willing to pay more for high-end merchandise. Companies should measure satisfaction, retention, and market share with their targeted customers. Price-sensitive customers with low disposable incomes are not likely to be very satisfied with the shopping experience at Neiman Marcus, and business travelers with generous expense accounts typically do not seek out a Southwest Airlines flight because of its long lines and lack of reserved seats and first-class cabins.
Once the company understands who its targeted customers are, it can identify the objectives and measures for the value proposition it intends to offer. The value proposition defines the company’s strategy for the customer by describing the unique mix of product, price, service, relationship, and image that a company offers its targeted group of customers. The value proposition should communicate what the company expects to do for its customers better or differently than its competitors.
For example, companies as diverse as Southwest Airlines, Dell, Wal-Mart, McDonald’s, and Toyota have been extremely successful by offering customers the best buy or lowest total cost in their categories. The objectives for a low total cost value proposition should emphasize attractive prices, excellent and consistent quality, short lead times, ease of purchase, and good selection (see the top row in Figure 2-5).
Another value proposition, followed by companies such as Sony, Mercedes, and Intel, emphasizes product innovation and leadership. These companies command high prices, above the average in their categories, because they offer products with superior functionality. The objectives for their value propositions would emphasize the particular features and functionalities of the products that leading-edge customers value and are willing to pay more to receive. The objectives could be measured by speed, size, accuracy, power consumption, or other performance characteristics that exceed the performance of competing products and that are valued by customers. Being the first-to-market with new features and functionality is another objective for such product leadership companies (see the second row in Figure 2-5).
Figure 2-5 Customer Objectives for Different Value Propositions
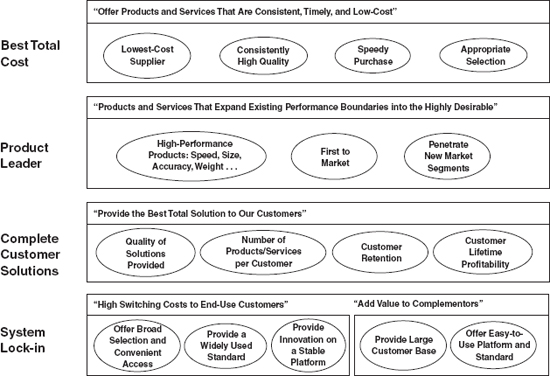
A third type of value proposition stresses the provision of complete customer solutions. Good examples of companies successfully delivering this value proposition are IBM and Goldman Sachs. For this value proposition, customers should feel that the company understands them and is capable of providing them with customized products and services tailored to their needs. IBM, when it dominated the computer industry, did not offer the lowest prices and only rarely delivered its new products on time. Nor were IBM’s products the most advanced technologically, the most powerful, or the fastest. But IBM offered information technology executives, its targeted customers, complete solutions—hardware, software, installation, field service, training, education, and consulting—that were tailored to each organization’s needs. Companies offering such a customer solutions value proposition stress objectives relating to the completeness of the solution (selling multiple, bundled products and services), exceptional service, both before and after the sale, and the quality of the relationship (see the third row in Figure 2-5).
A fourth generic strategy, called lock-in, arises when companies create high switching costs for their customers. Ideally, a proprietary product, such as a computer operating system or microchip hardware architecture, becomes the standard for the industry.6 In this case both buyers and sellers want their products to be consistent with the standard to benefit from the large network of users and complementors who use it. Becoming a dominant exchange, such as eBay and the Yellow Pages, is another example of a successful lock-in strategy. Buyers will choose an exchange where the largest number of sellers offers their products or services; and sellers will offer their products and services on an exchange that exposes them to the largest number of potential buyers. In this situation, one or two companies will tend to be dominant suppliers of the exchange, and they will create large barriers to entry for other exchange providers and high switching costs to its buyers and sellers (see the bottom row in Figure 2-5).
The objectives and measures for a particular value proposition define an organization’s strategy. By developing objectives and measures that are specific to its value proposition, the organization translates its strategy into tangible measures that all employees can understand and work toward improving.
Internal Perspective: Value Is Created Through Internal Business Processes
Objectives in the customer perspective describe the strategy—the targeted customers and value proposition—and the objectives in the financial perspective describe the economic consequences from a successful strategy—revenue and profit growth and productivity. Once an organization has a clear picture of these financial and customer objectives, the objectives in the internal and learning and growth perspectives describe how the strategy will be accomplished. The organization manages its internal processes and its development of human, information, and organization capital to deliver the differentiating value proposition of the strategy. Excellent performance in these two perspectives drives the strategy.
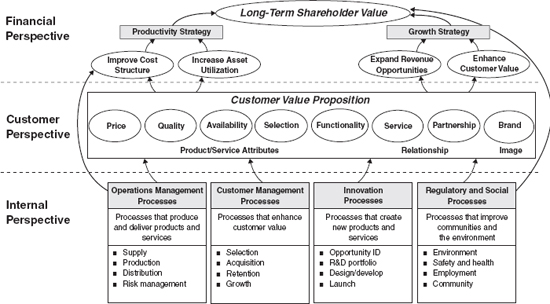
Internal processes accomplish two vital components of an organization’s strategy: (1) they produce and deliver the value proposition for customers, and (2) they improve processes and reduce costs for the productivity component in the financial perspective. We group organizations’ myriad internal processes into four clusters (see Figure 2-6):
- Operations management processes
- Customer management processes
- Innovation processes
- Regulatory and social processes
Operations Management Processes
Operations management processes are the basic, day-to-day processes by which companies produce their existing products and services and deliver them to customers. Operations management processes of manufacturing companies include the following:
- Acquire raw materials from suppliers
- Convert raw materials to finished goods
- Distribute finished goods to customers
- Manage risk
Operating processes for service companies produce and deliver the services used by customers.
Figure 2-6 Internal Processes Create Value for Customers and Shareholders
Customer Management Processes
Customer management processes expand and deepen relationships with targeted customers. We can identify four sets of customer management processes:
- Select targeted customers
- Acquire the targeted customers
- Retain customers
- Grow business with customers
Customer selection involves identifying the target populations for which the company’s value proposition is most desirable. A customer selection process defines a set of customer characteristics that describes an attractive customer segment for the company. For consumer companies, segments can be defined by income, wealth, age, family size, and lifestyle; typical business customer segments are price-sensitive, early adopting, and technically sophisticated. Customer acquisition relates to generating leads, communicating to new potential customers, choosing entry-level products, pricing the products, and closing the sale. Customer retention is a result of excellent service and responsiveness to customer requests. Timely, knowledgeable service units are critical for maintaining customer loyalty and reducing the likelihood of customer defections. Growing a customer’s business with the company involves managing the relationship effectively, cross-selling multiple products and services, and becoming known as a trusted adviser and supplier.
Innovation Processes
Innovation processes develop new products, processes, and services, often enabling the company to penetrate new markets and customer segments. Managing innovation includes four sets of processes:
- Identify opportunities for new products and services
- Manage the research and development portfolio
- Design and develop the new products and services
- Bring the new products and services to market
Product designers and managers generate new ideas by extending the capabilities of existing products and services, applying new discoveries and technologies, and learning from the suggestions of customers. Once ideas for new products and services have been generated, managers must decide which projects to fund and which will be developed entirely with internal resources, which done collaboratively in a joint venture, and which will be licensed from another organization or outsourced entirely. The design and development process, the core of product development, brings new concepts to market. A successful design and development process culminates in a product that has the desired functionality, is attractive to the targeted market, and can be produced with consistent quality and at a satisfactory profit margin. At the conclusion of the product development cycle, the project team brings the new product to market. The innovation process, for a particular project, concludes when the company achieves targeted levels of sales and production at specified levels of product functionality, quality, and cost.
Regulatory and Social Processes
Regulatory and social processes help organizations continually earn the right to operate in the communities and countries in which they produce and sell. National and local regulations—on the environment, on employee health and safety, and on hiring and employment practices—impose standards on companies’ practices. Many companies, however, seek to go beyond complying with the minimal standards established by regulations. They wish to perform better than the regulatory constraints so that they develop a reputation as an employer of choice in every community in which they operate.
Companies manage and report their regulatory and social performance along a number of critical dimensions:
- Environment
- Safety and health
- Employment practices
- Community investment
Investing in the environment, health, safety, employment practices, and community development need not be for altruistic reasons alone. An excellent reputation for performance along regulatory and social dimensions assists companies in attracting and retaining high-quality employees, thereby making human resource processes more effective and efficient. Also, reducing environmental incidents and improving employee safety and health improves productivity and lowers operating costs. And last, companies with outstanding reputations generally enhance their images with customers and with socially conscious investors. All these linkages—to enhanced human resource, operations, customer, and financial processes—illustrate how effective management of regulatory and community performance can drive long-term shareholder value creation.
STRATEGY CONSISTS OF SIMULTANEOUS COMPLEMENTARY THEMES
In developing the internal perspective of their strategy map, managers identify the processes that are the most important for their strategies. Companies following a product leadership strategy would stress excellence in their innovation processes; companies following a low total cost strategy must excel at operating processes; and companies following a customer solutions strategy will emphasize their customer management processes.
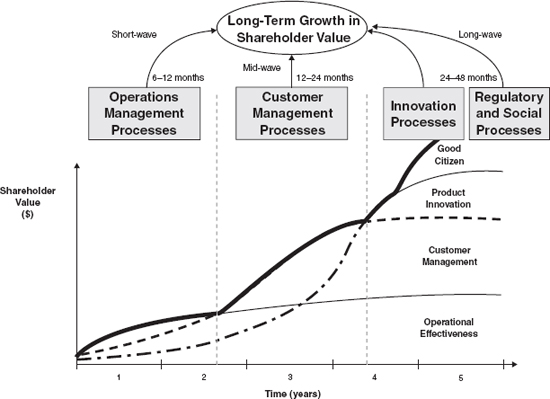
But even with an emphasis on one of the four clusters of internal processes, companies must still follow a “balanced” strategy and invest in improving processes in all four clusters. Typically, the financial benefits from improvements to the processes in the four internal perspective themes occur over different time periods (see Figure 2-7). Cost savings from improvements in operational processes deliver quick benefits (within six to twelve months). Revenue growth from enhancing customer relationships accrues in the intermediate term (twelve to twenty-four months). Innovation processes generally take longer to produce revenue and margin improvements (say, twenty-four to forty-eight months). The benefits from regulatory and social processes also typically take longer to capture as companies avoid litigation and shutdowns, and enhance their image as an employer and supplier of choice in every community in which they operate.
There are literally hundreds of processes taking place simultaneously in an organization, each creating value in some way. The art of strategy is to identify and excel at the critical few processes that are the most important to the customer value proposition. All processes should be managed well, but the few strategic processes must receive special attention and focus since these processes create the differentiation of the strategy. The selected strategic processes should also be drawn from all four clusters. Every strategy should identify one or more processes within operations management, customer management, innovation, and regulatory and social. In this way, the value creation process is balanced between the short and long term. This ensures that the growth in shareholder value will be sustained over time.
Figure 2-7 Internal Processes Deliver Value over Different Time Horizons
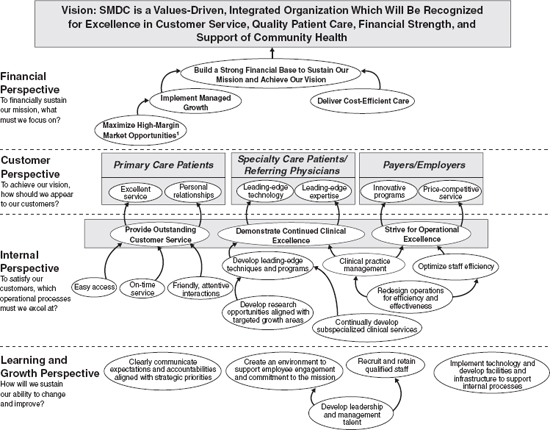
The critical few strategic processes are often organized as strategic themes. Strategic themes allow organizations to focus actions and to provide a structure for accountability. Strategic themes are the building blocks around which the execution of strategy occurs.
Figure 2-8 illustrates the seven strategic themes for a high-tech manufacturing company. Its strategy was to broaden the value proposition from a narrow product quality focus to one that delivered tailored product configurations capable of solving customer problems. At the heart of this strategy were two customer management themes—solution selling and relationship management. These themes provided the foundation of the new customer partnership. Two operations management themes—just-in-time production and flexible manufacturing— ensured that the products could be configured and delivered within the short time horizons required by the customer. Two innovation themes—internal product development and technology partnerships—provided two balanced sources of the technical know-how required to stay at the leading edge. The regulatory and social component of the strategy—build the community—reflected the company’s desire, as the community’s dominant employer, to help strengthen the institutions that influenced the quality of life of its employees. Thus, the company reduced the complexity of its strategy into seven strategic themes, each connected logically to the customer value proposition and financial outcomes.
Learning and Growth: Strategic Alignment of Intangible Assets
The fourth perspective of the Balanced Scorecard strategy map, learning and growth, describes the organization’s intangible assets and their role in strategy. We organize intangible assets into three categories (see Figure 2-9):
Human capital: The availability of skills, talent, and know-how required to support the strategy
Information capital: The availability of information systems, networks, and infrastructure required to support the strategy
Organization capital: The ability of the organization to mobilize and sustain the process of change required to execute the strategy
Figure 2-8 Strategy Is Made Up of a Set of Themes Based on Value-Creating Processes
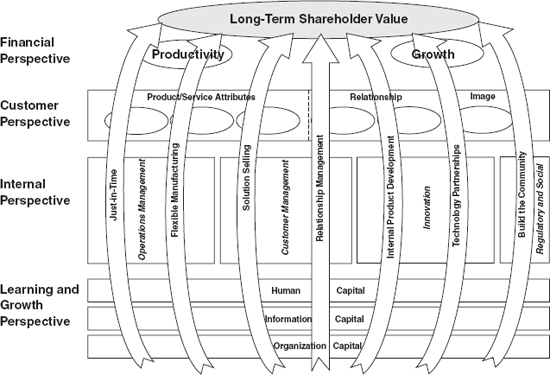
Figure 2-9 Intangible Assets Must Be Aligned with the Strategy to Create Value
Whereas all organizations attempt to develop their people, technology, and culture, most do not align these intangible assets with their strategies. The key to creating this alignment is granularity—that is, to move beyond generalities such as “develop our people” or “live our core values” and focus on specific capabilities and attributes required by the critical internal processes of the strategy. The Balanced Scorecard strategy map enables executives to pinpoint the specific human, information, and organization capital required by the strategy.
THE BALANCED SCORECARD: MEASURES, TARGETS, AND INITIATIVES TRANSLATE STRATEGY INTO ACTION
The strategy map describes the logic of the strategy, showing clearly the objectives for the critical internal processes that create value and the intangible assets required to support them. The Balanced Scorecard translates the strategy map objectives into measures and targets. But objectives and targets will not be achieved simply because they have been identified; the organization must launch a set of action programs that will enable the targets for all the measures to be achieved. The organization must supply scarce resources—people, funding, and capacity—for each action program. We refer to these action programs as strategic initiatives. For each measure on the Balanced Scorecard, managers must identify the strategic initiatives needed to achieve the target. The initiatives create results. Hence, the execution of strategy is managed through the execution of initiatives.
The action plans that define and provide resources for the strategic initiatives must be aligned around the strategic themes, and must be viewed as an integrated bundle of investments instead of as a group of standalone projects. Each strategic theme should have a self-contained business case.
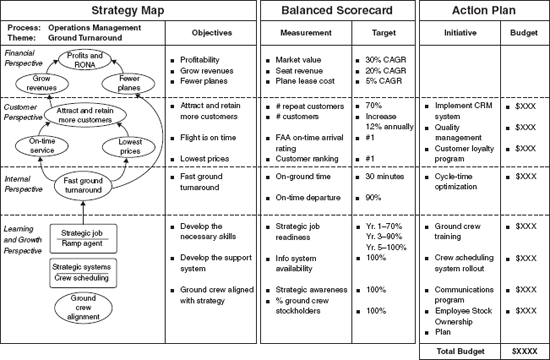
Figure 2-10 illustrates an action plan and business case for the “quick ground turnaround” theme of a low-cost airline. This theme was core to the low total cost customer value proposition. It would contribute to on-time departures and arrivals that would increase satisfaction among customers, leading to future revenue increases. It also would enable the company to reduce costs by operating with fewer planes and flight crews than competitive airlines, so that it could offer lower fares to attract price-sensitive customers while still earning profits and a return on investment above its cost of capital.
The figure shows the intangible assets required to enable the strategy: new skills for the ramp agent, an improved information system, and the alignment of the ground crew to the strategy. The middle of the figure shows the Balanced Scorecard of measures and targets for the strategic objectives in the strategy map. The right side of the figure identifies the strategic initiatives and the costs required to achieve the targets established in the scorecard. The company has identified eight initiatives—each affecting one or two objectives—and all eight initiatives are necessary for the strategy to succeed. If one is deleted, a critical objective will be missed and the chain of cause-and-effect relationships will be broken. For example, ground crew training and a new crew scheduling system might be introduced, but if the ground crew does not understand how it fits in (communications program) or does not have incentives to improve organizational performance (employee stock ownership plan, or ESOP), then the strategy will fail. Thus, the figure shows how the strategic theme for fast ground turnaround requires aligned capabilities for intangible assets and a complete set of strategic initiatives.
Figure 2-10 A Strategic Theme Defines the Process, Intangible Assets, Targets, and Initiatives Required to Execute a Piece of the Stragegy
BRINGING IT TOGETHER: THE STRATEGY MAP
We have now worked systematically through the four Balanced Scorecard perspectives to determine the objectives and measures that describe the strategy. A strategy map (see Figure 1-3) provides a visual representation of the strategy. It provides a single-page view of how objectives in the four perspectives integrate and combine to describe the strategy. Each company customizes the strategy map to its particular set of strategic objectives.
Typically, the objectives in the four perspectives of a strategy map lead to about twenty to thirty measures being required in the associated Balanced Scorecard. Some people have criticized the Balanced Scorecard, believing that people cannot focus on twenty-five different measures. If a scorecard is viewed as twenty-five independent measures, it will indeed be too complicated for an organization and its employees to absorb. But this is the wrong way to think about the Balanced Scorecard. The strategy map shows how the multiple measures on a properly constructed Balanced Scorecard provide the instrumentation for a single strategy. Companies can formulate and communicate their strategies with an integrated system of approximately two to three dozen measurements that identify the cause-and-effect relationships among the critical variables, including leads, lags, and feedback loops, that describe the trajectory, or the flight plan, of the strategy.
In the upcoming chapters, we will focus on the objectives and measures in the internal and learning and growth perspectives. The processes in the internal perspective create and deliver the value proposition for customers, the productivity improvements for the shareholders, and the societal performance for communities and nations. These are the processes that must be performed at an outstanding level, and in harmony with each other, if the company’s strategy is to be achieved. The learning and growth objectives describe how the organization’s intangible assets must be enhanced for performing and continually improving the critical internal processes. Organizations that can mobilize and sustain their intangible assets for the value-creating internal processes will be their industries’ leaders.
SUMMARY
The strategy map provides the visual framework for integrating the organization’s objectives in the four perspectives of a Balanced Scorecard. It illustrates the cause-and-effect relationships that link desired outcomes in the customer and financial perspectives to outstanding performance in critical internal processes—operations management, customer management, innovation, and regulatory and social processes. These critical processes create and deliver the organization’s value proposition to targeted customers and also promote the organization’s productivity objectives in the financial perspective. Further, the strategy map identifies the specific capabilities in the organization’s intangible assets—human capital, information capital, and organization capital—that are required for delivering exceptional performance in the critical internal processes.
In the case study following this chapter, we discuss the strategy map of St. Mary’s Duluth Clinics (SMDC), a regional health-care delivery system. SMDC provides an example of an organization with multiple customers—patients, physicians, and payers. Its strategy is to deliver a different value proposition to each customer: customer intimacy for patients, product leadership for physicians, and low total costs to payers.
NOTES
1. The strategies of public-sector and nonprofit organizations are designed to create sustainable value for their stakeholders and constituents.
2. See, for example, Henry Mintzberg, Bruce Ahlstrand, and Joseph Lampel, Strategy Safari: A Guided Tour Through the Wilds of Strategic Management (New York: Simon & Schuster, 1998), and P. Ghemaat, “Competition and Business Strategy in Historical Perspective,” Business History Review (Spring 2002): 37–74.
3. Michael Porter, “What Is Strategy?” Harvard Business Review (November–December 1996): 61–78.
4. For nonprofit and public-sector organizations, the high-level objective is delivering value to constituents and citizens, not to shareholders. We discussed the modifications of the strategy map for nonprofit and public-sector organizations in Chapter 5, “Strategy Scorecard in Nonprofit, Government, and Health Care Organizations,” in The Strategy-Focused Organization (Boston: Harvard Business School Press, 2001).
5. Market share refers to the percentage of company’s sales to total industry sales. Account share measures the company’s proportion of a given customer’s or group of customers’ purchases in a given category. For example, a retail clothing store can estimate that it supplies, on average, 13 percent of the clothing purchased by its customers. A fast-food outlet might supply 40 percent of a family’s fast-food purchases or 2 percent of its total food consumption.
6. Carl Shapiro and Hal R. Varian, Information Rules: A Strategic Guide to the Network Economy (Boston: Harvard Business School Press, 1998); Arnoldo C. Hax and Dean L. Wilde, The Delta Project: Discovering New Sources of Profitability in a Networked Economy (New York: Palgrave Macmillan, 2001).
CASE STUDY
ST. MARY’S DULUTH CLINIC HEALTH SYSTEM
Background
An innovative leader in health care in northeastern Minnesota and Wisconsin, St. Mary’s Duluth Clinic (SMDC) Health System encompasses twenty clinics, a 350-bed tertiary medical center, two community hospitals, and a specialty care facility. SMDC’s medical team of more than 380 physicians and 200 allied health-care providers works with an experienced staff of more than 6,000 to provide primary care, specialty services, and medical technology to families in their own communities. SMDC’s annual revenue is $650 million.
SMDC’s goal is to provide residents of northeastern Minnesota and Wisconsin with a broad menu of health-care services close to their homes. Its mission states: “SMDC is a regional health-care system committed to enhancing the health status of the people we serve by:
- Promoting the personal health and total well-being of all people
- Providing expert medical services supported by compassionate care and innovation
- Creating value for our patients and customers through teamwork and continuous improvement
- Demonstrating leadership in medical education and research
- Regarding every person with dignity and respect”
The Situation
In January 1997, St. Mary’s Hospital merged with Duluth Clinic, a large multispecialty clinic. Both St. Mary’s Hospital and Duluth Clinic were financially sound at the time of the merger. The merger was expected to bring economic stability and strength by reducing duplication and enabling the new entity to compete better on quality and range of services. But the changes in medical coverage and cost reimbursement from the 1997 U.S. Balanced Budget Act, as well as unexpected financial burdens from the merger, put the new SMDC organization into deficit.
The Strategy Map
Realizing that the old “health-care formulation” strategy wasn’t working, SMDC was ready for a new approach. When CEO Peter Person read The Balanced Scorecard, he believed he had found an approach that would help him accomplish two critical goals: to strengthen SMDC’s margins and to better serve its patients. He informed the board of his intention to implement the Balanced Scorecard.
The process of implementing the BSC—and building the strategy map in particular—helped SMDC view itself as a business. The executive team targeted areas for growth that would help to support nongrowth areas. The cross-subsidy allowed SMDC to maintain its needed but less profitable services for patients. The BSC process also helped SMDC define three distinct sets of customers and identify the correct value proposition for each.
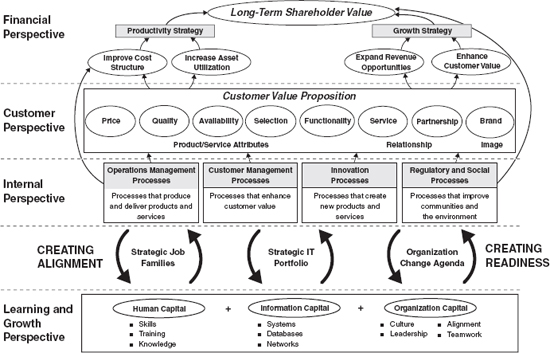
The SMDC strategy map, as with many health-care industry maps, begins with a clear articulation of the organization’s vision and mission that provides a direct line of sight between the ultimate goals of the organization and the more tangible desired financial outcomes, both growth and efficiency (see Figure 2-11).
SMDC’s strategy map articulates the values of its three sets of customers. Defining the value proposition for each customer group provides clarity to the strategy. For example, primary care patients require a “customer intimacy” strategy. “These patients need to know that they won’t have to repeat their entire history every time they come to see us or call us,” notes Mary Johnson, SMDC’s chief operating officer. Specialty care patients and referring providers and physicians are grouped together because providers often refer specialty care patients to SMDC. “This group values clinical excellence and leading-edge technology and expertise,” says Johnson. For that reason, SMDC approaches this group with a “product leadership” strategy.
SMDC’s final customer group is payers, those who buy services from SMDC. This group wants low-cost service and innovative health-case coverage programs. They want to be able to offer to their employees and their customers the most value for their money. This translates into a “low total cost” strategy.
SMDC’s internal process perspective articulates the processes that deliver the appropriate value proposition to each of the three customer groups. SMDC focuses on processes that “provide outstanding customer service” for its primary care patients; processes that “continually develop subspecialized clinical services” for its specialty care patients and referring physicians; and processes that “strive for operational excellence” for its payers and employer customer. For example, whereas SMDC is now the largest provider in the Duluth area, it uses its internal process perspective to focus on processes that make primary care patients feel welcome and provide a small-town, local community feeling while taking advantage of scale benefits such as improved access and admissions technology. When it comes to processes that support the specialty care patient and referring physician, SMDC uses its internal process perspective to focus attention on the clinical technologies that both provide a competitive edge and appeal to physicians who use that technology every day. And the operational excellence portion of the strategy map forces SMDC to keep a clear focus on the operations processes that make clinical and administrative activities more efficient, such as staff scheduling and billing management, thereby reducing costs while creatively servicing payers and employers.
Figure 2-11 St. Mary’s Duluth Clinic Health System’s Strategy Map
1Cardiothoracic, Orthopedics, Neurosurgery, Cancer, Gastroenterology, Surgery
Finally, SMDC focuses on those learning and growth objectives that will optimize employee and organizational ability to change and improve. SMDC believes that the learning and growth perspective enables a two-way “contract” with all employees. SMDC pledges enabling support and expects increased commitment and performance in return. SMDC believes that only by clearly communicating its strategy and helping staff to understand their roles in the execution of that strategy can the organization optimize its performance while remaining a great place to work. The objectives within the learning and growth perspective serve as constant reminders of what is required to make the two-way contract possible. The objectives within the rest of the strategy map will be attainable only with appropriate investment in learning and growth. A clear understanding of and continuing dialogue about these objectives has energized the entire organization.
Anecdotes
After development and rollout of the corporate Scorecard and strategy map, SMDC cascaded the Balanced Scorecard across the organization, aligning all of the service lines (both growth and nongrowth areas), the community clinics, and key support departments. The BSC team implemented a strategic awareness campaign to communicate across the organization. SMDC has also linked strategy to the budgeting process, and has used the BSC to focus its monthly strategic operating review meetings. SMDC is now in its third year of BSC implementation, an ongoing, continually evolving process.
SMDC reviews and refreshes its strategy map each year at budget time. It readjusts the targets and initiatives for the next year and reaffirms that it is measuring the right things.
Three years after launching its BSC effort, SMDC has garnered significant results. In FY2001, it achieved:
- A $23 million increase in profitability, including an $18 million turnaround in the first year of implementation
- A stabilized cost per adjusted discharge and cost per encounter despite increased drug and salary costs
- A decrease of ten days in accounts receivable for clinics and eight days for hospitals
- A 13 percent improvement in appointment access availability for primary care clinics
- A 15 percent improvement in overall hospital patient satisfaction
- An 11 percent improvement in overall clinic patient satisfaction
According to Dr. Peter Person, CEO of SMDC:
Building the strategy map was a turning point for the executive team in fully understanding the organization as a business, defining our customers, and translating this into a clearly focused strategy. This resulted in a performance management tool to focus the entire health-care system. Our monthly scorecard review sessions are incredibly valuable to me as CEO. The scorecard enables us to easily scan and digest overall organizational performance and to identify any necessary course corrections. The balance of our discussion time has definitely shifted from day-to-day operations to strategic issue decision making.
St. Mary’s Duluth Clinic Health System is a member of the Balanced Score-card Hall of Fame.
_______________
Case prepared by Ann Nevius and Judith Ross of Balanced Scorecard Collaborative and Barbara Possin of SMDC. Our thanks to Dr. Peter Person and his colleagues for sharing the SMDC experience.