C H A P T E R T W E L V E
PLANNING THE CAMPAIGN
IN PREVIOUS CHAPTERS, we described the building blocks of strategy and value creation. We showed how internal processes create and deliver the differentiating value proposition to targeted customers. We demonstrated how to align intangible assets—human, information, and organization capital—to these critical internal processes so that the value proposition can be continually improved. These connections, however, represent only a static model of value creation. In this chapter, we introduce the value creation dynamics.
Three ingredients must be added to the strategy map to create the dynamics of strategy.
- Quantify: Establish targets and validate the cause-and-effect relationships in the strategy map
- Define the time line: Determine how strategic themes will create value in short-, medium-, and long-term horizons to create balanced and sustained value creation
- Select initiatives: Choose the strategic investments and action programs that will enable the organization to achieve its targeted performance in the stated time frames
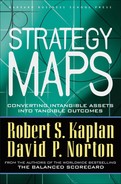
Without quantifying, a strategic objective is simply a passive statement of intent. “Reduce the product development cycle,” for example, signals that product development is one of the critical few processes to improve if the strategy is to succeed. “Reduce the product development cycle from three years to nine months” signals that radical, outside-the-box thinking is required to achieve such a breakthrough. “Reduce the product development cycle from three years to nine months by year (t0 + 4)” signals that this is a long-term project; the ultimate achievement of the objective will take place four years from now. For the organization to achieve this objective within the specified time period, it will require specific action programs; for example, the product development process must be reengineered, and new skills and new technologies must be acquired. Figure 12-1 identifies specific initiatives and the associated budget that are required to achieve the overall objective for a strategic theme of enhancing internal product development at Hi-Tek Manufacturing.
Setting targets is part of any planning exercise, but the usual approach is fragmented and not cumulative. For example, the engineering department sets targets to reduce the product development cycle while the HR department sets targets for retaining key staff members. The strategy map allows an organization to take a holistic perspective. The organization, by clarifying the complete value-creating logic of a strategic theme, now has a framework that integrates the various processes for implementing the strategy: setting targets, defining and selecting initiatives to achieve the targeted performance, and authorizing the budgets for the initiatives. The collection of linked objectives, targets, initiatives, and budgets for a strategic theme, such as that shown in Figure 12-1, provides a complete, stand-alone business case for that piece of the strategy.
The strategic theme is the building block of strategy. It creates a microeconomic model of one dimension of the strategy. But strategy requires that several such value-creating themes be managed simultaneously. The strategy map of Hi-Tek Manufacturing, shown in Figure 12-2, identifies seven complementary and simultaneous themes, each creating value at a different point in time. The innovation themes create value over a three- to five-year period. The “internal product” development theme (just described) and the “technology partnership” theme both ensure the flow of new products that will sustain growth in the future. The customer management themes—“solution selling” and “relationship management”—will take one to three years to change the interface with the customer. The operations management themes—“just-in-time” operations and “flexible manufacturing”—will create value quickly through cost reductions and productivity improvements. The responsible citizen theme—“build the community”—shapes long-term success by ensuring availability of a quality workforce. Each of these themes has its own microeconomic action plan.
Figure 12-1 Quantifying the Strategy at Hi-Tek Manufacturing
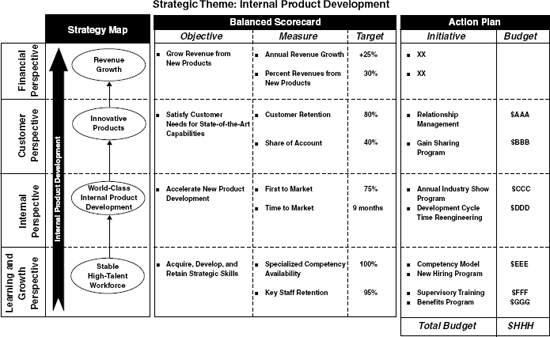
Figure 12-2 The Hi-Tek Manufacturing Strategy Map
Using a military metaphor, each strategic theme is analogous to a battle; the strategy includes a “battle” to improve solution selling, and a “battle” to reduce the product development cycle. Battles are the building blocks of a military campaign, but unless battles are organized into a broader strategic logic, one can win several battles, and still lose the war. The same is true for our model of enterprise strategy—managers can successfully execute one theme, one piece of the strategy, but not achieve desired performance. They lose the war, in effect, because they have not executed or coordinated other strategic themes.
The strategy map of the enterprise provides the macroeconomic model for planning the overall campaign. The same principles of quantifying targets and establishing time lines for accomplishment that we applied to strategic themes also apply to the overall strategy map.
The Cigna case, introduced in our earlier work, provides an excellent example of the dynamic management of parallel strategic themes.1 Gerry Isom accepted the presidency of Cigna Property & Casualty in 1993 when the division was on the brink of failure. Business losses had mounted and the division was nearly bankrupt. By 1998, Isom and his management team had transformed the division into a high-profit performer, with many business units producing top-quartile profit performance. Isom launched this remarkable turnaround by creating a clear picture of what Cigna P&C could become over the next five years. He used the term specialist to define the basic change in strategy that could create success; the division would, in the future, write policies only when its specific knowledge of an underwriting risk exceeded that of the industry. Top quartile defined a target for success that, while difficult to comprehend when the organization was on the brink of bankruptcy, reenergized employees’ pride that they worked for a high-performing organization. The five-year goal gave a realistic window of time for achieving the top-quartile stretch target.
The vision created the picture of the destination. The strategy defined the logic of how this vision would be achieved. Vision and strategy are essential complements. At Cigna, Isom’s vision was appealing, but it would lack credibility unless managers could develop a strategy to show how the vision would be realized. Isom used a simple but clever technique when he “quantified” his vision. The insurance industry uses the combined ratio measure as a surrogate for profitability. The ratio divides the expenses of the organization—claims paid plus operating expenses—by its revenues from premium income. In an ideal world, with operating revenues exceeding expenses, the combined ratio should be less than one. But because the cash from premiums received is invested until it is required for claims, top-quartile performers can have combined ratios of 103 by depending on returns from investments to provide the additional income source to achieve profitability.
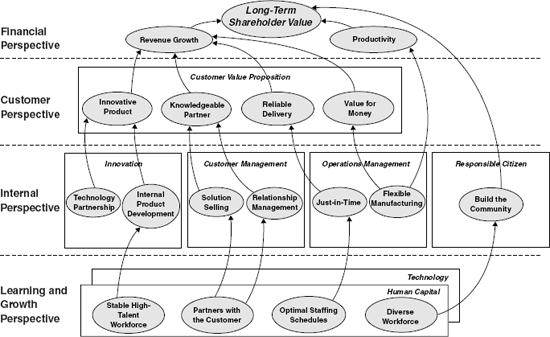
In 1993, Cigna P&C’s combined ratio was nearly 140. Isom’s high-level strategy to achieve a top-quartile combined ratio, shown in Figure 12-3, had four themes:
- Improve agents’ productivity
- Focus on target markets
- Align the underwriting and claims processes
- Upgrade the underwriting process
Isom established a time line and an approximate target for reducing the combined ratio for each theme of the strategy. In this way, he broke a seemingly impossible goal of a thirty-seven-point reduction in the combined ratio into more manageable and realistic components, each with a specific target and time frame. Instead of one giant, impossible leap to the top quartile, the vision had become translated into a strategy consisting of a series of smaller, time-phased steps. The organization could now see a feasible path for achieving Isom’s vision. He reported, “The structure of the scorecard helped us clarify our strategy and keep the organization focused on making our vision a reality.”
USING STRATEGY MAPS TO PLAN THE CAMPAIGN
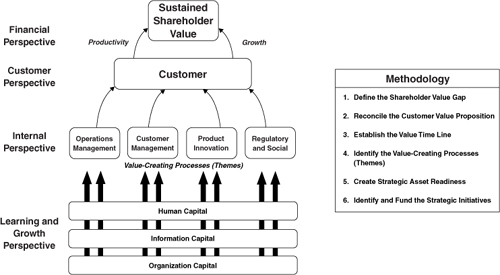
Strategy maps provide a static snapshot of the enterprise strategy. Quantifying targets, establishing time lines for accomplishment, and planning and authorizing initiatives allow the strategy map to become a dynamic representation of value creation over time. We have developed a six-step process, called planning the campaign, based on the cause-and-effect logic of a strategy map, to conduct scenario planning exercises while the map is being built. Figure 12-4 describes the six steps:
- Define the shareholder/stakeholder value gap:
Set the stretch targets and the value gap that must be closed - Reconcile the customer value proposition:
Identify the target customer segments and value propositions that provide new sources of customer value - Establish the time line for sustained results:
Show how the value gap will be closed over the planning horizon - Identify the strategic themes (critical few processes):
Allocate the value gap to strategic themes - Identify and align intangible assets:
Define the readiness gap in human, information, and organization capital - Identify and fund the strategic initiatives required to execute the strategy:
Fund the strategy
Figure 12-3 Planning the Campaign at Cigna Property & Casualty
Figure 12-4 Using Strategy Maps to Plan the Campaign
The process yields a set of action plans including targets, initiatives, and resources for each piece of the strategy in the organization’s strategy map and Balanced Scorecard. We illustrate the six-step approach with the Consumer Bank case study, discussed in chapters 7 and 9.
Step 1: Define the Shareholder Value Gap
a. Define the overarching financial (or mission) objectives and measures
b. Define the targets and value gap
c. Allocate the value gap to growth and productivity goals
Strategy maps start, in the financial perspective, with objectives for creating shareholder value through two financial objectives: a long-term revenue growth component, and a short-term component from productivity improvements. Figure 12-5 shows the financial objectives at Consumer Bank. The overarching shareholder objective was to “dramatically increase earnings per share.” The stretch target for this overarching objective was to “increase net income by $100 million in five years.” The stretch target creates a value gap—the difference between future aspiration and current reality. The value gap communicates to the organization that dramatic change is required since the stretch target should not be achievable solely by continuous improvements.
Establishing the size of the value gap is an art. Executives must balance the benefits from challenging the organization to achieve dramatic improvements in shareholder value with the realities of what can possibly be achieved. A stretch target viewed as impossible to achieve will not only fail to motivate employees; it could actually demotivate them and cause them to believe the executive’s head is in the clouds, not in the reality of conducting business day by day.
Figure 12-5 Case Study: Defining the Value Gap at Consumer Bank
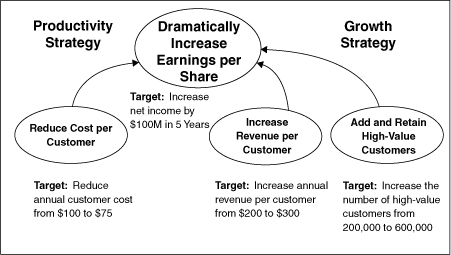
The first test of feasibility occurs when the executive team allocates the overall value gap to the different financial sub-objectives. Consumer Bank set three sub-objectives to support the high-level objective of income growth: (1) a productivity sub-objective to “reduce cost per customer,” (2) one growth sub-objective to “increase revenue per customer,” and (3) a second growth sub-objective to “add and retain high-value customers.” The targets for the three financial sub-objectives were:
- Reduce annual customer cost from $100 to $75
- Increase revenue per customer from $200 to $300
- Increase the number of high-value customers from 200,000 to 600,000
If Consumer Bank could achieve the targets for these three financial sub-objectives over the next five years, then it could achieve its overarching goal to “increase net income by $100 million.” While this high-level assignment provides some breakdown of the overall stretch target, few in the organization will yet understand how or even whether the three financial sub-objective targets can be achieved. That is the role for targets in the remaining three perspectives of the strategy map. The high-level financial targets shape how the remainder of the strategy is defined. After working through the objectives and targets in the other three perspectives, management may conclude that the financial targets are not achievable and need to be revised. Thus, the breakdown of the high-level shareholder value target may require several iterations. On the other hand, setting stretch targets for the organization stimulates innovative thinking at lower levels of the organization that could lead to performance levels dramatically better than any seen in the past. Creating a value gap for financial performance stimulates managers and employees to brainstorm about how to radically enhance customer relationships, internal processes, and employee, information, and organization capital to produce the desired performance level.
Step 2: Reconcile the Customer Value Proposition
a. Clarify target customer segments
b. Clarify the customer value proposition
c. Select the measures
d. Reconcile customer objectives with financial growth goals
Cost and productivity improvements are relatively easy to target and plan for. After all, the amounts currently being spent are visible in the organization and can be benchmarked against the cost of processes operated by other organizations. So the opportunities for cost and productivity improvements should be tangible. Much harder is articulating how revenue growth targets will be achieved. Revenue growth requires explicit attention to targeted customer groups, including selling more to existing customers and also selling to entirely new customers. Such growth is unlikely to happen automatically or just because the organization has approved a financial plan based on a spreadsheet that assumes 11 percent annual revenue growth. The company must identify the value proposition it will offer customers in targeted groups that will lead to the desired revenue growth.
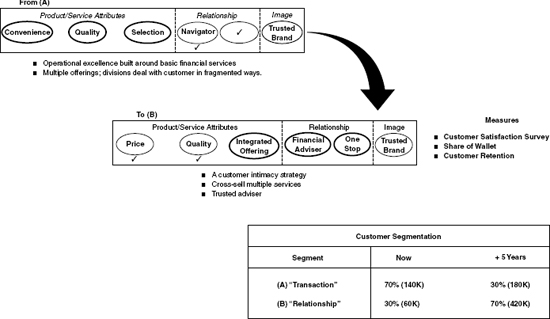
Figure 12-6 illustrates the shift in the marketplace that Consumer Bank was attempting. To achieve the target for increased revenue per customer, the bank planned for its employees to become trusted financial advisers, capable of helping customers develop and implement long-term financial plans. In building these relationships, the bank would proactively introduce a tailored package of integrated services to the customer, instead of the past approach of waiting for customers to request individual products and services. The past strategy of the bank appealed to “transaction” (segment A) customers who used only a small subset of the bank’s services, as needed. Most customers (about 70 percent) used other financial service providers for their credit cards, mortgages, investments, retirement planning, and insurance. By cross-selling multiple, integrated services to “relationship” (segment B) customers, the bank would increase its revenue per customer. The bank established a target that within five years, 70 percent of its customers would be based on the relationship value proposition. The customer perspective, with its definition of the new targeted customer segment, the value proposition that would enable cross-selling to be both credible and effective, and the targets for customer retention and cross-selling, became the focus for objectives, targets, and initiatives in the internal and learning and growth perspectives of the strategy.
Figure 12-6 Case Study: Reconciling the Customer Value Proposition at Consumer Bank
Step 3: Establish the Value Time Line
a. Establish the time line for results
b. Allocate the value gap to different themes
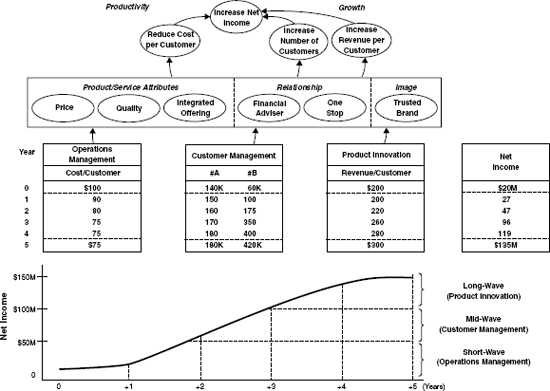
Figure 12-7 illustrates Consumer Bank’s value time line—how value will be created over time by different internal processes. The overall time horizon for the strategy was five years. Operations management processes would reduce cost per customer. The major impact of this strategy would be felt in the first two years as cost per customer dropped from $100 to $80 per year. If this target were achieved, the company’s net income would double in the first two years, from $20 million to $47 million. Customer management processes would increase the number of relationship (Segment B) customers. Although progress would be made in each year, the major growth would come in year three, helping to boost net income in that year to $96 million, from $47 million in year two. Innovation processes would introduce new products and services that would eventually increase revenue per customer from $200 to $300 per year. Developing new products typically took two to three years, so the impact from the innovation processes would be felt mostly in years three, four, and five. By year five, each component of the strategy would have been established, enabling Consumer Bank to achieve and even exceed what initially had been seen as a highly aggressive stretch target of net income growth exceeding $100 million. The allocation of this stretch target to the separate internal process clusters enabled everyone to see that the target was achievable and the increases in new income expected during each of the five years in the planning horizon.
Figure 12-7 Case Study: Establishing the Value Time Line at Consumer Bank
The breakdown of the high-level financial targets into targets for specific internal processes allows feasibility testing to take place at lower levels of detail. The organization can now assess whether the high-level targets in the financial perspective (stakeholder perspective, for nonprofit and public-sector organizations) are achievable or whether they need to be lowered. In our experience, seemingly impossible financial targets can often be realized through the compounding of targets at the internal process level. When a financial goal is first announced to “double shareholder value” or “increase net income by a factor of six,” everyone in the organization is skeptical. Such levels of performance may never have been achieved in the past; why should the future be different? Financial targets by themselves are difficult to internalize and inspire. Only when financial targets get broken down into targets for internal processes and strategic themes, and with specific time frames attached, can everyone in the organization get comfortable with the feasibility of the overall target.
Step 4: Identify Strategic Themes
a. Identify the critical few processes (strategic themes) that have the greatest impact
b. Establish measures and targets
The customer value proposition defines how the enterprise creates value for its customers and, hence, its shareholders. The value time line describes how this value will be generated over the planning horizon by processes in the four internal clusters. In Part II of the book, we identified sixteen value-creating processes in these four clusters. Whereas most organizations must perform each of these processes, not all are decisive for the success of a particular strategy. Step 4 identifies the critical few value-creating processes expected to have the greatest impact on the customer value proposition and the financial productivity objectives. This step aligns the critical internal processes (the drivers) to achieving the targets for the organization’s financial and customer objectives (the outcomes).
Figure 12-8 summarizes the value-creating processes selected at Consumer Bank. The bank selected two operations management processes for satisfying existing customers and delivering desired productivity gains for the financial perspective. “Provide rapid response” (measured by request fulfillment time) allowed the bank to shift more of its support to Web-based self-help technology. “Minimize problems” reduced the incidence and cost of errors while increasing customer satisfaction.
Figure 12-8 Case Study: Identifying the Value-Creating Processes at Consumer Bank
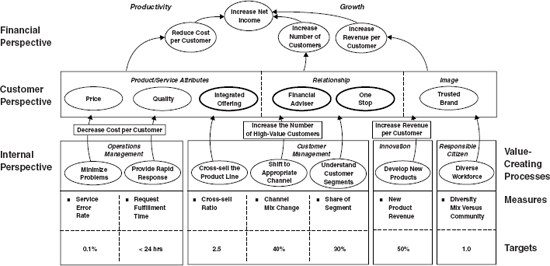
Customer management processes would shift the customer base from transaction/convenience shoppers (segment A) to high-value relationship customers (segment B). The bank identified three critical processes: “Understand customer segments” (customer selection) focused on clarifying the customer value proposition, segmenting the market, and communicating the message to potential customers in the targeted segments. The bank selected “shift to appropriate channel” (customer acquisition) as the second critical customer management process. A telemarketing campaign would migrate customers from old-fashioned “bricks-and-mortar” banking to a more cost-effective “bricks-and-clicks” approach. The third process, “cross-sell the product line” (customer growth), measured by the number of products per customer, focused on relationship management that would introduce a broader range of services to the customer.
The target for the innovation process, to increase revenue per customer by 50 percent, required that the bank create additional services that its representatives could sell to targeted (relationship) customers. The bank selected the innovation process, “develop new products,” which would be measured by “new product revenue.” Finally, the bank identified an important regulatory and social process objective, to build a diverse workforce that would reflect the demographic mix of the communities in which it operated.
Thus, Step 4 showed how the strategy of the bank to increase net income by $100 million could be broken down into seven value-creating processes. The bank performed its feasibility test at this point by establishing targets for each of the seven process measures that, in the opinion of the participants, would be adequate to achieve the targets defined in the value time line. For example, a segment share of 30 percent, a cross-sell ratio of 2.5 products per customer, and a 40 percent change in channel mix would yield the desired growth in target customers, as well as the revenue per customer target. Creating the linked objectives, measures, and targets in the strategy map enabled Consumer Bank to define and test the linkages between its high-level financial target (increase operating income by $100 million in five years) and a set of targets for nonfinancial measures that would deliver the desired financial performance.
Step 5: Create Strategic Asset Readiness
a. Identify the human, information, and organization capital required to support the strategic processes
b. Assess the readiness of these assets to support the strategy
c. Establish measures and targets
In the fifth step, the organization sets targets for the learning and growth objectives that align and create readiness for human, information, and organization capital, the intangible assets. Figure 12-9 describes the learning and growth objectives for Consumer Bank. For each of the seven value-creating internal processes identified in Step 4, the management team asked two questions: (1) “Which job families are critical to managing this process?” and (2) “Which information systems are critical for improving this process?” The answers to these questions established the priorities for developing and aligning human and information capital to the strategy.
Continuing our example, the executive team identified quality managers as the strategic job family for the operations management process to “minimize problems.” Similarly, it identified an incident tracking system as the strategic IT application for this critical process. For the “shift to appropriate channel” objective within the customer management processes, the executive team identified telemarketers as the strategic job family and the CRM/lead management system as the strategic information system. For the “develop new products” objective within the innovation processes, the strategic job family was the joint venture manager, who would seek partners for new product development, and the critical information system was a project management system.
For organization capital—culture, leadership, alignment, and teamwork—Consumer Bank featured two culture objectives: a focus on the customer, and a dedication to the bank’s core values. The leadership priorities were to align the bank’s leadership competency model to the strategy. The personal alignment objective focused on two aspects: strategic awareness—the degree to which each individual understood the strategy, and the extent to which personal goals were aligned to the Balanced Scorecard. Finally, the teamwork objective was to share best practices across the organization.
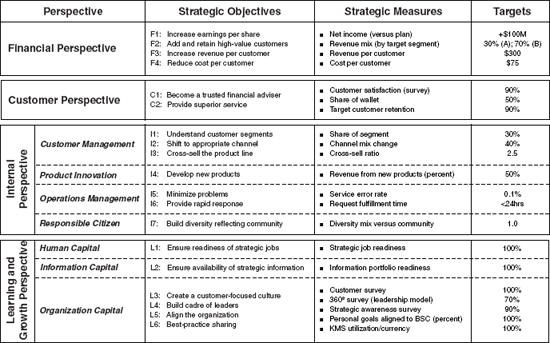
Setting targets for the learning and growth objectives requires a different approach than that used for the objectives in the three other perspectives. The learning and growth objectives must be brought to a high state of readiness to facilitate the improvement in the critical internal processes. Figure 12-10 shows the measures selected at Consumer Bank. For human capital, the target was to achieve 100 percent readiness for the portfolio of selected strategic job families (Figure 12-9). Similarly, a target of 100 percent readiness was established for the portfolio of strategic IT applications (Figure 12-9). Consumer Bank measured its “customer-focused culture” through a direct survey of customers. The goal was to have 100 percent of its customers believe that Consumer Bank’s employees were customer-focused. The bank used an employee survey to determine how well its leaders met their competency profiles. It used the same survey to measure employees’ “strategic awareness.” Targets of 70 percent and 90 percent were set for these two objectives. A personal goal-setting process would align the staff with the strategy. The goal was to have 100 percent of the workforce with personal goals linked to the Balanced Scorecard. Finally, Consumer Bank sought to improve best-practice sharing through the introduction of a knowledge management system (KMS). It set a target that every member of the relevant organization would be an active user and contributor to KMS.
Figure 12-9 Case Study: Defining Strategic Asset Readiness at Consumer Bank
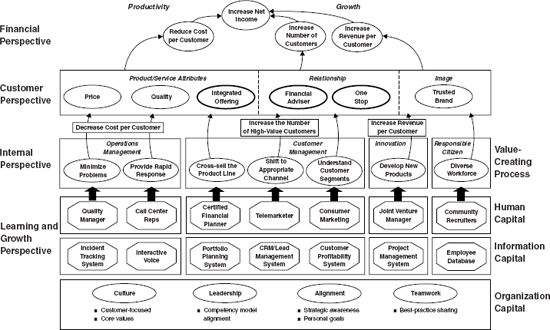
Figure 12-9 represents the full strategy map for Consumer Bank. Figure 12-10 describes the Balanced Scorecard that complements this map. By extending the logic of the strategy map into targets for specific human, information, and organization capital, the bank creates an organization that is completely aligned to the strategy. The strategy is both understandable and actionable. As one executive stated at the completion of this process:
We always had strategic objectives to upgrade the skills of our people and to invest more in information technology that would enhance the customer experience. But when the pressure for short-term earnings hit, these were the first programs to be cut. Now we all understand that we must start investing today in our people, systems, and culture if we are to have any chance of achieving our five-year financial targets.
Step 6: Identify and Fund the Strategic Initiatives
a. Define the specific initiatives required to support the processes and to develop the intangible assets
b. Clarify and secure the funding
The strategy map describes the logic of the strategy, showing clearly the set of critical processes that create value as well as the intangible assets required to support them. The Balanced Scorecard identifies measures and targets for each objective in the strategy map. But objectives and targets are not achieved simply because they have been identified. For each measure on the Balanced Scorecard, managers must identify the strategic initiatives needed to achieve the target. And they must supply the resources—people, funding, and capacity—required to successfully complete each initiative. The initiatives create the results; they are the basis for successful strategy execution.
Figure 12-10 The Balanced Scorecard for Consumer Bank
Consumer Bank, for example, was currently experiencing a 3 percent service failure rate that was leading to the loss of many important customers. It set a target to reduce the service error rate to 0.1 percent. It identified two strategic initiatives to accomplish this defect reduction: Install a new problem tracking system, and redesign the front end of several processes. By identifying and managing these initiatives, the bank soon achieved its 0.1 percent error rate target. The defect rate reduction stemmed the customer losses, and thereby successfully delivered that component of the strategy.
The action plans that define and provide resources for the strategic initiatives must be aligned around the strategic themes (see Figure 12-9), and must be viewed as an integrated bundle of investments, not as a group of stand-alone projects. Each strategic theme should represent a self-contained business case around which the organization aligns and integrates processes and initiatives. Figure 12-11 illustrates the action planning for one of Consumer Bank’s themes—“Shift the Customer to the Appropriate Channel.” This theme requires a telemarketing program to attract new customers to the bank and to shift their usage to technology-supported services. This theme affects one component of the customer value proposition—specifically, the relationship with a personal adviser and one-stop shopping. The primary financial impact of this theme is the acquisition of new customers in the target segment. For the telemarketing process in this theme to be successful, the bank must upgrade the skills of the relevant job family, the telemarketers, provide them with the appropriate information systems, and reshape the organization climate. Figure 12-11 shows the partial set of Balanced Scorecard measures and targets needed to execute the plan. Each measure has at least one strategic initiative needed to achieve its targeted value. And the bank specifies, for each initiative, the funding and staffing required and the individual (the initiative owner) who has primary responsibility for managing the initiative and delivering the results.
Consider the process, “shift customers to appropriate channels.” Its target, to achieve a 40 percent shift in channel mix, requires three strategic initiatives: (1) a telemarketing campaign, (2) the acquisition of prospect lists, and (3) a direct-mail support program. The theme also requires a training program to develop specific marketing skills, several new information systems, and a new survey instrument to solicit customer feedback.
Figure 12-11 Case Study: A Strategic Action Plan at Consumer Bank
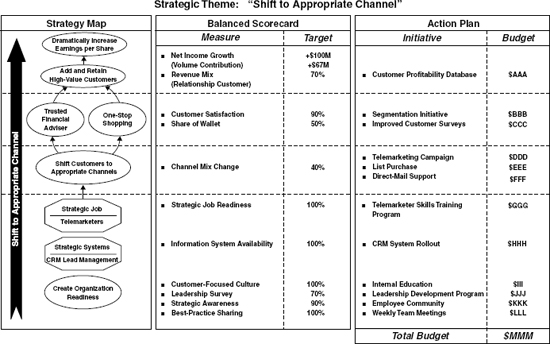
Each of the initiatives is essential for overall success. The resources supplied for the collection of initiatives must be viewed as a bundled investment, not as stand-alone improvement programs. Many organizations today screen investments and initiatives in isolation and by function. Investments in IT are reviewed separately from investments in HR, and both are reviewed separately from marketing and physical capacity investments. This piecemeal approach cannot succeed for successful strategy implementation; each of the strategic initiatives is but one component in a complex recipe whose success depends on all the ingredients being present simultaneously. This is another reason why attempting to attribute overall value creation to individual HR or IT investments is futile. Value is created by an integrated set of processes, each supported by an integrated set of several initiatives. The channel mix theme at Consumer Bank has a target to increase the customer base from 200,000 to 600,000 in five years. This growth in the customer base contributes about $67 million per year, approximately two-thirds of the overall financial objective. Relating the tangible financial outcome to the required investment ($MMM in Figure 12-11) in the entire bundle of initiatives that enhance critical internal processes and support intangible assets creates the financial business case. The cause-and-effect logic of the strategy map makes this linkage clear.
SUMMARY
The strategy map, by providing a clear and comprehensive description of an organization’s strategy, gives executives an enhanced ability to execute their strategies. People can’t manage what they can’t measure, and they can’t measure what they can’t describe. The strategy map solves this problem by providing a framework for a simple, one-page representation of the cause-and-effect linkages among the objectives for both the outcomes and the drivers of the strategy. The word statements of objectives in a strategy map are, in turn, converted into a Balanced Scorecard of measures, targets, and initiatives. The strategy map and Balanced Scorecard enable everyone in the organization to have a common understanding of the strategy. For the many organizations referenced in this book, the strategy map has facilitated performance breakthroughs by allowing them to link their management processes to a clearly defined strategy.
The strategy map by itself, however, is but a static representation of the strategy. It identifies the outcomes and the drivers of value creation. This chapter describes how the strategy map can be used as a dynamic management tool. Setting targets adds the dimensions of time and speed to the strategy. Targets identify the performance gaps that must be closed, and the time scale over which the change must occur. Setting targets, and defining the drivers of their success in a strategy map, allows the feasibility of the strategy to be tested.
Strategic initiatives are the actions required to close the performance gaps between targeted and current performance. Initiatives are the ultimate drivers of change. A performance objective will not be met simply by measuring it. Executing strategy requires that initiatives be actively managed. Integrating the strategy map’s measures, targets, and initiatives provides a complete description of how value is created—that is, a complete description of the organization’s strategy and its successful execution.
The U.S. Army case study following this chapter illustrates the challenges of capturing the conflicting, simultaneous dimensions of strategy, maintaining readiness for missions in the short run, while simultaneously transforming to new capabilities required for future threats and commitments.
NOTES
1. Robert S. Kaplan and David P. Norton, The Strategy-Focused Organization: How Balanced Scorecard Companies Thrive in the New Business Environment (Boston: Harvard Business School Press, 2001), 73–75.
CASE STUDY
THE UNITED STATES ARMY
There are moments in history when events suddenly allow us to see the challenges ahead with a clarity previously unimaginable. The events of this past year have created one of those rare opportunities. Now we see clearly the challenges facing us—and we are confronting them.
—Thomas E. White
18th Secretary of the Army
Army Green Book 2002–2003
Background
The attacks of September 11, the global war on terrorism, and the ongoing transformation of the army to a lighter, more mobile force provided the backdrop for the introduction of the Balanced Scorecard at the U.S. Army. The army was just a few years into its complex long-term effort to transform the operational force and institutional base into the objective force—the full-spectrum force of the future that could leverage technological advances and organizational flexibility. Simultaneously, the army was supporting the global war on terrorism—a new kind of war that required deployment of active forces, reserves, and National Guard, and integration with joint forces and coalition partners. The need to maintain the well-being of the troops and their families remained a constant priority for the army.
The army had been using the same information system since 1963 to report and monitor the readiness of the force. The system did not provide a complete picture of army status, and it relied on lagging indicators and often outdated data. The rapidly changing needs of the national military strategy and the evolving role of the ground combat force made it essential for the army to have a new approach for reporting readiness. The challenge was to create a complete view of strategic readiness that would inform the leadership about the army’s ability to meet the needs of today and the future. The army decided to create a new readiness reporting system, called the Strategic Readiness System (SRS), with the Balanced Scorecard at its foundation.
Strategic Architecture of the Army Scorecard
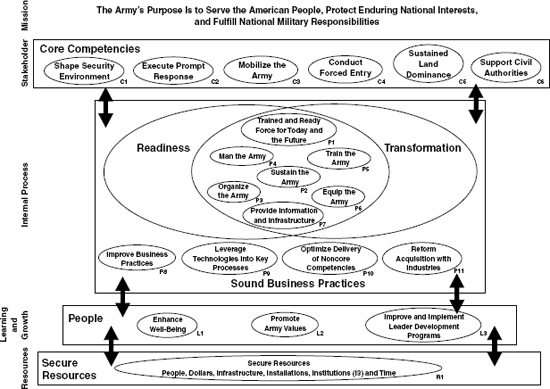
The project team modified the generic strategy map to reflect the army’s mission-driven organization. It placed the mission at the top of the strategy map, and the financial perspective at the bottom as the driver or enabler that made attainment of the mission possible (see Figure 12-12). The customer, internal, and learning and growth perspectives remained, but under slightly different names; for example, customers became stakeholders.
While the multiple perspectives provided the framework for the army scorecard, the themes on the strategy map captured the strategic priorities of the army. Army leadership, both in interviews and in Congressional testimony, continually articulated people, readiness, and transformation as clear priorities. People were the cornerstone of the Army—the well-being of the troops and their families was paramount to attainment of the mission. Current readiness was essential for the Army to meet the immediate needs of the national defense strategy. And transformation was the change effort that would secure the preeminence of the U.S. Army in the new security environment. The theme of sound business practices communicated the standard of practice to ensure efficiency and optimal use of resources in all processes. Core competencies outlined the capabilities that the Army must maintain to fulfill national military responsibilities whatever they should be. Finally, secure resources emphasized the acquisition and use of the resources required to execute all of the above.
The Strategy Map
Stakeholder Perspective
The American people, the president, secretary of defense, Congress, and combatant commanders were all considered critical stakeholders or customers. What did they want from the army? Given the uncertain nature of future defense requirements, this was a difficult question to answer. The stakeholders expected trained and ready forces. Yet major questions persisted: Trained and ready for what? What level of readiness? For what type of combat?
Ultimately, leadership reaffirmed a set of core competencies in which the army must be proficient to meet any requirement of the stakeholders. These competencies had previously been identified in an army strategy document, the Army Planning & Program Guidance. The requirements of a major theater war, multitheater demands, peacekeeping support, cooperation with allies, and response to a domestic disaster could all be met if the army maintained a level of performance in each of these competencies.
Figure 12-12 Army Mission Map
Internal Process Perspective
The challenge of strategy execution is embodied in the internal perspective, which articulates the relationship between current readiness and future readiness defined by the long-term transformation campaign plan. The ultimate goal is to transform into the Future Objective Force, but this objective has to be balanced with the priority to maintain a current readiness to support the global war on terrorism. The strategic challenge for the army leadership is to monitor the strategic trade-offs between these two priorities. The Balanced Scorecard helps to monitor the tension between delaying transformation so that current readiness requirements could be met, and the compromises for today’s readiness to ensure continual progress toward achieving the transformation campaign plan. The two themes of readiness and transformation are depicted as interlocking circles. The U.S. Army must maintain the appropriate tension and balance between them to ensure that trained and ready forces are available for both today’s and the future’s missions, providing core competencies as needed.
Execution of sound business practices supports the internal perspective by increasing the overall effectiveness of the army, both in readiness and transformation.
Learning and Growth Perspective
The key theme in the learning and growth perspective is people and their well-being. Soldiers are the centerpiece of the army. The army has an imperative to create an environment in which soldiers and their families can thrive. Army values must penetrate life in the army, and a focus on leadership development must be present at all levels of the enterprise.
Resources Perspective
The theme to secure resources provides the foundation for the strategy map. Attaining the resources required to achieve the mission and satisfy the stakeholders is a critical driver of success. Resources are defined more broadly than just financial. They include people, dollars, infrastructure, installations, institutions, and time to utilize the resources. Each of these must be provided to the army and invested wisely for its mission to be achieved.
Impact
General John M. Keane, the twenty-ninth vice chief of staff of the U.S. Army, outlined the benefits of SRS in a statement before the Subcommittee on Readiness of the U.S. House of Representatives Armed Services Committee on March 18, 2003:
The Army’s Strategic Readiness System was implemented in October 2002 as a comprehensive strategic management and readiness assessment tool. It provides Army leadership with accurate, objective, predictive, and actionable readiness information to dramatically enhance strategic resource management. For the first time we have an Army enterprise management system that integrates readiness information from both the Active and Reserve Components—enabling the Army to improve support to Combatant Commanders, invest in Soldiers and their families, identify and adopt sound business practices, and Transform the Army to the Objective Force. This reporting system markedly improves how we measure readiness by gathering timely information with precision and expands the scope of the data considered. We are further addressing issues that affect readiness before they become problems.
_______________
This case was prepared by Laura Downing and Patricia Bush of Balanced Scorecard Collaborative with the assistance of numerous colleagues at the U.S. Army.