C H A P T E R S E V E N
ALIGNING INTANGIBLE ASSETS TO ENTERPRISE STRATEGY
WE DISCUSSED IN CHAPTER I how intangible assets have become decisive for sustainable value creation. The dictionary definition of intangible, “incapable of being realized or defined,” points to the difficulty that an organization has in managing these assets. How can it manage what can’t be defined?
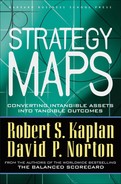
The learning and growth perspective of the Balanced Scorecard highlights the role for aligning the organization’s intangible assets to its strategy (see Figure 7-1). This perspective contains the objectives and measures for three components of intangible assets essential for implementing any strategy:
- Human capital
- Information capital
- Organization capital
The objectives in these three components must be aligned with the objectives for the internal processes and integrated with each other. Intangible assets should build upon the capabilities created in other intangible and tangible assets, rather than create independent capabilities with no synergies among them.
Figure 7-1 Intangible Assets Must Be Aligned with the Strategy to Create Value
1. ALIGNMENT. The Intangible Assets Must Be Aligned with the Strategy, in Order to Create Value.
Intangible assets take on value only in the context of strategy, what they are expected to help the organization accomplish. For example, assume an organization wants to invest in staff training. Assume further that it has two choices—a training program on total quality management (TQM) or a program on customer relationship management (CRM). Which program has the greatest value? Clearly the answer to this question depends on the organization’s strategy. A company following a low total cost strategy, such as Dell and McDonald’s, that needs to continually improve its operating processes would get higher value from TQM training. A company such as Goldman Sachs or IBM Consulting, however, that follows a total customer solution strategy, would benefit most from CRM training. The same investment in training creates dramatically higher returns when it is aligned with the organization’s strategy. Strategic alignment is the dominant principle in creating value from intangible assets.
2. INTEGRATION. The Strategic Role of Intangible Assets Cannot Be Addressed on a Stand-Alone Basis. An Integrated Program Is Required to Support the Enhancement of All the Organization’s Intangible Assets.
When an organization groups its activities around functions, such as HR and IT, it often creates silos of specialization. People in the separate functional departments look to professional models within their disciplines as points of reference or benchmarks. Such specialization is obviously beneficial for creating deep functional excellence in each department. But, in practice, the different functional units strive for excellence in isolation from each other. Each department competes for the organization’s scarce resources; one argues to increase employee training while the other urges an expansion of technology capabilities. Solutions are sought in isolation and the results are usually disappointing.
Investments in IT have no value unless complemented with HR training and incentive programs. HR training programs have little value unless complemented with modern technology tools. HR and IT investments must be integrated if the organization is to realize the full potential benefits.
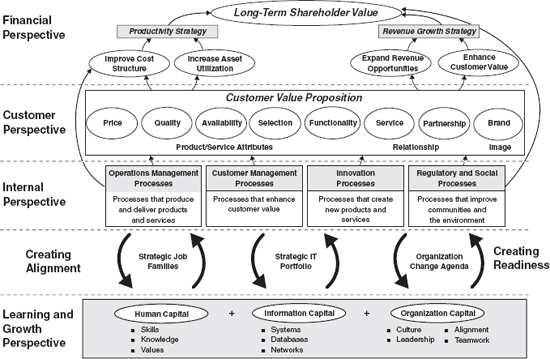
Alignment and integration provide the conceptual building blocks for developing objectives for human capital, information capital, and organization capital in the learning and growth perspective. Few organizations, however, exploit the potential competitive advantages from aligning and integrating their intangible assets. We conducted two surveys of HR and IT executives, to better understand their approaches to strategic alignment (see Figure 7-2). Only one-third of the organizations reported strong alignment of HR and IT priorities with enterprise strategy. Why the misalignment? Fundamental management processes designed to create alignment were not being used as intended. Few HR and IT organizations integrated planning with strategy, assigned relationship managers, or linked budgets to strategy.
Executives do not dispute the need to align and integrate their intangible assets. Until now, however, they lacked a method for alignment and integration. In this part of the book, we build upon the internal process objectives developed in Part II to describe how the strategy map and Balanced Scorecard enable organizations to accomplish the following:
- Describe intangible assets
- Align and integrate intangible assets to the strategy
- Measure intangible assets and their alignment
DESCRIBE INTANGIBLE ASSETS
Intangible assets have been described as “knowledge that exists in an organization to create differential advantage”1 or “the capabilities of the company’s employees to satisfy customer needs.”2 Intangible assets encompass such diverse items as patents, copyrights, workforce knowledge, leadership, information systems, and work processes. We have examined the learning and growth perspective of several hundred strategy maps and Balanced Scorecards. Six objectives consistently appeared:
Figure 7-2 Summary of Alignment Practices of HR and IT Groups
1Conducted by Balanced Scorecard Collaborative and CIO Insight, 2002 (634 participants)
2Conducted by Balanced Scorecard Collaborative and Society for HR Management (1,266 participants)
Human Capital
1. Strategic competencies: The availability of skills, talent, and know-how to perform activities required by the strategy. (About 80 percent of the scorecards included such an objective.)
Information Capital
2. Strategic information: The availability of information systems and knowledge applications and infrastructure required to support the strategy (included in 80 percent of scorecards).
Organization Capital
3. Culture: Awareness and internalization of the shared mission, vision, and values needed to execute the strategy (included in 90 percent of scorecards).
4. Leadership: The availability of qualified leaders at all levels to mobilize the organizations toward their strategies (included in 90 percent of scorecards).
5. Alignment: Alignment of goals and incentives with the strategy at all organization levels (included in 70 percent of scorecards).
6. Teamwork: The sharing of knowledge and staff assets with strategic potential (included in 60 percent of scorecards).
These objectives describe important intangible assets and provide a powerful framework for aligning and integrating them to the organization’s strategy.
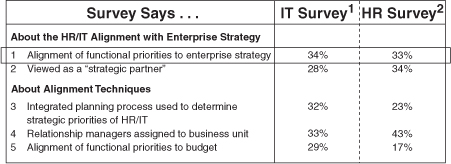
Take, for example, the learning and growth objectives in Datex-Ohmeda’s strategy map (see Figure 7-3). The largest division of Instrumentarium Corporation, Datex-Ohmeda is based in Helsinki, Finland, and has manufacturing operations in Finland, Sweden, and the United States. The company has been making a wide range of machinery used in acute care since the 1900s. The company has a history of world firsts, beginning with its development in 1924 of the first four-gas anesthesia machine in collaboration with the Mayo Clinic. The company also created the first post–iron lung ventilator. Today, Datex-Ohmeda’s product line includes patient monitors and networked systems for anesthesia, intensive-care units, and subacute care, as well as anesthesia machines, ventilators, drug delivery systems, pulse oximeters, and supplies and accessories.
Figure 7-3 Datex-Ohmeda Strategy Map
Its legacy of product innovation worked well for Datex-Ohmeda, but in recent years, as the company faced toughening competition from companies such as Philips, Siemens, and Drager, it needed to offer its customers something more. Datex-Ohmeda realized that developing and maintaining long-term customer relationships—something it had always naturally excelled at—needed to become the key to its future success.
Organizational alignment, always difficult in a global enterprise, was a particular challenge for Datex-Ohmeda because most of the company’s factories and business units had been acquired through mergers, and already had established ways of doing things. Historically, Datex-Ohmeda operated a collection of fairly independent business units and sales channels. The goals of these different entities often conflicted or diverged. In the summer of 2001, Datex-Ohmeda executives finalized their strategy, using the strategy map to crystallize their thinking. Their planning sessions confirmed the wisdom of the company’s transition from a strategy based on innovation to one focused on customer relationships. Datex-Ohmeda’s new value proposition was to provide the right solutions for customers based on thoroughly understanding their needs. This also meant focusing on ongoing support and the ease of doing business through customer-focused processes. The strategy map describes these new directions.
The financial perspective of Figure 7-3 shows two revenue growth objectives: acquiring new customers (F2) and expanding relations with existing customers (F3). Datex-Ohmeda would achieve the F3 objective by delivering “team-designed solutions” (C1) based on the breadth of its product line. Objectives for two internal processes describe how this value proposition will be created and delivered: A customer management objective (P9) defines the process of teamwork across Datex-Ohmeda, as well as with its channel partners; objective P4 defines the innovation required to “develop and manage platform-based solutions throughout their life cycles.” These two internal process objectives, in turn, create the demand for organizational capabilities and culture that would promote the development of new human and informational capital, and strong networking and teamwork across lines of business and national boundaries.
Datex-Ohmeda’s learning and growth objectives, organized under the heading “Continuous Learning and Improvement,” align the intangible assets with the strategic priorities. Objectives L1, L2, and L3 describe the organization capital required for implementing the new strategy. Objective L1 identifies the need for consistency in decision-making processes required for a platform product strategy. Objective L2 defines the need for teamwork required by the team-solutions strategy. Objective L3 focuses on the process of alignment with the strategy at the individual level. The strategy map addresses the human capital needs (“right skills, right place, right time”) of the new strategy in objective L4. The details of these requirements will be described in lower-level human resources plans. Objectives L5 and L6 focus on the information capital requirements, with particular emphasis on knowledge sharing across the organization.
Thus, by using strategy maps, the groups that manage the organization’s most important intangible assets become tightly aligned to the organization’s strategy. The strategy map provides the framework for aligning human, information, and organization capital to the strategy, with sufficient specific detail to be meaningful, measurable, and actionable.
ALIGN AND INTEGRATE INTANGIBLE ASSETS
In The Strategy-Focused Organization, we described the case of a global bank that attempted to implement a new strategy.3 The bank’s differentiation strategy was to offer innovative and sophisticated financial products and services to global customers (corporations) that could be accessed seamlessly from any location around the world. The strategy failed when the complex information technology required to implement this strategy was not deployed in a timely or effective fashion. When questioned about the performance of the information services (IS) business unit, however, the CEO replied that this unit was performing well, according to its Balanced Scorecard. But the IS unit had built its scorecard by benchmarking the performance of the IS units it believed were the best in the world. It adopted the metrics used by “high-performing” information services groups. According to these metrics, the bank’s IS unit was now “world class,” performing comparably to its top-tier benchmarked peer group. The IS unit, however, while performing well against externally determined metrics, had failed miserably to deliver the services vitally needed for the bank’s new strategy. Because of this lack of alignment, the business unit and the bank’s strategy could not be implemented and eventually failed. The bank’s experience is a classic lesson on the consequences from not aligning a functional unit’s strategy and scorecard to entity objectives.
The strategy map (see Figure 7-1) creates alignment and integration by providing a common point of reference for the enterprise strategy. The internal perspective of the map identifies the critical few processes that create desired outcomes for customers and shareholders. The intangible assets must be aligned to these value-creating internal processes. We have used three alignment techniques to establish a bridge between the strategy map and intangible assets.
- Strategic job families: For each strategic process, one or two job families will have the greatest impact on the strategy. By identifying these job families, defining their competencies, and ensuring their development, we can accelerate strategic results.
- Strategic IT portfolio: For each strategic process, specific IT systems and infrastructure support implementation. These systems represent a portfolio of technology investments that should receive priority in funding and other resources.
- Organization change agenda: The strategy requires changes in cultural values, both internally focused (for example, teamwork) as well as external (for example, customer focus). An agenda of cultural change, derived from the strategy, helps shape the development of the new culture and climate.
Companies, by developing, aligning, and integrating their human, information, and organization capital to the critical few strategic processes, create the greatest returns from their intangible assets.
Take the example of Consumer Bank (see Figure 7-4). Its strategy map defines seven strategic themes, one of which is “Cross-sell the Product Line.” The human resources executive at Consumer Bank owns the process for developing the human capital required to support the strategy. Human resources and line executives, at a planning workshop, identified the “financial planner” as the job most important to the cross-selling process. The workshop further identified four competencies as fundamental to this job—solution selling skills, relationship management, product line knowledge, and professional certification.
Similar work with Consumer Bank’s information technology executive led to specific objectives for the information capital (networks, data, and knowledge) to support the strategy. Information technology and line executives identified four technology priorities—a financial self-planning model, a customer profitability system, an integrated customer file, and Web-enabled access by customers.
Figure 7-4 Linking Intangible Assets to the Strategy at Consumer Bank
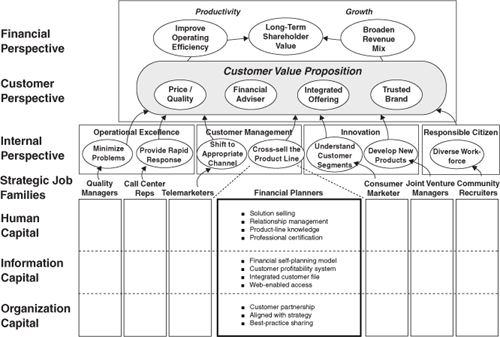
Finally, Consumer’s executive team established three priorities for organization capital: a culture based on partnerships with customers, alignment of employees’ personal objectives to the strategy, and improved teamwork to promote best-practice sharing.
By using the strategy map as its point of reference, the HR and IT executives at Consumer Bank narrowed the focus of their activities to a small number of processes (seven) that were decisive for the success of the strategy. Each of these constitutes a strategic theme. They could now identify a focused set of strategic jobs and information systems that would drive performance of the critical processes. This focus became the link between their functional responsibilities and the strategy of the enterprise. And the clear focus and alignment to the strategy simplified their jobs. They could now work intensively on the “critical few” instead of reacting broadly and diffusely to the generic multitude of issues that bombarded them on a daily basis.
The seven strategic themes provide the building blocks for the strategy and describe how the strategy will be implemented. If each of these themes is executed, the bank should create sustained value for its shareholders. A new customer base will be created, new products launched, a solutions-selling interface installed, improved quality perfected, and a diverse workforce developed that reflects community values. The seven strategic themes cross organizational boundaries and force an integrated approach to strategy. Responsibility and accountability for the strategy get organized around these strategic themes, not around traditional departmental or functional objectives.
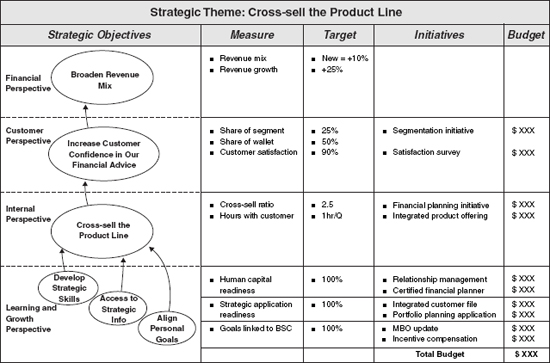
Figure 7-5 describes the plan for the “cross-selling” theme. Successful cross-selling requires an increased level of customer confidence in the bank’s financial advice. If a customer’s confidence increases, the bank should get an increased share of the customer’s business, which generates greater revenue growth and a broader revenue mix. The cross-selling process depends on its intangible assets—strategic skills, information, and alignment. For each of these interrelated objectives, the plan identifies the measure, the target, the initiatives required to achieve the target, and the investment required to perform the initiative.
This plan has all the information required to execute the strategic theme. Most important, it defines the combination of intangible assets required to support the strategy and create value. Human resources, information technology, and organizational incentive programs are aligned to the strategy, and the desired integration among them is specified. Economic justification of these strategic investments can be performed, but not in traditional ways. The common approach is on a stand-alone basis: “Show the ROI of the new IT application,” or “Demonstrate the payback from the HR training program.” The strategic program plan in Figure 7-5 shows how all IT and HR programs combine to create a collective financial payoff—revenue growth of 25 percent—from the strategy. Specific human capital, information capital, and organization capital initiatives, each requiring investments in people and cash, are needed to achieve this revenue growth. But each investment or initiative is only one ingredient in the bigger recipe. Each is necessary, but not sufficient. Economic justification is determined by evaluating the return from the entire portfolio of investments in intangible assets that will deliver the ROI from enhancing the cross-selling process.
Figure 7-5 Action Planning for a Strategic Theme at Consumer Bank
MEASURE INTANGIBLE ASSETS
At first glance, it seems daunting to measure assets—employee capabilities and alignment, information technology, and organizational climate and culture—that are defined by their intangibility, but some measurement principles seem clear. Intangible assets should not be measured by how much money was spent to develop them, nor should their value be determined by independent appraisals of the capabilities and value of HR and IT assets. The value of intangible assets comes from how well they align to the strategic priorities of the enterprise, not by how much it costs to create them or how much they are worth on a freestanding basis. If the intangible assets are closely aligned to the strategy, they will have greater value to the organization. The converse is also true; intangible assets that are not aligned to the strategy will not create much value, even if large amounts of money have been spent on them.
For measuring intangible assets, perhaps we can learn from the principles used in a company’s balance sheet to measure the organization’s tangible and financial assets. Accountants organize the asset side of the balance sheet by categories, such as cash, accounts receivable, inventory, property, plant, and equipment, and long-term investments. Assets are ordered hierarchically, by their degree of liquidity, the ease with which the asset can be converted to cash (see Figure 7-6). Accounts receivable is more liquid (quicker conversion to cash) than inventory, and both accounts receivable and inventory are classified as short-term assets since they typically convert to cash within twelve months. Long-term assets, as their name suggests, take longer to return the amount invested in them back to cash. For example, property, plant, and equipment (PP&E) provide a capability for converting raw materials to finished goods inventory, which gets sold, becomes accounts receivable and, eventually, cash. But many cycles of such conversion are required before the initial investment in PP&E is recovered.
Figure 7-6 Framework for Measuring Intangible Assets
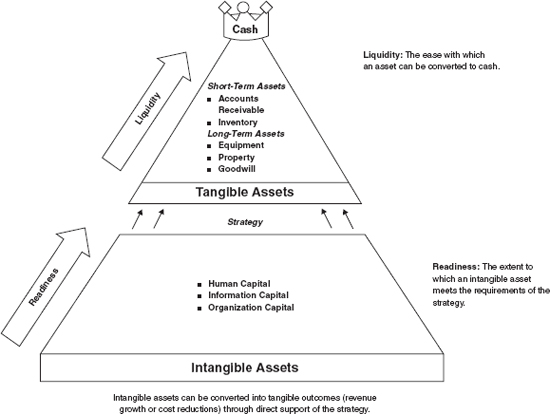
The strategy map framework enables human, information, and organization capital to be represented as assets that eventually get converted into cash, the ultimate liquid asset, through higher sales and lower spending. We introduce the concept of strategic readiness to describe the status of intangible assets to support the organization’s strategy. Strategic readiness is analogous to liquidity—the higher the state of readiness, the faster intangible assets contribute to generating cash.
Strategic readiness gets converted into tangible value only when internal processes create increased levels of revenue and profit. An organization cannot possibly assign a meaningful financial value to an intangible factor like a “motivated and prepared workforce” because tangible value can be derived only in the context of the strategy. It is possible from the financial perspective of the strategy map to state that successful execution of the strategy is worth some amount in revenue growth and another amount in shareholder value. A workforce that has achieved satisfactory levels of strategic readiness is one, but only one, of the factors that enable such revenue growth or shareholder value creation to be achieved. Thus, the readiness of the human capital intangible asset is a necessary but not sufficient condition for strategic success.
For example, in Figure 7-4, Consumer Bank identified four specific competencies for its financial planners to support the strategic internal process “Cross-sell the Product Line”:
- Solution selling
- Relationship management
- Product-line knowledge
- Certification as a licensed financial planner
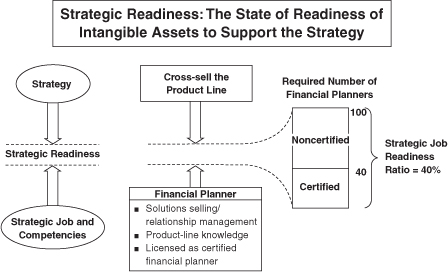
Consumer Bank needed to measure the readiness of its existing staff of financial planners for this internal process. Assume that 100 financial planners are required to execute this strategy. Consumer Bank used rigorous testing to determine that as a result of targeted hiring, training, and development programs, forty of its financial planners have reached a level of proficiency sufficient to execute the cross-selling objective (see Figure 7-7). Since 100 individuals are required to execute the strategy, the bank’s human capital readiness for this piece of the strategy is only 40 percent.
Figure 7-7 Measuring the Strategic Readiness of Human Capital
The measurement of intangible assets can use a cascading model, similar to that used in a balance sheet for the organization’s tangible and financial assets. The top level, the balance sheet (level 1), describes the different classes of assets, ranked by liquidity; for example, cash, accounts receivable, inventory, property, plant, and equipment. The next level (level 2) describes the portfolio of assets within a specific class. For example, the accounts receivable asset consists of several subcategories, such as:
- Current (less than thirty days)
- Overdue (thirty to sixty days)
- Overdue (sixty to ninety days)
- Overdue (more than ninety days)
Similarly, the inventory account can be broken into subcategories of raw materials, work in process, and finished goods. The assets in each of the subcategories have a different degree of risk. Finally, a third level describes specific assets (for example, John Smith owes $5,290 and is thirty to sixty days overdue; the company owns $6,000 worth of a particular purchased item or grade of steel).
Extending this balance sheet model to intangible assets, level 1 provides aggregate information on three categories: human capital, information capital, and organization capital. Level 2 describes information on how each intangible asset relates to its targeted internal processes, and level 3 describes characteristics of individual intangible assets.
These ideas are illustrated in Figure 7-8, which shows the level 2 detail for human capital assets at Consumer Bank. The figure provides a comprehensive view of the state of readiness of Consumer Bank’s human resources to deliver on its new complex strategy. The company has identified the specific job families expected to drive performance improvements for each strategic internal process. For example, the financial planner is the most important job category for the cross-selling process, while the call center representative is most important for the rapid response process. Consumer Bank needs to ensure that it has a sufficient number of people, within each of the seven strategic job families, with the right skills to support the associated internal process. As shown in Figure 7-8, the bank is in good shape for its two operations management processes (100 percent and 90 percent readiness), but deficient in its human capital capabilities for the two customer management processes (only 40 percent and 50 percent readiness) and one of the innovation processes (20 percent readiness). The level 1 aggregate measure of 65 percent human capital readiness (in the red zone) is a weighted average of readiness across the seven strategic job families.
Level 3 measures identify the capabilities of specific individuals—their qualifications for their strategic roles. Individual capabilities, compared to the category requirement, are the basic building blocks for measuring the organization’s human resources assets. Individuals’ capabilities get aggregated into level 2 and level 1 descriptions to produce a broader portfolio picture of the strategic readiness of all the organization’s human resources assets.
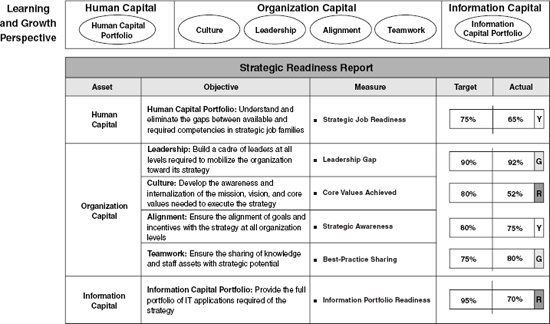
A similar decomposition can be done for the three levels of the organization’s information capital and organization capital. Figure 7-9 provides a sample Strategic Readiness Report, which gives a consolidated snapshot of the ability of each class of intangible asset to fulfill its strategic role. Just as a military organization constantly assesses the availability of trained manpower, equipment, ammunition, intelligence, and logistics relative to requirements as a measure of mission readiness, organizations must assess the status of the six intangible assets in Figure 7-9 as their indicators of strategic readiness. The organization illustrated in the figure has major deficiencies in the readiness of its IT systems to support the strategy. The education and incentives for the workforce to orient the culture in new directions are also lagging. These would both present formidable barriers to the execution of strategy.
Figure 7-8 Human Capital Readiness: The Portfolio View
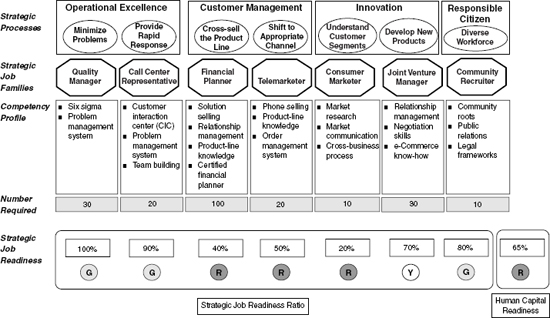
Figure 7-9 Strategic Readiness Report
SUMMARY
The Strategic Readiness Report consolidates the essential elements of our approach to managing intangible assets:
- Define the asset
- Align it to the strategy
- Measure the degree of readiness
In the remaining chapters of this part, we describe approaches to defining and measuring the readiness of the three sets of intangible assets—human capital, information capital, and organization capital. The case study following this chapter describes the situation faced by Crown Castle, in which the company had to change the culture from a collection of independent acquisitions to an integrated company that gained synergy from leveraging capabilities from its multiple properties.
NOTES
1. Thomas A. Stewart, “Brainpower,” Fortune, 3 June 1991, 44.
2. Thomas A. Stewart, Intellectual Capital: The New Wealth of Organizations (New York: Doubleday, 1998), 67.
3. Robert S. Kaplan and David P. Norton, The Strategy-Focused Organization: How Balanced Scorecard Companies Thrive in the New Business Environment (Boston: Harvard Business School Press, 2001), 163, 165.
CASE STUDY
CROWN CASTLE INTERNATIONAL, INC.
Background
Crown Castle International is a leading global provider of shared wireless communications and broadcast infrastructure. It rents towers, leases antenna space, and provides broadcast transmission service and related services to a “who’s who” of wireless providers and broadcasters, including British Telecom, Verizon, Cingular, Vodafone, T Mobile (Deutsche Telekom), and the British Broadcasting Service (BBC), for whom the company provides full television transmission services. Crown Castle serves more than two-thirds of the U.S. markets and more than 90 percent of the British and Australian populations. Total revenues for 2002 were $901.5 million.
The Situation
Crown Castle’s growth paralleled the wireless digital boom of the mid-1990s; from 127 towers and 700 employees in 1995, the company today has grown to more than 15,000 towers and 2,000 employees. When Crown Castle went public in 1998, its strategy was simple: an intensified “land grab.” By acquiring strategically located towers for lease and offering outsourced services, the company could help its telecom customers achieve speed to market. Once it met its fixed costs, revenues would become pure cash flow. Early on, this formula produced successful results; but when the capital markets began to tighten and the predicted 75 percent margins didn’t materialize, the executive team realized that the growth-through-acquisitions strategy had run its course.
The Strategy
In June 2001, Crown Castle rolled out a new strategy—operational excellence—along with its Balanced Scorecard initiative. The company now sought to maximize return on existing assets, realize greater efficiencies, and reap economies of scale by offering such value-added services as equipment maintenance. John Kelly, who became CEO in August 2001, led the company through its transformation, fully aware that in an industry as fluid as telecommunications, Crown Castle would have to adapt its strategy, and thus its scorecard, periodically. In 2002, the company decentralized its management structure to produce more detailed data and knowledge about its core assets, transmission towers. The increased knowledge would be the key to achieving operational excellence across three continents.
Strategy Map
Though operational excellence was present in Crown Castle’s initial strategy map, the map still represented its former acquisitions strategy. By early 2003, the company had revised the map, with input from district-level employees, to better reflect its operational excellence strategy and new, decentralized approach. The team sharpened objectives in the internal perspective, cleansed the map of vague “corporate-speak,” and reconfigured cause-and-effect relationships. The result: a more granular, unambiguous strategy map that would guide Crown Castle’s far-flung workforce in executing strateg (see Figure 7-10).
Financial Perspective
Crown Castle would achieve revenue growth through two objectives aimed at boosting returns from existing assets: increase recurring revenue, the annuity income from leases, and increase installation margin, a source of higher-margin revenue. On the productivity side, the company sharpened its asset utilization objective to reduce accounts receivable (A/R), unbilled revenue, and work-in-progress (WIP).
Customer Perspective
Crown Castle has two types of customers: wireless operators and broadcasters. Anticipating no new customer segments and few new marketplace entrants, the company identified partnership as its customer value proposition. “If the customer has to roll out 1,000 sites this year, they want to know they have a business partner with the right infrastructure and time-to-market capability,” notes Robert Paladino, senior vice president of global performance. Customer research revealed that speed to market should replace an earlier objective, good to do business with. Quality, another added objective, referred not only to the general concept but also to regulatory compliance (for example, number of on-time minutes of transmitter time). For the BBC, its primary broadcast customer, the objective for fulfilling customer needs became meet site license agreements (SLA) requirements.
Figure 7-10 Crown Castle Strategy Map
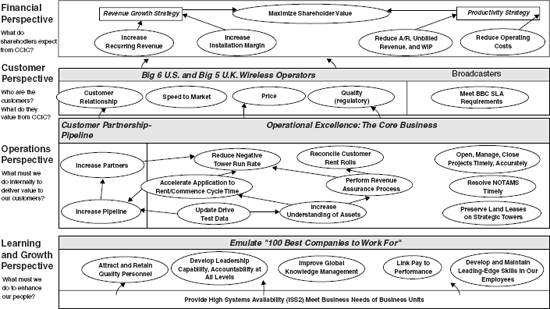
Operations (Internal Process) Perspective
“By knowing our assets better and making better process improvements, we can better serve our customers,” says Paladino, explaining the crux of the company’s operational excellence strategy and the rationale for this perspective’s supporting theme, customer partnership. Increase understanding of assets was a foundation of the new strategy. The company could better serve its customers and maximize tower performance by having more and better data about its towers, such as available space, engineering specifications, and customer usage. Several objectives within this perspective were modified from high-level statements (such as establish/improve core capabilities and support processes to maximize efficiencies) to more actionable objectives, such as resolve NOTAMS [trouble tickets] in a timely way. Paladino noted that “selected, specific processes we must measure are now on the strategy map.” This heightened specificity helped to standardize operational procedures throughout the company, making the strategy map more useful to district managers. Similarly, amaze customers in each interaction became clarified as accelerate application to rent/commence cycle-time. The new objective was more specific and addressed customers’ main concern. The new objective supported reduce negative tower run rate (lower-performing towers) as well as increase the pipeline (the number of new applications for potential tenants).
Learning and Growth Perspective
In its theme emulate Fortune magazine’s “100 Best Companies to Work For,” Crown Castle sought to create a superior working environment for its employees. Most notable of the learning and growth objectives was the central objective to improve global knowledge management. Early in 2003, Crown Castle made a giant stride by launching a knowledge management system that would become a repository of best practices and performance standards for key processes. It delineated processes, such as site inspections, at the task level through video clips and documentation. The knowledge management system was a direct outcome of Crown Castle’s BSC. Paladino stated, “We moved from getting data, to understanding information, to gaining knowledge that we could act upon.” Supporting the entire learning and growth perspective was the information systems and services objective; instead of focusing solely on the latest e-business system, the company now gave equal weight to the service and solution aspects of enabling technologies.
Results
Paladino credits Crown Castle’s Scorecard and strategy map with helping the company thrive in a market environment so punishing that two of its four competitors declared bankruptcy. Indeed, its aggressive management of expenses and capital—the essence of its productivity strategy—propelled cash flow from negative to positive, representing improvements of several hundred million dollars. These financial gains have allowed Crown Castle to undertake major initiatives with confidence: fulfilling the U.K. government’s mandate to convert television transmission to digital; and establishing Freeview, a joint venture providing free digital television with thirty new channels throughout the United Kingdom. Crown Castle is a member of the Balanced Scorecard Hall of Fame.
_______________
Case prepared by Janice Koch of Balanced Scorecard Collaborative and Robert Paladino of Crown Castle. Our thanks to John Kelly for sharing the Crown Castle experience.