In This Chapter
Adding a bit of Team Management
Doing a bit of forecasting
Reporting on your progress
Working with Workflow
Most of this book covers functionality that you can get free with the Community Edition of Sugar. However, you may want to consider upgrading to a fee-based version of Sugar — particularly if your business consists of many users and requires a bit more organization than does a smaller business. In this chapter, I focus on four features available only in the Professional and Enterprise versions of Sugar: Team Management, forecasting, reporting, and Workflow.
A team is a group of individuals who band together for a common goal. In Sugar, the Team Management option allows you to group users into teams — hopefully for the purpose of winning sales and satisfying customers. You can assign Sugar records, such as Accounts, Contracts, and Opportunities, to a specific team; once assigned, those records can only be accessed by members of that team.
By default, a private team is set up for each user and contains only that specific user. Sugar also sets up a Global team, which automatically includes all users. Any new records you create are automatically assigned to your team and, therefore, are visible only to you — unless you add other users to your private team or assign the record to a different team.
Tip
Because new records are assigned by default to your private team, it's good practice to set up teams prior to adding new records. However, should you find yourself with lots of records that need to be reassigned to a different team, don't forget about the mass update feature on the various Home pages that allows you to make all those changes en masse.
Here's how you can get the ball rolling and create a winning team:
Click the Admin link from any Sugar screen and then click Team Management from the Users subpanel of the Administration Home page to open the Teams Home page.
Because creating and maintaining a team is a function of the coach, er, database administrator, it's only logical that you manage your teams from the Administration Home page.
Choose Create Team from the Shortcuts menu of the Teams Home page.
The Teams page opens. See it for yourself in Figure 14-1.
Fill in the team information.
There's really not much to do here other than to assign a team name and an optional description so don't rack your brain trying to come up with a mascot or team colors.
Click Save.
The Teams Home page appears — with your team on the roster.
Click the Select button at the top of the Users subpanel.
The User Search window opens. From here, you can search for a specific user or simply scroll through the list of users and select the one(s) you want to add to the team by selecting their check box.
Click the Select button.
The selected users are now proud members of the team.

E-mail is a great way to communicate. So great, in fact, that you might find yourself bombarded by lots and lots of e-mail — and lose an important message or two in the bargain. Using Team Notices, the database administrator can create broadcast messages to the members of the team. When the members log in to the database, they'll see the announcements on the Team Notices dashlets of their Home page.
Here's all you need to know to set up a team announcement:
Click the Admin link on any Sugar screen and then click Team Management in the Users subpanel of the Administration Home page to open the Teams Home page.
Choose Team Notices from the Shortcuts menu of the Teams Home page.
The Team Notices Home page opens.
Choose Create Team Notice from the Shortcuts menu of the Team Notices Home page.
The Team Notice form opens.
Fill in the pertinent information.
You are, after all, creating an announcement so include all the appropriate who, what, when, where, and whys. Figure 14-2 gives you an idea of what a Team Notice form looks like.
Click Save to save the announcement.
The announcement will be visible to all the group members the next time they access their Home page.
Sure beats the heck out of a bulletin board — and you don't have to search for a thumbtack!

Nothing's worse than hearing the entire office discuss an upcoming event — and not being sure if you're expected to attend! After your administrator has set up teams, check the roster to determine whether you made the cut.
If you find yourself unsure about your team status, there's an easy way to find out your eligibility. Click My Account from any Sugar view and then scroll to the My Teams subpanel. Any groups you're a member of are listed there. And, if you really want to feel like you're a member of the in-crowd, click a group name, and you'll be able to view a list of all the other group members.
Chapter 7 focuses on the Opportunities module. The Forecasts module allows you to create quotas for your sales force — and measure its performance based on actual sales and opportunities.
Warning
Forecast records are based on sales opportunities. Only those users who are listed as the assigned user of an Opportunities record can include the opportunity in a sales forecast.
A Forecast record consists of four parts:
Time Period: A forecast is based on a time period. You can use traditional periods — months, quarters, or years — or you can define a custom period, such as a week or specific period.
Forecast Schedules: After you set up a few time periods, you can create schedules by assigning a specific time period to various teams of users. For example, the region sales teams may have a monthly schedule, and the corporate sales team may have a quarterly schedule.
Sales Quotas: The next step in the process is to set up sales quotas, or the amount of sales an individual is supposed to close during the given time period.
Forecast Worksheet: The Forecast Worksheet reflects what sales people think they can produce in sales.
Warning
The first three steps of the forecasting process are performed by your friendly neighborhood database administrator. The final step — the Forecast Worksheet — is performed by the lowly worker ant.
Tip
After you create a Forecast record, you can add the My Forecast dashlet to your Home page so that you see it every time you log in to Sugar. You'll see a visual comparison of your quota along with your closed opportunities and committed forecast. Not sure how to add something to your Home page? Take a peek at Chapter 9.
Time flies when you're having fun, and the administrator has the task of defining the Time Periods that will be used company-wide. For added fun and enjoyment, the administrator can also define the fiscal year for the company. After the administrator defines the time periods, the periods automatically appear in the Forecasts module where they can be attached to a forecasting schedule.
Follow these steps to create time periods:
Click Admin from any Sugar view and then click Time Periods in the Forecast subpanel.
As you might expect, the Time Periods Home page opens.
Choose Create Time Period on the Shortcuts menu.
The Time Period form page opens.
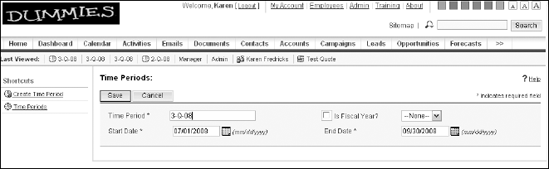
Enter the appropriate information about the Time Period.
As shown in Figure 14-3, this doesn't involve much contemplation on your part. Enter a name for the Time Period, and then indicate a Start Date and End Date. If the Time Period corresponds with the Fiscal Year, feel free to select the Is Fiscal Year check box.
Click Save to save the Time Period.
You are now free to roam around the cabin — or start working on those schedules.
After you create a Time Period or two, it's time to scurry around creating schedules. Fortunately for you, there's not much involved in the process so you should be able to perform this feat in a small amount of time.
To create a Forecast Schedule:
Click Admin from any Sugar view and then click Time Periods in the Forecast subpanel.
The Time Periods Home page opens, this time with your Time Periods prominently displayed.
Click the name of the Time Period you want to include in a schedule.
The Time Period Detail view opens with a chime. Okay, maybe I'm just hearing things, but all this talk about time might have you envisioning a row of ringing alarm clocks.
Scroll to the Forecast Schedule subpanel and click Create.
The Forecast Schedule page opens.
Fill in the timely information.
Again, it won't take you much time to create the schedule information. Indicate when the schedule will start, whether it's active, and specify the person for whom you're creating the schedule. Figure 14-4 shows you the finished product. You can select the Cascade option if you want this information to roll into other user's information that it relates to.
Warning
The forecast start date determines the information you'll see in the Forecast Worksheet. Generally, you want to set a date prior to the actual period so users can access the Forecast Worksheet prior to the Time Period.
Click Save to save the Forecast Schedule.
Any schedules that you create will appear in the Forecast Schedule sub-panel of the Time Periods Detail view, as shown in Figure 14-5.


After you create Time Periods and then use them to create Forecast Schedules, you're ready to start setting up sales quotas for your users.
Warning
Time passes — at times too quickly. As time goes by, you have to continue to create new Time Periods and schedules. An administrator's work is never finished!
Here's how to quickly set up a Quota:
Select the Forecasts module from any Sugar screen.
The Forecasts Worksheet opens. If you're using the Forecasts module, you'll see quite a bit of this page in the future.
Choose Quotas from the Shortcuts menu.
Choose a Time Period from the drop-down list on the Quotas Home page.
You can see why you need to set up those Time Periods prior to setting Quotas. After you select a Time Period, any existing Quota records for that period will display in the Quota List subpanel.
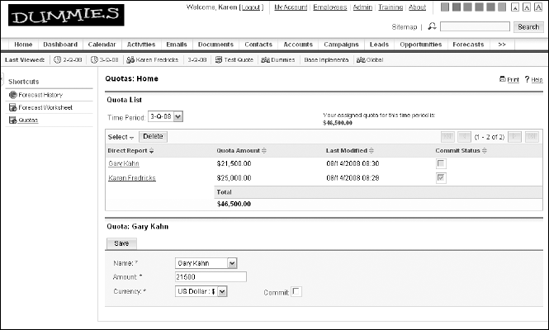
Fill in the new Quota information.
Although forecasting requires many steps, the steps are baby ones. In this case, you just need to choose a user from the drop-down list, fill in a quota amount and the currency you're using, and select the Commit Status check box to show that the Quota is Active. If you don't select Commit Status, the Quota will show as Pending. Figure 14-6 shows an example of a Quotas Home page.
Click Save to save the Quota.
Warning
The cool part here is that various users can access different quota information. For example, a sales rep can only see his Quota record, whereas a manager can change the Quota record. Feel free to flip ahead to Chapter 16 for a bit more about role management.
The Forecast Worksheet is the icing on the cake — and the final stage of the Forecast process. Sugar automatically takes Amount, Probability, and Weighted Amount information from your opportunities and plunks them into the worksheet. You add your best-guess estimates for what you think you can sell and sit back and let Sugar calculate everything for you.
To edit the Forecast Worksheet:
Click the Forecasts module tab from any Sugar view.
The Forecasts Worksheet appears.
Choose the Time Period from the Time Periods drop-down list.
If you logged in as a regular user, you see only your data, and your Quota appears at the top of the page. If you logged in as a user with higher access privileges, you see data for the other users who report to you; you then have the option to view their specific information or a combined worksheet consisting of several users. Figure 14-7 shows you an example of a "rollup" worksheet that you'll see if you log in with higher access privileges.
Enter the Estimated Best Case, Likely Case, and Worst Case forecasts.
Sugar follows along and updates the Totals row for you.
Commit the amounts by clicking the Copy Values button, selecting Total Estimated Amounts, and then clicking the Commit button.
Click OK in the dialog box that appears.
The committed amounts appear at the bottom of the worksheet along with the date that you entered the totals.
Click Save Worksheet to save your changes or Reset Worksheet if things don't look right and you want to try again.

The whole purpose of the Forecast Worksheet is to compare the actual sales to a pre-determined Quota. The worksheet enables sales managers to track sales for a specific Time Period by user, and allows users to see how they are measuring up to their Quota.
Charting your progress
The Rollup view accessed by a manager (refer to Figure 14-7) allows you to enter best- and worst-case sales scenarios. The manager can then click the View Chart button and view the chart, as shown in Figure 14-8.
The chart is a comparison of data that you've entered in a variety of Sugar modules:
Tip
If you're in the Rollup view, the chart portrays the totals of all the users. If you click a specific user's name in the Forecast Worksheet, the chart displays only that user's information.

Supercharging your Forecast Worksheet
At this point, most sales managers might think they've died and gone to heaven. However, Sugar has one more forecasting trick up its software sleeve — the ability to view more detail via the Forecast Worksheet.
If you are a manager, the Forecast Worksheet will list the various users in your sales department. And, you can drill down to garner more information on any one of them by simply clicking a name in the left pane of the Forecast Worksheet. The worksheet refreshes and provides you with a list of the user's current opportunities, similar to what's shown in Figure 14-9.

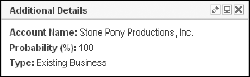
Optionally, you can provide estimated Best Case, Likely Case, and Worst Case figures, although they will not "roll up" into the estimated figures for the user as a whole. The manager can also drill down on any specific opportunity that he wants to edit or view by clicking the down arrow next to the Opportunity name. A pop-up window similar to the one shown in Figure 14-10 opens, displaying the Account name, probability percentage, and type; click the pencil icon to edit the opportunity if needed.
Forecasting your history
Although the thought of forecasting history is a bit of an oxymoron, Sugar does provide you with a way to view your forecast history from prior periods.
Click the Forecasts module tab from any Sugar view and then choose Forecast History from the Shortcuts menu.
The Forecast History Home page opens. You'll notice a Committed Forecasts subpanel.
Choose the Time Period you'd like to review from the Time Periods drop-down list.
Select either My Forecasts or My Team's Forecasts and then click Search.
A summary of the past forecast displays in the Committed Forecasts Search subpanel and shows the committed amounts, Time Period, and the number of opportunities for that period.
The information that you put into a database is only as good as the information that you can pull out of it again. Although you might not be a proponent of using reams of paper to print out myriad reports, you'll probably want to at least view some simple information online.
The Reports module allows you to create, view, and edit reports on a variety of exciting topics including accounts, contacts, and opportunities.
Both the Professional and Enterprise versions come equipped with lots of reports. You might consider taking a peak at them before jumping in head-first and creating more reports "from scratch."
Tip
Need a new report in a hurry? You can always use an existing one, make your changes, and then click Save As to save the report with a different name.
It will come as no shock to you that you find the Sugar reports nestled away in the Reports module. Running existing reports from the Reports module is a great way to find out about the various report filtering and display options.
Tip
You might notice the Add to My Favorites button. This will allow you to select a report and designate it as a Favorite. You can access your favorite reports by choosing the My Favorite Reports shortcut from the Reports home page. You can also add a favorite report dashlet to your Home page for even easier access to the reports you run the most often. Chapter 9 shows you how to add items to your Home page.
The two basic types of reports are
Rows and Columns: This is the typical report format; each column has a header reflecting one of your Sugar fields and the rows contain the corresponding data pulled from your records. For example, you might create a contact report with such columns as Name, Address, City, State, Phone, and E-mail, and then thousands of rows each containing the appropriate information from every one of your contacts.
Summation: This type of report generally includes totals, such as sum, average, or count of the items reflected in the chart. Summation reports work particularly well when you're trying to group various data into individual categories. Optionally, a summation report can include a chart.
A Rows and Columns report displays information in rows and columns with the columns reflecting the fields that you choose to display in the report.
Here's how to take a look at an existing report:
Click the Reports module tab from any Sugar view.
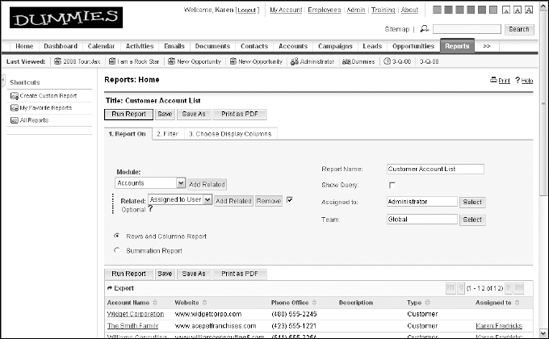
The Reports Home page opens, providing a list of the current Sugar reports. Notice in Figure 14-11 that the administrator created all the reports and assigned them to the Global team, which means that they are viewable by all the Sugar users.
Choose the record type for which you want to create the report from the Module drop-down list.
Because many reports come with the Reports module and, over time, you might add lots more, you might want to narrow your options. You can also narrow your options to include a specific Report Type, such as Rows and Columns — the type of report you're focusing on.
Click the name of the report you want to run.
Although this page is still labeled the Reports Home page, as you can see in Figure 14-12, it differs slightly from the real Reports Home page. This Home page includes three tabs that help you customize your report. The report information appears at the bottom of the screen.
Select your basic report options and then click the Filter tab.
You have a number of options here:
Report Name: It's always a good idea to give a report a name that means something to you.
Module: Reports are based on a primary Sugar module; if necessary, you can add other related modules as well.
Related: Displays a list of the related modules, which you can then delete or change if necessary.
Show Query: Administrators can use this option to show the query on which the report is based.
Assigned To: The person in charge of the report or the person you go to if the report doesn't work correctly.
Team: The users who are allowed to view the report.
Rows and Columns or Summation: Use this option only if you want to change the format of the report entirely.
Select your filtering options and then click the Choose Display Columns tab.
You then specify additional filters to narrow the data based on the modules you select. For example, if your report is based on the Contacts module, you can filter the report to contacts that are located in a specific state.
Choose the columns you want to display in the report.
Again, you can select columns based on the modules that you included in your report in Step 4. Select a field name from the Module column list and then click the left-pointing arrow to move the field to the Display Columns list.
Tip
If you select a field in the Display Columns list, you'll see the column header that will appear on the report, which is generally way too long. For example, you might want to change the label Contacts: Primary Address Postal Code to a simpler Zip, like the example in Figure 14-13. To change it, delete the contents in the Label field and type the new and improved version.
Choose one of the following options when you're finished tweaking your report:
Run Report: Click this button to refresh the report any time you change any of the reports options.
Save: Click this button to overwrite the previous version of the report.
Warning
It's never a great idea to overwrite an "out of the box" report unless you're absolutely 100-percent positive that your version is superior to the original version. Using the Save As button is a much safer option.
Save As: Click this button to create a copy of the report with a new name.
Tip
Need a new report in a hurry? You can always use an existing one, make your changes, and then click Save As to save the report with a different name.
Print as PDF: Click this button to print the report in PDF format.


If you've ran a Rows and Columns report — and understand the various options — you're well on your way to running a Summation Report. The first several steps are identical, but I repeat them for you just in case:
Click the Reports module tab from any Sugar view.
Choose the record type for which you want to create the report from the Module drop-down list.
Click the name of the report you want to run.
Because you're learning about Summation reports, your best option here is to pick a report that lists Summation as the report type.
Select your basic report options and then click the Filter tab.
So far, so good — you're in fairly familiar territory here. You see the same options that you see for the Rows and Columns report — except that you'll notice that there are now five tabs to choose from: a Group tab appears after the Filter tab and a Chart Options tab appears on the end. You'll also notice a chart at the bottom of the screen.
Select your filtering options and then click the Group tab.
Again, the filtering options are identical to what you see in the Rows and Columns report.
Specify the data grouping on the Group tab and then click the Choose Display Columns tab.
A nice benefit of Summation reports is that they allow you to group information in sections. You can add grouping information by clicking the Add Column button, choosing a module option from the Group By drop-down list, and then choosing a field from the drop-down list to the right of the module type. The field information will depend on the modules you select in Step 2.
Figure 14-14 shows an illustration of grouping case information by subject and then Account name, which would prove useful if you were trying to determine whether several people at the same company were all experiencing the same problems. If you select a date field, a third drop-down box appears that allows you to group by day, month, quarter, or year.
Indicate your display Columns and then click the Chart Options tab.
Although the process for adding columns to a Summation report is the same as that for a Rows and Columns report, your options are slightly different. Because the whole idea of a Summation report is to group like items together, you see options like AVG and Quarter, meaning you can show an average of your data and/or group your data by quarter. You also notice a Show Details check box under the Label field, which displays the details of the report in addition to — or instead of — a chart.
Indicate your Chart Options.
You have three pertinent pieces of information to add here:
Chart Type: You can have a horizontal bar, vertical bar, line chart, pie chart, or funnel chart type, or you can choose No Chart if you only want the summary information to appear.
Select Data Series for Chart: Choose an available grouping function, such as Count or AVG (average), from the drop-down list. Your choices will depend on the Group-By and Display Columns options you select in Steps 6 and 7.
Chart Description: Add a short description for the chart.
Choose an option to either Run, Save, or Print the report.
If you pick one of the chart options, the report displays as a chart complete with a legend. To hide the legend, click the down arrow. Place your cursor over a segment to see more information. If you chose the Show Details option, the details appear directly below the chart.

Warning
You can add custom charts to your Dashboard. For more information, head to Chapter 9.
After you have the hang of running and customizing reports, running them again is simple — just head back to the Reports Home page and select a report. However, if you want to automate the process even further, you can schedule to run a report at a specific time. Sugar runs the report and e-mails it to you. Talk about easy!
Here's how you can schedule e-mail delivery of your reports:
Click the Reports module tab from any Sugar view.
If you've already scheduled a report to run automatically, you will see the date and time that the report is scheduled to run. For now, you want to create a schedule, so None will appear next to any report not scheduled to run automatically.
Click None in the Schedule Report column of the report you want to schedule.
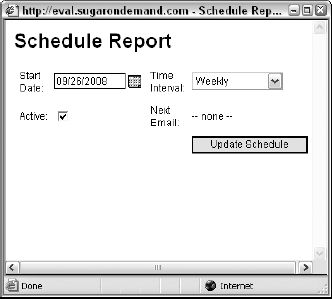
The Schedule Report dialog box opens, as shown in Figure 14-15.
Enter the scheduling information.
You need to add only a few items to create such a powerful tool:
Start Date: Select a date to begin the scheduling process.
Time Interval: Choose an interval to run the report; you can pick durations, such as daily, weekly, and every four weeks.
Active: Select the Active check box to get the show on the road. If you don't select this box, the schedule is not activated, and the Schedule Report column displays None.
Next Email: If you're editing an existing schedule, the date and time that you previously specified appear here.
Click the Update Schedule button.
You end up back at the Reports Home page where the next scheduled date and time appear in the Schedule Report column for that report. Sit back, relax, and wait to receive a copy of the report when it's scheduled to be delivered.
Workflow is the feature that sets apart the men from the boys. Workflow is the heart and soul of a true CRM product and probably the main reason you'll want to upgrade to the Professional or Enterprise version. Creating a Workflow allows you to track milestones, send out alerts, and take the appropriate action. For example, you might set up a Workflow to track warranty expiration dates; the customer will receive automatic notifications, which will stop when the customer either renews his contract or decides to discontinue the service.
The different stages of a Workflow can be assigned to different users of your organization. For example, in the above scenario, customer service might be in charge of sending the renewal notices, and accounting might be in charge of updating the customer's record. When one task is finished, the folks who are responsible for the next stage in the Workflow are notified.
A Workflow consists of five steps:
Creating a Workflow Definition, which is the key element of the Workflow.
Specifying the Workflow Conditions that trigger when the Workflow starts.
Creating an alert to let your users or teams know exactly what is going on.
Creating an action that you want to happen when an event triggers the Workflow.
Optionally specifying the Workflow Sequence if you have several workflow processes that might overlap.
Although the process for creating a Workflow is a bit long and involved, you'll no doubt find the time you save to be well worth the effort. Not only will you be automating your processes, you'll also be assuring that nothing "falls through the cracks."
The database administrator is the person who starts the Workflow process. Be nice to this person because he is going to be saving the rest of the people in the organization a lot of time! The Workflow Definition is actually a record in your database; and, as is the case with other records, you can relate various elements to it after you create it.
Here's how the administrator can get the ball rolling:
Click Admin from any Sugar view and then choose Workflow Management in the Developer Tools subpanel.
The Workflow Home page opens.
Choose Create Workflow Definition from the Shortcuts menu.
The Workflow Definitions form opens.
Fill in the Workflow Definition information.
When you finish, the final product looks similar to what you see in Figure 14-16.
You have only a few pieces of information to fill out:
Name: Enter a name for the Workflow.
Execution Occurs: Indicate the event that will trigger the Workflow. Your choices are When Record Saved, which means when a change is made to a record, or After Time Elapses, which means the action is triggered by the passage of time.
Status: Choose Active from the drop-down list to show that you want the Workflow to be usable. It's a good idea to set the status as Inactive until you've fully developed the Workflow to prevent it from triggering prematurely.
Target Module: Select the module to which the Workflow applies.
Applies to: Decide whether the Workflow will apply to new, existing, or both new and existing records. For example, a thank-you letter might apply to all Contacts records whereas a company introduction letter might only be sent to new Leads records.
Processing Order: Decides which comes first: an alert or an action. The deciding factor is whether or not you want Workflow changes to be included in an alert. For example, let's say that changing the status of an opportunity will automatically create a task to follow up with the contact for that opportunity. You'll want to let the Workflow create that task prior to notifying your salesperson that the task exists.
Description: Enter a brief description of the Workflow so you can remember what the darn thing is supposed to do.
Click Save to create the workflow.
Congratulations! You land in the Detail view of the Workflow Definition where you can move on to the next step in the operation!

The second stage in the Workflow process is to add conditions to the Workflow. You might think of this in terms of if and then; for example, if a new lead enters my database, then I am going to pester the heck out of him! The nice thing here is that you can add a variety of conditions. For example, if the lead becomes a contact, you might want to send a thank-you letter and add her to your newsletter mailing list; if you never touch base with the lead, you might continue to include her in your marketing campaigns.
Here's how you can start adding a few conditions:
Click Admin from any Sugar view and then choose Workflow Management in the Developer Tools subpanel.
The Workflow Home page opens.
Click the Workflow Definition record you want to add conditions to.
Scroll to the Conditions subpanel and then click Create.
A pop-up window appears.
Select the condition that you want to use to trigger the Workflow.
As you see in Figure 14-17, you have some nice options here. You might want something to happen when the contents of a field change — or when nothing changes during a given time period.
Indicate the field or module that the Workflow depends on, fill in the time parameter, and then click Save.
The choices here vary slightly depending on the condition you pick in Step 4.
Click Save to save your condition.
The condition now appears in the Conditions subpanel of the Workflow Detail view.
You can add as many conditions as you need to a Workflow. For example, you might want new leads in any one of six states to go to one salesperson, and new leads from a different set of states to go to a different salesperson.

You can send alerts as part of the Workflow process. For example, you might want to let your co-workers know that you're going to start a marketing campaign so that they can prepare for all those new orders. Or, perhaps you want to alert someone when a contract is about to expire, or that one of his key customers hasn't made a purchase in six months. The possibilities are endless!
Alerts arrive in the form of an e-mail. An alert can be based on a template, or you can create your own unique message in the body of the alert. You also create a recipient list of the people who will receive the alert.
Creating an Alert Template
If you think your alert will take the form of a template, then you'll want to create the template prior to creating the alert. This prevents you from having to edit the alert to add the template to it.
The nice thing about Alert Templates is that they can be recycled and used in multiple Workflows. For example, you might have a variety of Workflows directed at specific users when their customer information changes. However, you can use the same Alert Template for each of these Workflows.
Follow these steps to create an Alert Template:
Click Admin from any Sugar view and then choose Workflow Management in the Developer Tools subpanel.
Because Alert Templates are a part of the overall Workflow process, it's only natural that you return to the Workflow Home page to create one.
Choose Alert Email Templates from the Shortcuts menu.
Choose a module from the drop-down list and click Create.
The idea here is to tie the alert to the Workflow. If your Workflow revolves around new leads, select Leads as the module. If your Workflow involves contacting customers who haven't purchased from you in a while, select Contacts or Accounts.
Fill in the basic information on the Alert Templates page.
Keep in mind that you're creating an e-mail message here so, as shown in Figure 14-18, the form looks somewhat like an e-mail message.
The information you enter includes:
Name: Enter a name for the template.
Description: Enter a brief description of the template.
Subject: Enter the subject of the e-mail.
Enter the body of the e-mail message.
The body of the e-mail message works like any other e-mail. You can format your text and write pretty much whatever you want. However, there's a neat trick here. If your alert depends on a change to a specific field, you can let the recipient of the alert know exactly what's changed. For example, you can choose a specific field from the Target module drop-down list, choose Old Value from the bottom drop-down list, and then click Insert so that the recipient knows exactly what information has changed. You can also choose New Value to see what the field has changed to.
Click Save to save the template.

Creating an alert
By now, your Workflow is really starting to take shape. You've even created a template that will automatically go to the users you need to notify of a Workflow-related event. You only have a few steps left, and fortunately, they're easy ones.
Now, you're going to set up the actual Alert process, which is easy if you follow these instructions:
Click Admin from any Sugar view and then choose Workflow Management in the Developer Tools subpanel.
The Workflow Home page opens.
Select the Workflow that you've been busily creating, scroll to the Alerts subpanel, and click Create.
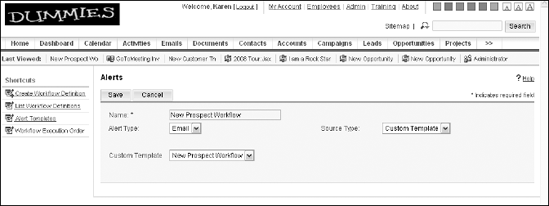
The Alerts page opens, as shown in Figure 14-19.
Fill in the alert information.
I told you this was easy; there are only a handful of fields:
Name: Enter a name for the alert. You might choose a name that corresponds to the name of the Workflow to avoid confusion.
Alert Type: You can send the alert in the form of an e-mail or an invitation.
Source Type: You have two options here. If you choose Normal Message, an Alert Text box will appear for you to type in the message. If you select Custom Template, the Custom Template field will appear, and you can choose a custom template from the drop-down list.
Custom Template: This field displays existing Alert Templates if you select Custom Template as the source type. Choose the template from the drop-down list.
Click Save to save the alert.
Your alert appears in the Alerts subpanel of your Workflow; look closely, and you'll notice a cute Recipients icon. Stay tuned — you'll be clicking that icon in a minute.
Sending an alert to those that need 'em
At this point, you might feel like you're working on a giant jigsaw puzzle. Fortunately, you only have a few more pieces to add. The Alert Recipient List allows you to determine who is supposed to get the alert — an important part of the entire Workflow process.
Click Admin from any Sugar view and then choose Workflow Management in the Developer Tools subpanel.
The Workflow Home page opens. If you just added an alert, you were already in the Workflow Detail view. However, it's always a good idea to start from the top to make sure that no one gets lost along the way.
Select the Workflow that you've been busily creating, scroll to the Alerts subpanel, and click the Recipients link.
The Alerts Detail view opens. Notice that it includes an Alert Recipient List subpanel.
Click Create.
A pop-up window opens.
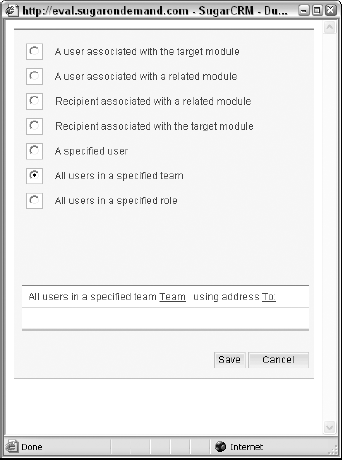
Select the option for the user(s) who are to receive the alert.
Sugar creates hyperlinks depending on your selection. For example, if you want to send the alert to a team of users, Sugar will furnish the message you see along the bottom of Figure 14-20. Click the hyperlink to select the users, teams, or recipients of the alert.
Click Save to save the recipients list.
The selected users appear in the Alert Recipient List subpanel.
You're now ready to put the last piece into the Workflow puzzle. You can schedule actions to occur automatically when the Workflow is triggered. For example, you might set up a Workflow to notify a sales rep when a new lead in his territory is added to the Sugar database. Then, when the Workflow starts, you can have Sugar automatically change the lead's status. Cooler yet, you can add multiple actions to a Workflow. For example, you might have Sugar create a new opportunity for the lead and add the lead to your newsletter recipients.
Here's how you can set up those actions.
Click Admin from any Sugar view and then choose Workflow Management in the Developer Tools subpanel.
The Workflow Home page opens.
Select the Workflow that you've been working on, scroll down to the Actions subpanel, and click Create.
A pop-up window appears.
Select as many actions as you want and then click Next.
Update fields in the Targets module: Change information in the Target record.
Update fields in a related record: This updates information on one of the subpanels. For example, if you're working with the Leads module, you might want to add a note to the record.
Create a record associated with a module related to the Targets module: Create an entirely new record.
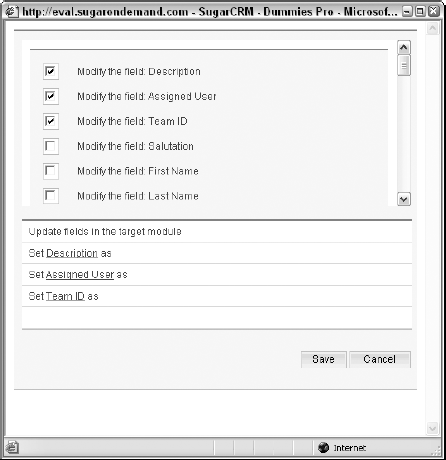
Fill in your response and then click Save to save the action.
As shown in Figure 14-21, here's where you hone the information you indicate in Step 3. For example, if you opt to update fields in the Targets module, here's where you supply the fields you want to update and provide a value for those fields.
Click Save to create the action.
You land on the Workflow Detail view where you can view the Workflow in its entirety, as shown in Figure 14-22.

At last! You've come to the end step of the Workflow process. You should be proud of yourself — you definitely deserve a well-earned pat on the back. At this point, the Workflow is finished, although you might still want to tweak it a bit. You can go back and edit any part you want by following all of the above directions, looking for the pencil/Edit icon as you go.
Although you're finished with the actual process of creating a Workflow, you might want to add two optional — albeit important — steps to your Workflow checklist.
Specifying the Workflow Sequence
If you create more than one Workflow for the same module, you might run into a conflict down the road. For example, suppose you have one Workflow process that includes sending a welcoming e-mail to new leads and another process that sends out a thank you to any leads that place an order. The lead might be confused if he receives that thank-you letter prior to buying anything.
You can arrange the order of related Workflow items to ensure that your Workflows don't conflict with one another and run in an orderly fashion. To do so, simply follow these steps:
Click Admin from any Sugar view and then choose Workflow Management in the Developer Tools subpanel.
The Workflow Home page opens.
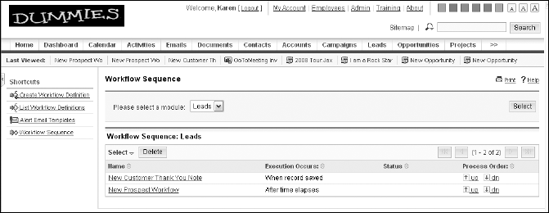
Choose Workflow Sequence from the Shortcuts menu.
Select the module that contains the conflicting workflows and then click Select.
To make life easy, Sugar only gives you a choice of the modules that contain Workflows.
Arrange the order of the Workflows on the Workflow Sequence page.
As Figure 14-23 illustrates, you can rearrange the order of the processes by selecting the up and down arrows next to each process. Your changes will save automatically.
Testing the Workflow
With so many steps involved in the process of creating a Workflow, it's only natural that you might get lost along the way. You might want to think of yourself as a rocket scientist — you'd be very disappointed if nothing happened when you yelled, "Blast-off!"
Again, Sugar has your back. Testing the Workflow prior to implementation will allow you to rest comfortably, knowing that all your Ts are crossed and your Is are dotted. Plus, you won't have to hide the next time the boss comes roaring around the corner.
Tip
If you had set the Workflow status to Inactive while creating the Workflow, you'll need to change it to Active prior to testing the Workflow.
You test the Workflow by actually recreating the process. This includes adding or making changes to the Workflow that correspond to the conditions you created for the Workflow, making sure that the appropriate alerts are sent and the specified actions are taken.
Click Admin from any Sugar view and then choose Email Settings in the Email subpanel.
Verify that all your basic e-mail settings are correct.
Make sure that there is a check mark in the Notifications On? check box.
Log in to Sugar as a different user and click My Account.
Verify that your e-mail settings are correct.
Access the module around which the Workflow is built and create or edit a record.
For example, if you want to test that you'll receive a notification every time a new lead from Florida is created, then create a new lead who just happens to be located in Florida.
You should now receive an e-mail informing you that a new lead was just created, at which point you can let out a loud whoop and dance around the office. If not, it's back to the drawing board.