![]()
Citizen Science and Open Source Labs
The technologies we have talked about in this book so far can be used for many things. One of the most exciting possibilities of the combination of low-cost custom fabrication and ubiquitous electronics may be the rise of citizen science. This chapter uses the term broadly, to mean participation by nonscientists in the solution of difficult scientific problems. The public may be recruited to analyze data by donating time on their computers when the computers are idle, or they may help analyze big pools of data that for some reason are difficult to work with in a fully automated way. They may go out and get data in the field to allow an investigator to have far more reach than he may have been able to get by walking around on his own. In this chapter, we primarily talk about science that includes participation by a professional scientist in some way.
These falling costs also mean that scientists can also make their research dollars go farther and be more flexible in their own work. Scientific equipment is often very expensive and rather inflexible, and often researchers have to compromise their experiments to work around the limitations of the machine. In other cases, it can be hard to analyze data in the field by bringing out traditional large pieces of analytical equipment. However, in those cases, with low-cost sensors, there might be ways to do at least some screening of data or situations in the field, even if the in-the-field analysis is not as good as a lab will be able to do ultimately for a subset of the field-collected situations.
In this chapter, Joan takes you through some of the types of projects that have been successfully developed with this type of format. Then Rich takes over and talks you through some of the nitty-gritty involved in making low-cost instruments to measure things yourself in the field. Finally, we come together and talk about the challenges inherent in citizen science and some concepts the professional lab might consider adopting.
Types of Citizen Science Projects
There are various models of citizen science projects. Astronomy has benefited from amateur observations for a very long time, starting with basic observations over millennia and more recently by observations of asteroids, variable stars, and other objects that require a lot of eyes making observations on a lot of relatively bright objects. The objects have to be relatively bright to be visible with small amateur telescopes. Speaking of telescopes, amateurs often build or modify their own, so amateur astronomy and similar field observation–oriented sciences have involved some of the first “maker” citizen scientists.
Amateurs Analyze Professionally Generated Data
Some of the oldest data-oriented projects use personal computer processing power to analyze a lot of data cheaply. Each participant’s computer has a program that runs on it (often as a screensaver) that processes a small piece of a very large dataset when the computer would otherwise be idle. This also has the bonus of publicizing the scientist’s research effort and creating a community of interested people who feel they have some stake in the outcome. Researchers involved with the Search for Extraterrestrial Intelligence (SETI) in 1999 produced one of the first in this category, SETI@Home (http://setiathome.berkeley.edu). The SETI project took signals from many big radio telescopes (those big dish antennas that are a staple of science-fiction movies) and used home computers to analyze chunks of signals for possible signs of intelligent life elsewhere. Civilization on earth has been putting out a lot of signals (TV, radio, radar, microwave ovens, and so on) for the last century or so, and the premise of SETI is that if anyone else out there is doing the same thing, there will be certain characteristics of an intelligent signal that we should be able to find. This kind of search works best if you have a lot of data and a lot of eyes looking at it. No signals from extraterrestrials have been found yet, but SETI researchers by necessity have to take a long view—the project is still ongoing if you want to try it out.
There are other models of participation that use the processing power between someone’s ears rather than on their computer. People are very good at image recognition, but computers are not (yet). Astronomy again was an early adopter of this. A big “sky survey” was done (the Sloan Sky Survey), which by 2007 had resulted in a huge amount of data. The scientists realized it would take years to get through looking at all of it and thought about how they could get some help from interested amateurs.
The researchers really wanted to find and categorize certain types of galaxies, which requires looking at an image of a piece of the sky and deciding what you are seeing. They had a million galaxy images in their database at the time and needed to find a new way of doing business. In 2007 they started the Galaxy Zoo project (www.galaxyzoo.org), which asks its users to do a short training exercise and then has them classify images of sky objects into several categories. As of this writing the researchers have received nearly 50 million classifications by 150,000 people. The Galaxy Zoo crowdsourced data analysis concept has since been generalized in the Zooniverse website (www.zooniverse.org) with a variety of different science projects to choose from, although still heavily weighted towards astronomy.
One of the Zooniverse projects has a somewhat different spin—the Old Weather project (www.oldweather.org). This project asks participants to look at scanned-in old ships’ logs to extract weather observations made by United States ships since the mid-18th century. Historians are interested in this data, of course, but it is also critical to climate modelers. Having a long and pretty accurate set of data stretching as far back as possible helps significantly when you are trying to figure out how to predict weather in the future.
Amateurs Take Data, Scientists Analyze It
All of the projects we have talked about so far assume that a scientist is taking the data and the public is analyzing it. Another model is for the public to take the data, at the request of scientists who cannot realistically gather as much data as they need for, say, environmental studies. One project along these lines has been running in one form or another since 1900. The Christmas Bird Count project (www.audubon.org/conservation/science/christmas-bird-count) originally started as an attempt to encourage people to go out and count birds on Christmas Day rather than shoot them. Over time, however, it has become a very valuable long-term, detailed record of bird populations in many areas. Cornell University Ornithology Lab (www.birds.cornell.edu) now runs many other studies along similar lines, including the Great Backyard Bird Count and Celebrate Urban Birds.
Amateurs Take And Analyze Data
What about the even more do-it-yourself (DIY) option—to come up with a scientific study that you (or your students, or neighborhood) find interesting, and see what data you can take and analyze? These projects may arise as adjuncts to existing scientific projects, as classroom group projects, for a science fair, or just because someone was curious. In the past, a class or an individual perhaps could go somewhere and record bird or snail or toad distributions, and perhaps file their report up the chain to bigger organizations. Field instruments for amateurs were limited to bug nets, binoculars, and similar items.
Now the Internet (and social media) makes it easy to collaborate either with people you already know or people who might find you online if they are trying to study a similar problem. The availability of 3D printing and very low cost processors and sensors allows just about anyone to make cheap, distributable instrumentation. This creates opportunities for student or community groups to actually take data to answer questions of interest, which can even include designing and deploying instruments. A neighborhood or school group can answer questions that are perhaps too local to be of interest to anyone else. For example, you may want to know how well the sprinkler system distributes water on your school grounds. Or you might take part in a local contribution to addressing a bigger problem, such as characterizing how much a newly introduced bug has gotten itself established in your immediate area. In the next section, we talk through some citizen science projects that have emerged in the Los Angeles area.
Citizen Science Case Study: Invasive Species
It is now very easy to travel between continents. According to the Port of Los Angeles’s website (www.portoflosangeles.org/about/facts.asp) 176.4 million metric tons of cargo worth $290.2 billion passed through the port in fiscal year 2014, including 117,602 automobiles and 578,668 cruise ship passengers. It is pretty easy for a few tiny bugs less than 0.1 inches long to hitchhike their way in among all that. To make matters more interesting, sometimes a bug or a plant seed transplanted to a new area with a favorable, frost-free climate like Los Angeles will arrive without the predators or diseases that kept it in check back home. Add in some drought in California to stress the native plants and make them more vulnerable to infection, and the Los Angeles basin can seem a nearly ideal area for an invasive species to move in and make itself at home.
If you are not familiar with Los Angeles, pull up an online map and take a look at the region. Mountains as high as the 10,833-foot (3,302 m) San Jacinto Peak surround the city to the north and east, with the sea on the west and south, and other smaller mountain ranges popping up courtesy of the network of earthquake faults that runs under the region. The mountains may be forested, bare granite, or covered with chaparral (and, more and more often, houses) and interspersed with dense urban development as well as agricultural land. Thus there are many microclimates and ecosystems for a bug blown about the region to find and occupy.
The polyphagous shot hole borer (PSHB) is a small member of the ambrosia beetle family, about 0.07 to 0.1 inches long. According to the University of California at Riverside’s (UCR) Entomology Department page (http://ucanr.edu/sites/socaloakpests/Polyphagous_Shot_Hole_Borer/), the beetle is native to Southeast Asia, possibly Vietnam. Poly means many, and phagous means eat, and that pretty much sums up the modus operandi of this bug. A pregnant female will drill into a tree, create a gallery (a series of tunnels), deep into the tree, and lay her eggs. The bug also plants a fungus, Fusarium euwallacea, in the galleries, which serves as food for the larvae when they hatch. The males and females of the brood mate with each other when they are mature, and the pregnant females crawl out and spread through the tree or they can fly or be blown to another tree to spread the infection. Figure 6-1, taken in Pasadena, shows what this looks like from the outside on a tree where the bug may have extensively taken up residence. (Figures in this chapter are photos of trees that I, a nonexpert, have contributed as possible PSHB victims to the citizen science effort and are awaiting confirmation as of this writing. They give you an idea of the challenges, though!)

Figure 6-1. A Western Sycamore with a likely PSHB infestation
As you can imagine, it is very challenging to get at these bugs when they are deep inside the tree, and very difficult to interfere with their breeding cycle. Because the hole they make when they enter the tree is tiny, they can be hard to spot early on. Over time, thousands of galleries carved by spreading daughters of the first invader can riddle the tree with so many holes that it can no longer transport around the water and nutrients it needs, and the tree dies back first from branch tips and eventually altogether. So, it is spreading… and spreading… and spreading.
Chapter 17 talks about how one UCR lab studying these beetles started using maker technologies in its own work. This chapter describes some of the citizen science efforts that are starting to pop up in the attempt to first characterize the bug and figure out where it lives.
A first effort has been to develop an Internet-enabled citizen science project to track the spread of the beetle. The iNaturalist.org website is a tool that was developed to allow just such projects. Currently managed by the California Academy of Sciences, it was originally a graduate student project by a group at the University of California at Berkeley and was also based on some open source projects (Chapter 9).
Users can create a page containing a description of what sort of observations they need the public to capture. The participants in a project take a picture with their smartphones and thus capture both an image and the whereabouts of the specimen by allowing their phone to record its location. Current projects as of this writing were tracking everything from “The Insects of Texas” to road-kill tallies.
Ariel Levi Simons, who runs the citizen science interest group at LA Makerspace (see Chapter 5), put together a PSHB observation collection site at www.inaturalist.org/projects/scarab. Early data, mostly posted by professional scientists to help out us amateurs, showed a problem right away: the PSHB infestations look a lot like other things and also look very different on different trees. Compare Figure 6-2 (a Koelreuteria elegans, or Chinese Rain Tree) with Figure 6-1. When a PSHB beetle enters a K. elegans, the tree defends itself by coating the bug in sap and pushing it out, creating a bump of amber material. (Whether this is enough for the tree to save itself remains to be seen.) So, it is challenging to come in cold and be reasonably sure you are not contributing false positives, or that you are not missing trees because the infestation is in an early stage. Simons is working on this by developing some training for Los Angeles area volunteers, but it will never be easy.

Figure 6-2. Suspected PSHB on K. elegans (note how hard it is to see compared with Figure 6-1)
Other projects on iNaturalist.org have been designed to avoid some of these challenges by just trying to collect data on every bird or plant or bug in an area. The site allows an observer to just post an observation labeled as “Something…” with a request for expert identification. Experts can then go in and make more accurate identifications if the photographs are good enough, or go back to the location (if the phone location tag was good enough). Obviously, none of this is perfect, but it is a very good way to get at least rough data about ecosystems and populations.
You may be wondering why all this is in a book about maker technologies. For an instrument to be useful to a scientist, first we have to pose a question and define how we will try to answer it. (Chapters 12 through 14 talk a lot about how this works at the professional level and how to frame the process to do it yourself.) For this chapter, though, I have talked about how data taken by citizen science projects is managed. This section discusses how the availability of low-cost programmable electronics can enhance citizen science projects or even just enable good classroom or science fair activities.
For example, a lot of things about invasive species (like PSHB, described in the preceding section) are poorly understood. What kinds of things encourage or discourage the pest to move on? Is it affected by any environmental variables, like temperature or humidity? How does it spread from tree to tree (if it’s a bug) or through an area (if it’s a plant) and how quickly? If you are interested in studying such things, there are a lot of ways to do so by combining concepts from previous chapters.
Next Rich talks about how to build a network of sensors from Arduinos, shields (Chapter 2), and possibly some 3D-printed housings or ancillary parts (Chapter 3). You also need to power the whole thing (with batteries or a solar cell, if this will be away from computers) and you need to capture data somehow (on an SD card or wirelessly). And, of course, you need to program your system to take data or copy code from someone else who has done it. At the end of this chapter, the “What You Need To Know To Get Started” section has links to existing projects that you can use as guides for your own work. But for now, we start from first principles so that you can see how this works.
Building Your Own Sensor Networks
We think of “scientific instruments” as very expensive, fragile things that come in large boxes with lots of Styrofoam and thereafter stay in a lab. In some cases, this is true. Dropping cost and increasing miniaturization, though, allow the average person (or classroom) to create small packages containing some sort of sensor, a power source, a way to record (or transmit) data, and a processor to control it all.
Small sensors can have limitations, of course (see the comments in the “Challenges and Constraints of DIY Lab Equipment” later in this chapter, most of which apply to field equipment as well). However, either hand-carrying small equipment out to take measurements or finding a way to leave a monitoring station out on its own for a longer period can give enormous insight into the daily lives of ecosystems, microclimates, and similar ultra-local phenomena. Or you can simply instrument a classroom experiment cheaply and reasonably accurately.
![]() Note You can buy a vast array of different sensors from various providers, including Adafruit (www.adafruit.com), Sparkfun (www.sparkfun.com), and Qtechknow (www.qtechknow.com). A temperature sensor from Qtechknow is shown in Figure 6-3, and a force sensor in Figure 6-4.
Note You can buy a vast array of different sensors from various providers, including Adafruit (www.adafruit.com), Sparkfun (www.sparkfun.com), and Qtechknow (www.qtechknow.com). A temperature sensor from Qtechknow is shown in Figure 6-3, and a force sensor in Figure 6-4.
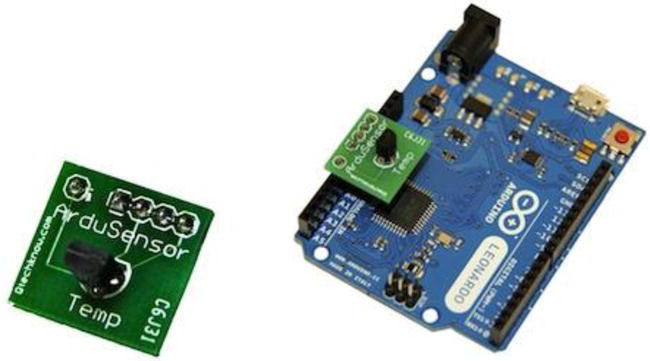
Figure 6-3. A temperature sensor from Qtechknow.com, shown on its own and installed on an Arduino
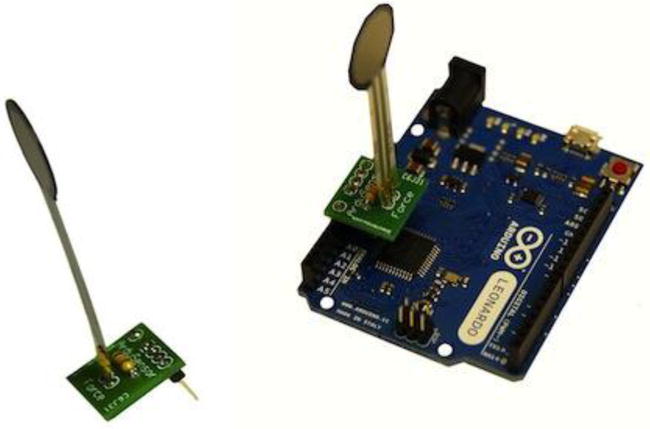
Figure 6-4. A force sensor from Qtechknow.com.shown on its own and installed on an Arduino
The first question you need to ask yourself is what type of data you want to collect. You can measure some aspects of the environment, like light intensity and temperature, with a special resistor (photoresistor or thermistor) that changes its resistance in response to its environment. For sensors this simple, all you need is another resistor to form a voltage divider to produce an analog voltage readable by an Arduino’s ADC (analog to digital converter -- see Chapter 2). On the other end of the spectrum, GPS receivers are often used to log the location of something as it moves around. These receivers process the signals they receive internally and use a serial interface to communicate with other devices. Ironically, these more complex sensors may be easier for a beginner to use because they are likely to be available on a breakout board or shield that comes with a tutorial and an Arduino library. Sensing temperature with a thermistor, though may require digging into the datasheet for values to plug into an equation to convert ADC readings into temperatures.
A robot may only need to store its sensor data long enough to act on it, but a data logger needs to collect data over a longer time and keep it even if the device loses power. An Arduino has two types of non-volatile storage (storage that persists without power, unlike RAM memory): flash memory and EEPROM. EEPROM (Electrically-Erasable Programmable Read-Only Memory) is designed to be read frequently, but written only once or a few times. It is also usually less than a kilobyte. Flash memory is a similar technology optimized for larger storage and more write cycles. Flash is the type of storage found in smartphones, memory cards, USB drives, and the solid-state drives that are replacing hard drives in modern PCs. An Arduino’s flash memory is used only for storing the program, and the EEPROM isn’t big enough to log significant amounts of data, so you’ll need somewhere else to store it.
For larger amounts of data, the most convenient storage medium is a Secure Digital (SD) memory card. Although an Arduino’s on-board storage is limited to much less than a megabyte, modern SD cards are available in capacities starting around 1 gigabyte and ranging up to hundreds of gigabytes. For use with a microcontroller, the smaller cards are usually a better choice, but a gigabyte or two should be more than enough for a datalogger anyway. Sites like Adafruit (www.adafruit.com) and Sparkfun (www.sparkfun.com) have breakout boards and shields for adapting an SD card to an Arduino, as well as information about how to use them.
It’s also possible to use a network to collect data from multiple devices in a central location. The communication protocols built into the Arduino are not ideal for long distances (for these protocols intended for communication between chips on the same circuit board, something a foot or two away could be considered “long distance”), but they can be used to communicate with devices that are designed for a longer range. There are shields and modules to add wifi and Ethernet connectivity to an Arduino—although these are more advanced techniques, and you’ll want to read the tutorials for the product first to ensure that they make sense to you and that they’re able to be used the way you expect. Even the USB connection that is built into most Arduinos can be extended out to 5 meters, or further by using a repeater (look for “active extension” cables) to relay the signal.
Weather Considerations
You’ll also need to consider the environmental hazards to your device. If you’re leaving your sensor outside to log changes to some aspect of its environment like temperature or humidity, you’ll need to ensure that it can survive in that environment. Electronic circuits don’t like to get wet, and lack of weather-proofing can destroy your equipment and cause your experiment to fail. The solution may not be as simple as sealing your device in an airtight container, though. A humidity sensor that is sealed in a container won’t be able to measure the air outside it, and a temperature sensor will not respond rapidly to temperature changes with the air inside the container insulating from the external environment, so you may need to find a way to let your sensors stick out of a protective enclosure. If you have a 3D printer, you may want to print a custom enclosure, but in some cases you may be able to make something just as effective out of an upcycled food container (though if you don’t clean it thoroughly, you may get wildlife interfering with your experiment). Think through the challenges and try to deduce what might go wrong, and then get creative and find ways to prevent those problems!
Suppose you do not want to launch any particular project, but you do want to have a lab at your school that does more while costing less. Or perhaps you want to develop a science fair project, but the equipment to do what you want to do is too expensive. Or maybe you are a professional scientist and you are tired of adapting your experiments to the one-size-fits-all equipment that is out there.
Several groups have been curating equipment (particularly for classroom optics experiments), and they may be a good place to start—they are listed in the “What You Need To Know To Get Started” section at the end of this chapter. Note that many of these are open source projects. As you will see in Chapter 9, that means that the presumption is that other people put out materials that you can use, but you are encouraged to add to the repository if you build on it or create improvements. Open source repositories often have associated wikis or forums that are good places to ask for advice.
Challenges and Constraints of DIY Lab Equipment
Science equipment has traditionally been expensive both because it was a small market segment (and thus did not benefit from economies of scale) but also because often the capabilities were pushing the available technologies of the time. In some cases, this may still be true. Here are some things to think about:
- Be sure to think through what you are trying to do and whether the $5 sensor you are buying actually can detect what you have in mind. Very low cost sensors, like the ones we talk about in this chapter, may have either inadequate sensitivity (the ability to detect dim objects, for instance, or low concentrations of something) or inadequate specificity (it may detect what you want, but it may also have a lot of “false alarms”)—or it may not work the way the well-meaning amateur poster thinks it does. Read any available data sheets if you are using very low cost equipment for anything beyond a classroom exploration.
- If you are trying to use simple robotics to automate a very repetitive task, be sure that you are actually automating the task you think you are. Sometimes people do additional small things (wiping off a tip between samples, squeezing something down a particular way) that do not transfer well to automation. Watch any candidate for automation in exquisite detail before trying to create something that seems like it should be a very simple device until you get into it.
- If you are taking video data, remember that video files get big very fast. An Arduino will probably not be able to do any real-time video processing. You will need to go up to more powerful processors for that. Similarly, remember that an Arduino is not all that powerful a processor generally. Think through how often you have to sample something or how frequently something has to move.
- If you are growing or mixing something, determine first whether there is a possibility of a toxic byproduct or outcome, and if so, find a trained collaborator with adequate safety equipment. Be sure that whatever materials you are making your equipment out of are compatible with other things you anticipate encountering.
- If you are doing an ecological study, do not move samples of invasive plants or bug-infested materials around because you might inadvertently make matters worse. Catalog or otherwise study them where they are. (Moving around firewood is a prime suspect in the spread of many invasive bugs, including PSHB.)
- Be sure wherever you put the sensor is representative—not next to a ventilation duct or someplace where it will get run over or even eaten by the local fauna.
If you are designing a project yourself and you are out of your area of expertise, be sure you know what the risks might be before you get started. Talk to an expert in the field before embarking; biohacking spaces often make experts available (see Chapter 5), or you can call a local university department and ask for someone to talk to. You might find someone who will want your data! And, as always, use eye protection and other safety precautions appropriate to your situation.
What Do You Need to Know to Get Started?
This chapter integrates some of the materials from Chapters 2 and 3, and we will not repeat that material here. 3D printing objects to use in your lab obviously is less complex than building yourself an entire set of field-deployable sensors. As with all things in the hacker universe, it is good to look at what others have done and build on that. This section is not an exhaustive list of every project out there, but a sampling to give you an idea of what sorts of things people are doing and how you might get involved. Most of them are community-contributed sites, so always think through claimed data accuracy and overall design before using them for mission-critical research or municipal policymaking.
The sites that sell sensors intended to be interfaced with an Arduino typically have tutorials or at least some suggestions on how the sensor is intended to be wired up (for example, www.adafruit.com, www.sparkfun.com, and www.qtechknow.com).
The Instructables website (www.instructables.com) has many relevant projects. Within Instructables, you can search on:
- “weather stations” (www.instructables.com/howto/weather+stations/) or
- “sensors” (www.instructables.com/howto/sensors/)
and find projects of varying plausibility. Remember that these are community-donated projects, so some may work beautifully and some not so much. But you can at least use them as starting points for your own explorations.
Tekla Labs is a project at University of California at Berkeley (www.teklalabs.org) to develop open source science equipment. They ran a contest called “Build My Lab” on Instructables (www.instructables.com/contest/buildmylab/). This project asked for submissions for common lab equipment that could be built out of low-cost or repurposed parts. The Tekla Labs group also surveyed scientists in low-resource areas to see what kind of equipment they would like to be able to make in this way (and felt they would be willing to make). As of this writing, the guides and other materials were rather incomplete, but the Instructables from the contest are available.
Michigan Tech Open Sustainability Technology Lab is one of the bigger resources in this space. Joshua Pearce wrote the 2013 book Open Source Lab, published by Elsevier. If you are interested in optics lab equipment, the group has a website (www.appropedia.org/Open_source_optics) and paper in the open access journal PLOS ONE about making your own optics equipment. The paper is by Chenlong Zhang, Nicholas C. Anzalone, Rodrigo P. Faria, and Joshua M. Pearce: “Open-Source 3D-Printable Optics Equipment” (27 March, 2013) PLOS ONE, DOI: 10.1371/journal.pone.0059840 (http://journals.plos.org/plosone/article?id=10.1371/journal.pone.0059840).
Other Sources
Public Lab (www.publiclab.org) has put together a few projects that build equipment and open source software. A sort of hybrid of some of the citizen science project types described earlier in the chapter, the group defines initiatives and host designs of open source hardware and software projects to make relevant measurements (of air quality, for example).
Charles Bell’s book Beginning Sensor Networks with Arduino and Raspberry Pi (Apress, 2013) describes creating a network of sensors with wireless connections and then storing the resulting data with a Raspberry Pi computer (see Chapter 2). This is a more complex situation but may be appropriate if collecting data from SD cards would be impractical.
What Does It Cost to Get Started?
Here again it depends to a degree on what you are trying to do. If you own a 3D printer and you are printing a small object to hold something during an experiment, the answer is probably less than a dollar. If you are going out and buying an Arduino, some sensors, and ancillary materials like wire and resistors and some means of storing data, you are probably about in the $50–150 range, depending on the sensor(s) involved and which Arduino or compatible you are using.
In earlier chapters in this book, we adopt something of a “hack first and ask questions later” mentality. However, here it is more important to think through your system, or how what you are building answers a science question or contributes data to a larger effort. With a little thought about the big picture, you may be able to make your little backyard detector simpler by considering where you might have people intervene, when a cell phone and its instrumentation might be the best choice, whether just taking samples and having a central lab process them might make more sense, and similar considerations about ways to move complexity away from your little Arduino (or Raspberry Pi) command post. In this case, the point is the use of the devices you are making rather than the device itself, so this is more of a maker than hacker situation (a distinction drawn in Chapter 1).
Summary
This chapter covered different ways of doing citizen science projects and ways to develop your own projects as well. You learned that you can use an Arduino to take data from a low-cost sensor and store that data on an SD card. Finally, we reviewed how a professional lab might use some of these technologies and offered a few cautions about things to think about when developing systems like this.
Chapter 7 moves on to a different set of applications of sensors, Arduinos, and 3D printing for projects that can be worn as clothing or costumes. The technologies and challenges have some overlaps, albeit in very different contexts!