D.3 Power Source Selection Tool Method
D.3.1 First Approach
In Section D.2, different tools and methods were presented. Most of them are either used by the institute itself (e.g., POWER) or not implemented (e.g., the CES database of power sources). The methods described by Cook and Sastry (2005) and Fu et al. (2005) are both interesting solutions to the problems that industrial design engineers face when making a choice for a power source during the concept phase. In this section, a first approach toward a power source selection tool is proposed, based on both the tools presented.
The general outline of the tool is described in Figure D.3.1. One of the building blocks, in the sizing part of the algorithm, is the analytical model of different power sources and energy containers. For the tool these models have to be developed, making a good estimation of volume, mass, and costs. Because the tool will be used during the concept phase of design, not much is known about the power source's characteristics. Basic characteristics like user profile, number of cycles per period of time, and nominal and peak power are used as inputs for the different transfer functions.
Figure D.3.1 Flow chart of the Hybrid Energy Selection Tool
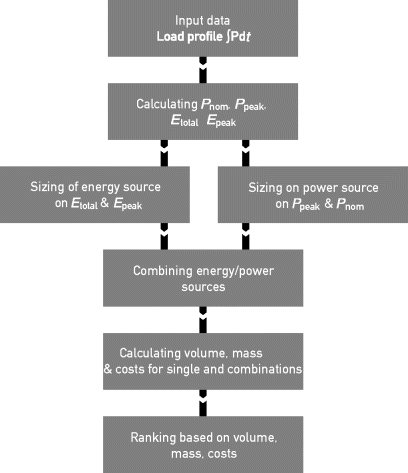
The algorithm will have to make combinations of power and energy sources, single or hybrids, parallel or in series. Besides a single power source, multiple power sources should be evaluated. In the end, the tool has to present the different options of power and energy combinations in an ordered way.
In Section D.3.2, a first-order analytical model for sizing a FC (hybrid) system is presented. To evaluate this model, a design of a hybrid power source powering a MP3 player is described in Section D.3.3. The function is evaluated (Section D.3.4) and modified (D.3.5), and a simple analytical formula is proposed that quickly sizes FC hybrid systems based on basic power and energy specifics of the application.
D.3.2 Analytical Model for Sizing an FC (Hybrid) System
A FC power system consists of not only fuel but also a power converter, the FC, a fuel tank, and auxiliary components such as pumps, tubing, and electronics (balance-of-plant components). In this section an analytical model, the transfer function, for quick volume and weight estimation is introduced.
Xie et al. (2004) discussed the design of an FC system designed for powering the Motorola charger unit. The system is divided into three main parts:
The weight and volume of these major parts for the 2 W prototype are 0.69 kg and 0.92 L, respectively. The subdivision is listed in Table D.3.1.
Table D.3.1 Volume and weight of the three major components of the Motorola DMFC charger (Xie et al., 2004)
| Volume (L) | Weight (g) | |
| Fuel cell stack | 0.087 | 180 |
| Fuel tank | 0.413 | 351 |
| Balance-of-plant components | 0.416 | 155 |
Based on these figures, a first approach to an analytical model is proposed in which the volume and weight of an FC system are sized. It is assumed that dimensions of the FC stack and the balance-of-plant components are based on power specifics (P) and the dimensions of the fuel tank are based only on energy specifics (E). The following analytical model of the volume (L) is derived:
(D.3.1) 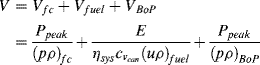
where:
![]() = 77.3 W L−1
= 77.3 W L−1
![]() = 4780 Wh L−1
= 4780 Wh L−1
![]() = 16.1 W L−1
= 16.1 W L−1
ηsys = 20% (Xie et al., 2004)
![]() = 0.852
= 0.852
Balance-of-plant components comprise the largest contributor to the total systems volume (≈45%). Less than 20% of these components' volume is claimed by the electronics, air pump, mixing chamber, fuel pumps, and others. More than 80% of these total components' volume is empty space, electrical interconnects, and plumbing (Bostaph et al., 2003; Xie et al., 2004). This is 34% of the total volume. Thus diminishing empty space is one of the key issues to increase energy and power density.
For weight (kg), the following analytical model is derived:
(D.3.2) 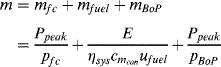
where:
pfc = 37.2 W kg−1
ufuel = 6306 Wh kg−1
pbop = 43.2 W kg−1
ηsys = 20% (Xie et al., 2004)
![]() = 0.803
= 0.803
The energy density and specific energy of methanol are based on the lower heating value.
These simple models can now be used to compare different applications with each other in so-called Ragone plots (Figures D.2.3 and D.3.2). The plot for a Sony 383450A8 prismatic lithium-ion battery (4.2 V, 7 Ah) is also included (Sony, 2004).
In general, FCs outperform lithium-ion batteries in areas that need high energy and low peak power. Compared to the FC, the battery is a high-power-dense energy source.
D.3.3 Design of a DMFC Power System for an MP3 Player
To test the method described in Section D.3.2, a design is made of a DMFC in combination with a battery powering a MP3 player (Flipsen, 2007, 2009). Figures D.2.3 and D.3.2 show the potential for improvement when a DMFC hybrid is applied to a flash-drive MP3 player.
The MP3 player has the load characteristics pictured in Figure D.3.3. This coarsened load profile is repeated for 2 h (≈30 cycles) per day. The MP3 player's peak power has to be at least 868 mW during startup, and nominal power is 150 mW; power output of the FC is approximately 185 mW, and the efficiency of the balance-of-plant components (ηbop) is 81%. The runtime of the system should be at least 17 h for intensive users, which is equal to 3.1 Wh of energy.
Figure D.3.2 Mass Ragone plot for the Sony Li-ion battery and the model for the DMFC power system
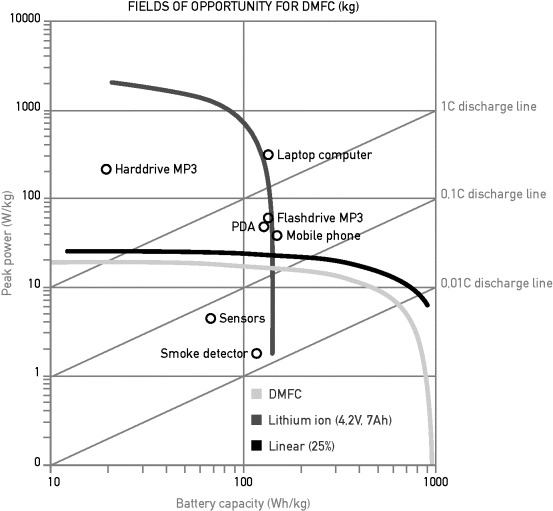
Figure D.3.3 Coarsened load curve of the Samsung YP-Z5F MP3 player

According to the model described in Section D.3.2, the volume and weight of the system will be 69 mL and 47 g, respectively.
Two designs have been made: one making use of standard commercially available components, the preliminary design (Flipsen, 2007), and an optimized version improving volume by using scaled-down components, the optimized redesign (Flipsen, 2009). Figure D.3.4 shows the exploded view of the latter design, and Figure D.3.5 and Table D.3.2 show the volume breakdowns of both designs.
Figure D.3.4 Exploded view of the “optimized” design of the DMFC battery system (Flipsen, 2009)

Figure D.3.5 Volume breakdown of (left) the preliminary design and (right) the “optimized” design
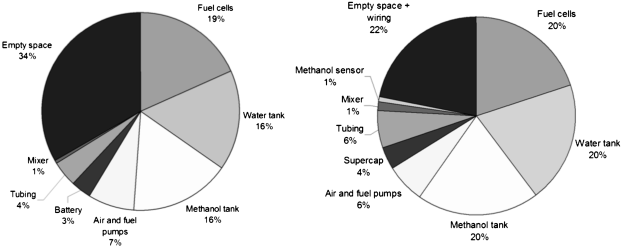
Table D.3.2 Comparison between the lithium polymer battery, the preliminary design, and the optimized redesign.
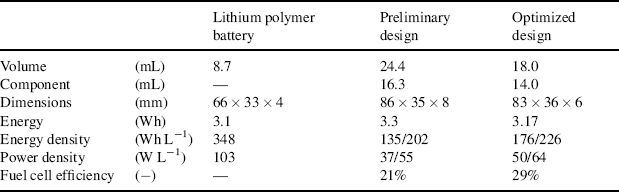
The power systems size of the optimized version is 83.2 × 36.0 × 6 mm3 (18.0 mL), and the total volume of the main components alone is 14.0 mL. In the preliminary design, the fuel tanks were designed as a box. In the optimized redesign, the tanks are formed to fit in between the tubing and act as a platform where all components can be attached. This gives two advantages over the preliminary design: (1) More empty space is effectively used; and (2) during assembly the components can be fitted to the tanks, making the subassembly easier to handle. Table D.3.2 compares the lithium-ion battery used in the MP3 player with the preliminary design and the optimized redesign. The redesign has been a great improvement compared to the preliminary design, but still does not fit into the compartment available (8.7 mL). Power and energy density also lags behind that of the lithium-ion battery.
Unfortunately, at the time of this writing it was not yet feasible to draw up the weight characteristics from the computer-aided design (CAD) models.
D.3.4 Evaluation of the Model
The volume characteristics of the preliminary design and the optimized design can be found in Table D.3.2. The model used in Section D.3.3 models a stand-alone FC power system and not a hybrid system, as designed for the MP3 player. The predicted volume of the FC system is equal to 69 mL, and the total volume of the preliminary design and the redesign is equal to 24.4 and 18 mL, respectively, making the model described in Section D.3.3 not very useful for a DFMC hybrid.
In the model, the volume of the FC stack is based on the maximum power output. In the design case, the maximum power output of the FC is equal to the nominal power 150 mW, less than the maximum power output of the whole system, 868 mW. Using the nominal power of 150 mW in the model, a volume of 15 mL is derived, lower than the outcome from the design.
The difference between the FC system designed by Motorola and the one described in this case is the extra added accumulator, used to deliver power bursts for short periods of time. The FC stack strongly depends on the nominal power, but this intermediate accumulator depends strongly on peak power. Because no intermediate accumulator is used in the Motorola case, an extra accumulator volume should be added for the FC hybrid model:
(D.3.3) ![]()
In addition to the power difference, the designed system has two tanks, one methanol fuel tank and one water tank. The Motorola design case has only one tank containing 100% methanol and no extra water. All water produced by the cell is recycled and used to dilute the methanol to a 3% wt. mixture. The effective energy density of the fuel tank decreases in this redesign case by a factor of 2. An extra concentration parameter cmeoh is introduced in the model. This parameter indicates the amount of methanol over the total liquid amount. In the Motorola case this parameter is equal to 1.0, and in the MP3 design case this parameter is equal to 0.5.
The volume of the FC flat pack in the design case has a power density equal to about one-half, or 51.5 W L−1, of the Motorola case (100 W L−1).4 The Motorola FC is a four-cell stacked version using bipolar plates that are thinner than the end plates. Making use of a flat-pack design, linking several independent cells to each other in series, increases the volume of different cells and also results in an overall thinner power source. An extra parameter is added to the final analytical model, the flat-pack constant cfp, equal to 1 for stacked design and 1.5 for a flat-pack design.
System efficiency ηsys is difficult to predict. In contrast, the FC's efficiency (ηfc) can be derived from its specification sheets, based on load. In the Motorola case the FC voltage efficiency is 29% and the total systems voltage efficiency is 22%.5
The system's voltage efficiency can be modeled as
(D.3.4) ![]()
where ![]() is the balance-of-plant component efficiency (Xie et al., 2004):
is the balance-of-plant component efficiency (Xie et al., 2004):
(D.3.5) ![]()
With rau the ratio of auxiliary power to net power (≈18.75%) and ![]() the efficiency of the DC/DC convertor (≈90%), the balance-of-plant component efficiency is equal to 76%. If power conditioning circuitry is used inside the electronic device, the device can be powered directly from the FC without conditioning, meaning without a DC/DC convertor, and achieve a balance-of-plant component efficiency of 84%.
the efficiency of the DC/DC convertor (≈90%), the balance-of-plant component efficiency is equal to 76%. If power conditioning circuitry is used inside the electronic device, the device can be powered directly from the FC without conditioning, meaning without a DC/DC convertor, and achieve a balance-of-plant component efficiency of 84%.
The efficiency of the FC also influences the volume of the FC stack. Higher efficiency means higher power density. For now the power density is set at (p·ρ)fc = 100 W L−1. Higher power densities up to 500 W L−1 have been reported by PolyFuel (Membrane Technology, 2007).
The volume of the FC can now be modeled as follows:
(D.3.6) ![]()
The volume for balance-of-plant components is based on the volume of wiring, tubing, air and fuel pumps, other auxiliaries, and empty space. A large chunk of this volume is empty space, and in the standard design case almost 32% of the total volume was taken up by empty space. In the redesign, however, this amount was decreased to almost 20%. For the function proposed in this case, the balance-of-plant component volume depends solely on the nominal power Pnom and power density of the components (including empty space) ![]() . The values for the power density of the balance-of-plant components have to be adjusted, because empty space is diminished. The empty space will be excluded from the balance-of-plant volume and extra volume is added; the empty space volume is Vempty:
. The values for the power density of the balance-of-plant components have to be adjusted, because empty space is diminished. The empty space will be excluded from the balance-of-plant volume and extra volume is added; the empty space volume is Vempty:
(D.3.7) ![]()
(D.3.8) ![]()
where:
![]() = 70 W L−1
= 70 W L−1
ces = 0.2–0.32
D.3.5 Modification of the Model
Taking all the modifications of Section D3.4 into account, the volume can now be modeled as
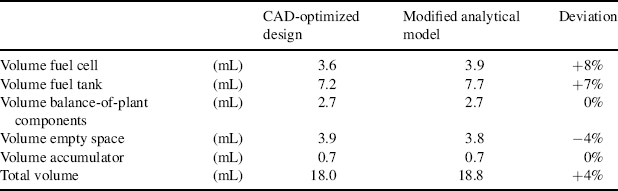
According to the model described by equation (D.3.9) and Section D.3.4, the estimated volume for this FC hybrid is equal to 18.8 mL. Table D.3.3 compares the predicted volumes by the optimized function with the CAD model. The predicted value deviates +4% from the CAD model, which is within reasonable bandwidth (<10%).
Table D.3.3 Volume output from the CAD model of the preliminary and optimized design, versus the first-approach model modified in this section.