
Chapter 5. Pragmatics
As defined in Webster’s Ninth New Collegiate Dictionary, pragmatics is a branch of semiotics that “deals with the relation between signs or linguistic expressions and their users.” As used here, pragmatics governs the use of the syntax and semantics of IDEFO to analyze an enterprise. It includes all aspects of the IDEFO method besides its basic syntax and semantics: the rules and procedures for the application of IDEFO that make it practical and useful.
Many modeling methods do not include a standard for pragmatics. For example, according to the IDEF1X information modeling method, as long as the IDEF1X model matches the defined syntax and semantics of the IDEF1X graphics, it is unimportant how the user of the method went about developing the model. Because IDEFO pragmatics are so important to its successful use, I devote this entire chapter to it. Appendix E also provides a brief step-by-step example of the correct IDEFO pragmatics for developing diagrams.
The primary elements of IDEFO pragmatics are
![]() Starting an enterprise analysis with IDEFO:
Starting an enterprise analysis with IDEFO:
![]() Organize an IDEFO enterprise analysis project.
Organize an IDEFO enterprise analysis project.
![]() Define personnel roles on a project.
Define personnel roles on a project.
![]() Select proper modeling parameters: purpose, viewpoint, and type of breakdown.
Select proper modeling parameters: purpose, viewpoint, and type of breakdown.
![]() Develop interviewing techniques to extract accurate facts.
Develop interviewing techniques to extract accurate facts.
![]() Balance diagrams, including clustering activities and bundling arrows.
Balance diagrams, including clustering activities and bundling arrows.
![]() Follow basic graphics layout rules for good communication.
Follow basic graphics layout rules for good communication.
![]() Lay out the main path and secondary paths.
Lay out the main path and secondary paths.
![]() Validate the diagram using mentally simulated enterprise events.
Validate the diagram using mentally simulated enterprise events.
![]() Pick the next activity to decompose.
Pick the next activity to decompose.
![]() Stop the modeling process.
Stop the modeling process.
![]() Modeling peer reviews and critiques:
Modeling peer reviews and critiques:
![]() Employ the reader/author review cycle.
Employ the reader/author review cycle.
![]() Conduct walkthrough sessions.
Conduct walkthrough sessions.
![]() Presenting IDEFO models to an audience:
Presenting IDEFO models to an audience:
![]() Use FEOs.
Use FEOs.
![]() Use schematics.
Use schematics.
![]() Format the model for publication.
Format the model for publication.
![]() Preparing an analysis of change impact to control implementation of improvements.
Preparing an analysis of change impact to control implementation of improvements.
Defining the Purpose, Viewpoint, and Type of Breakdown
The step-by-step procedure for developing an IDEFO model begins at the point at which the author determines the model parameters, that is, the purpose, viewpoint, and type of breakdown. The purpose and viewpoint must be kept constantly in mind by an IDEFO author as he creates a model. First is purpose. The reason for creating a model is selected and then documented on the A-0 diagram at the very start of the modeling effort. A useful way for a modeler to identify the purpose is to start with the expected benefits, and then to write down how the model will achieve each benefit. The model’s purpose is formally documented by completing the sentence, “The model will be used to . . . “ This purpose statement can be reexamined throughout the modeling effort to ensure that the author is continuing to model relevant detail.
Second is viewpoint: the perspective of the model itself. The model’s viewpoint may or may not be from the same perspective as the audience’s, and it is very unlikely that it is from the same perspective as the author’s. The model’s viewpoint is that through which the modeled facts are filtered to provide emphasis and to present the predominant perspective of the system. For example, if the author is interested in the financial perspective of the system, then the viewpoint is financial. Likewise, a management or technical perspective may be used. In each case, the entire system is modeled in its entirety, but facts that are of most interest from the selected perspective are emphasized, while facts that are less relevant are pushed down as details to be included at a low level or not at all. The author must understand whose viewpoint is being used for the modeling and must stick to this single view throughout development of the model.
Whenever I explain to students what is meant by viewpoint, someone will claim that each person in the world has a unique viewpoint—the way he sees things, what he is interested in, what his goals are, what he considers important. This is true, but such an outlook does not help an IDEFO author determine viewpoint. What is useful is the knowledge that people often can be classified as to type of job (such as accountant, secretary, or programmer), and it is this classification that helps determine IDEFO viewpoints. People with business school degrees may be said to have a background in business or finance, for example; people who had college majors in mathematics, physics, or computer science may be said to have a technical view; people who manage a project may be said to have a project manager’s view; and so on. In other words, the model’s viewpoint is related to the grouping of viewpoints associated with the job to be accomplished.
Viewpoint is critical to proper model communication. It is logical, therefore, that if a financial viewpoint is selected, then financial terminology (general ledgers, cost accounts, return on investment) should be used to capture the picture. A technician looking at a financial-view model might not completely understand the jargon, but the jargon is necessary in order to communicate the model to people who have a financial background. Mixing viewpoints within a single model destroys the clarity of the model.
Viewpoint and audience are not identical, and should not be thought of as such by a modeler. A financial model, for example, may adopt a specific viewpoint that is different from that of its management audience. However, the viewpoint of all readers checking model accuracy and completeness during the reader/author critique cycle must match the model’s viewpoint, or they will not be qualified to provide a proper critique of the facts.
In addition to purpose and viewpoint, the third parameter that must be decided before modeling begins is what type of breakdown to select. Consideration of this parameter is sometimes omitted by practitioners of IDEFO, since SADT allowed only one type of activity (functional) and one form of breakdown (decomposition). There are other types of activity and other forms of breakdown, but for purposes of this book, the two values of functional activity and decomposition will be used here. (See Appendix A for a discussion of these other forms of activity and how they may be selected to model specific systems for selected purposes.)
Before modeling can begin, the project must be staffed, and agreements must be established defining how much modeling support will be provided from a broad range of personnel. Table 5.1 summarizes the roles of the various staff who must be involved in an IDEFO project.
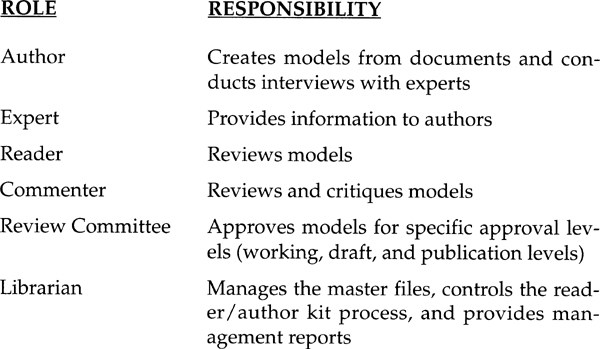
As part of starting the project, and author needs to establish agreements governing how much interview time will be required from experts, how much review time will come from commenters, and which group leaders and managers will serve on the review committee. Typically, there is one lead author and from one to four additional authors on a project. The reason for this is that if there were only one author, he would have no other knowledgeable IDEFO person to review and critique his working level and draft diagrams, but if there were too many authors, assignments would become unwieldy and hard to coordinate.
Starting the Model
Once the model’s parameters have been determined and documented and the staffing issues settled, the authors are ready to start modeling. The author with the most experience is identified as the lead author and is typically responsible for developing the A-0 diagram, as well as for decomposing the most complicated activities during model development. As we have already noted (see Figure 4-4 in Chapter 4), all diagrams in IDEFO, as well as all text, glossary entries, node diagrams, and FEOs, are written onto a single form: the IDEFO diagram form.
At the outset, authors should study any existing documentation for the system to be modeled. In most cases, this documentation either is out of date or does not exist at all, and so most of the real information is obtained during interviews with the system experts. The interview process begins with the authors putting the user expert at ease by providing an introduction to the IDEFO method, followed by a brief overview of the project and a description of the kind of information that is sought.
Once this introductory session has been finished, the authors should turn the conversation over to the expert, asking him to describe the process to be modeled and making sure that the description comes entirely from the expert’s viewpoint. Author interviewers should interrupt only if they are confused—typically, to define an unknown term or an apparent conflict in the story—keeping in mind that too much directing of the conversation by an interviewer will impose his viewpoint on the story and unduly influence the expert.
The end of the interview occurs either when the expert has said everything he wishes to about the subject or when roughly two hours have passed. At this point, the lead author thanks the expert and tells him that he will model the results of the interview and will return to verify the resultant diagrams by walking the expert through the model. The purpose for the walkthrough is to confirm that the authors have understood correctly, and that they have not left out important details or overemphasized something unimportant.
After the conclusion of the first interview but before another interview occurs, the lead author needs to analyze the interview notes and sketch out a first working-level diagram that captures the information gathered. When a diagram is first drawn by an author, it is considered to be at working level. For a diagram to progress from working level to draft level, it must go through a reader review by one or two other authors. This review should catch obvious errors and should ensure that the basic concepts and method are applied correctly.
Timing is crucial. If the interview note-review process is delayed, the information will become less meaningful and misunderstandings may creep in. Drafting diagrams during the interview has not proven to be practical for most authors, since facts usually are provided in a disorganized sequence and may be clouded by irrelevant side remarks.
The first task for the author reviewing the interview notes is to make a data list of all things mentioned during the interview. The list identifies the primary elements of data—resources, people, raw materials, and so on—that are used and created by the system to be modeled. This list will most likely consist of twenty to thirty items, some of which are self-contained and some of which are related to others. The next step is to bundle these items into groups, such as types of plans, instructions, reports, financial data, and the like. Groupings should be made up of similar kinds of items that can be bundled, like wires in an electrical conduit, and then passed along to other activities that will make use of them.
After listing and bundling the data, the lead author is ready to focus on the activities themselves by considering which ones either use or produce the data in the bundled data list. Once the list of activities includes either production of or use of all data items on the list, the author can be confident that he has completed the task.
Topics mentioned by the expert in the interview should now be cross-checked with the newly created usage-based activity list to see that there are no holes, either in activity or in data elements identified. As we have discussed, the maximum number of activities permitted on a single IDEFO diagram is six, so if more than six activities result from this effort, they should be clustered into more general activities that encompass an entire set.
Finally, the set of activities must be split and re-clustered based on level of complexity. That is, if one or two activities are simpler to accomplish than the others, the resultant diagram will not be balanced. Some activities will be hard to understand, while others will be very simple and uninteresting.
Once six or fewer categories of activities have been identified and named, and once all activities and data mentioned in the interview are included somewhere, the author lays out his first diagram draft. The diagram follows a staircase layout, with those activities generating the most outputs placed toward the upper left of the diagram. It is important to note that action sequence is not a factor in laying out a diagram. An activity that must operate first is not necessarily in the upper-left activity box, because IDEFO diagrams are intended to show constraint and dominance rather than sequence.
When the activity box layout is complete, the author can add arrow pathways to the diagram. Figure 5-1 illustrates the arrow layout rules of IDEFO.
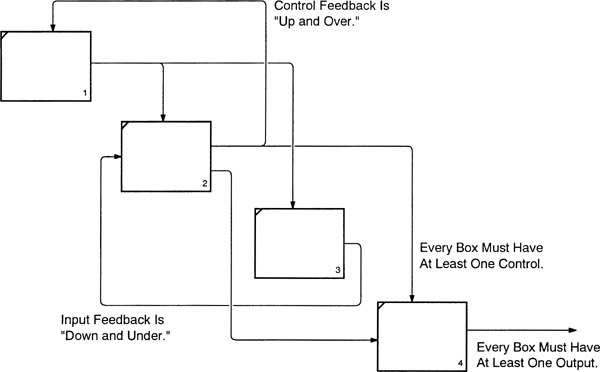
To add the arrow pathways, the author draws the main path arrows first, showing the typical way the activities on the diagram will operate if no unusual events occur. This main path is usually generated by the author’s mentally simulating the action of the diagram’s parent box. As each input, output, and activation of a new box occurs, the author adds arrows for whatever inputs and controls are needed by the activity box.
Once the main path is complete, the author examines each box to determine alternative behavior and feedback that represent the adaptability of the system. In this effort, the author needs to consider how the system reacts to faulty data or error conditions that may occur. This consideration typically causes the number of arrows to increase significantly. If the complexity becomes too great and the draft becomes cluttered, the author should redraw the draft diagram before presenting it to the expert for review.
A rule to keep in mind when adding an arrow is: When in doubt, leave it out. That is, if you are not sure that the information (or material, software, equipment, signal, and so on) provided by an arrow is needed by an activity, then do not draw the arrow. The decomposition process should reveal whether the arrow is really needed.
When all arrow pathways have been added to the diagram, the author must check to see that each arrow is properly labeled. As is true with fork/joins, arrow segments need not be labeled if the name of the main branch is also appropriate for each segment branch. However, if a subset of the entire arrow content is really what is used, a constraining label should be added to each arrow branch to make the diagram more precise.
The author must also check to see that he has not accidentally labeled two distinct arrow segments with the identical label. If identical labels are discovered, the author must add a modifier appropriate to one or the other label to make the two distinct. For example, the label “requirements” may be more precisely identified as “user requirements” or “management requirements.”
Oddly, some new IDEFO authors label input arrows very well but neglect to label control arrows precisely. The model therefore winds up with a set of “fat” all-encompassing arrows controlling very small activities at the bottom of the model. For example, “rules and regulations” would be found controlling a detailed activity, instead of indicating which specific rules and regulations apply.
As the final step during this labeling phase, the authors must define what is on each arrow and record each definition in the model glossary. It is at this point in the diagramming effort that the author is most familiar with what he intended to bundle into his large pipeline arrows, and he can record precise pipeline contents while these details are fresh in his mind. If he waits until later in the cycle, he may not remember all of the elements of the pipeline. The model glossary will also be useful to subsequent readers, who might misinterpret an arrow if they cannot look up what is intended.
Glossary-generating tools may be useful in the diagramming effort and, in fact, some IDEFO computer packages include a facility that enables the user to call for a glossary page for any selected diagram. The tool creates a separate glossary diagram field for each arrow label that appears on the diagram. Using this field as a prompt, the author may easily run through a set of arrow definitions to capture his intent.
Once the glossary has been completed, the author should recheck the diagram to see that it accurately represents his understanding of the facts. To check the diagram, the author may wish to postulate a series of scenarios simulating the action depicted in the diagram. This simulation might consist of the author “feeding” a series of initial conditions to the model to see how it handles each case. Once this “sanity check” has been performed, the author can turn the diagram over to the project librarian for distribution in the form of a reader kit, and can be well satisfied that the job of creating the first-draft IDEFO diagram is complete.
Validating the Model
Although finished with the diagram draft, the author cannot afford to wait for a response from the commenters before continuing the modeling effort. His next task is to examine the diagram and to pick a box for decomposition. It is important for the efficiency of the IDEFO project that the author pick the correct box. The choice should not necessarily be the most complex box or the box that the author knows most about, but rather the box that will reveal the most new information. Typically, this is the box that the author knows least about. Decomposition of it will help the author determine whether he has omitted anything from the model, or has misunderstood something. If an error or omission is not discovered early, the author may waste considerable effort pursuing a misunderstanding, and the activity will have to be remodeled later.
After questions, suggestions for change, and any error notations about the first and revised draft diagrams have come back from the commenters, and after the full set of diagrams in the model has been validated through the reader/author cycle process, text is written to accompany each diagram. This text must not be written during the diagram-creation process, since there is a danger that the author may include facts in the text as a substitute for changing the diagram to include those facts. The diagram by itself must represent the entire model of the topic. The text should not attempt to tell the reader every fact that can be seen by reading the diagram; nor should it be a description of what is contained in the future decomposition of the boxes on the diagram.
Diagram text is best used to discuss boxes and arrows that illustrate the handling of a typical case or that represent a key role by a staff member. However, diagram text is not restricted to this type of discussion; it is open-ended, allowing the author to highlight whatever is important about the diagram (see Figure 5-2 for an illustration of a highlighted diagram).
Once the full model and diagram text have been approved by the designated technical committee and the approval box on each diagram form has been signed, the whole is formatted for publication, printed, and distributed. Publication format for an IDEFO model includes a reduced-size copy of the parent diagram on which the parent box is highlighted by color, gray tint, or shading. This reduced-size diagram is placed in the upper-right corner of the page, which is printed in landscape (not portrait) orientation, and the text for the diagram annotates the remainder of the page (snaking to the left and below the parent diagram). The full-size parent diagram is reproduced on the facing page (see Figure 5-3), with its header field missing. The C-numbers below any boxes that are decomposed are replaced with the page number in the published model document. Following is an example of a single publication-format diagram, with text.

This modeling process is where diagrams are created. The primary modeling steps for IDEFO are presented as boxes 1 to 5. Box 1 includes reading and refining information from documents and notes resulting from initial interviews (box 1 of the parent). The expert is shown as a mechanism to box 1 to indicate that he will be needed to verify facts, explain things that were unclear in the initial notes (111), and provide additional information that comes to mind now that the detailed decomposition of the subject is being authored. Note that the standard stairstep layout is used except for box 6. Box 6 is presented below the stairstep structure to indicate that it is a process of reacting to reader comments and not part of the main diagram generation process.
Boxes 2 and 3 are steps that are sometimes skipped by authors who are in a hurry. However, these steps ensure that the decomposition form of breakdown is followed, instead of one of the other possible forms. A key point that illustrates the use of the data clusters in formulating the list of activities for the diagram is shown at 201 to 3C1. Here, the data clusters are not changed in box 3, but serve to control the selection of the activities that make up the diagram.
The diagram shows not only the initial diagramming process but also the change process resulting from using scenarios as walkthrough tests (box 5), as well as the handling of the revisions to the model due to the reader/author (R/A) cycle critique (box 6). The accepted changes (601) are handled just like any changes resulting from the scenario evaluation (box 5) validation. That is, they are fed back to cause the diagram layout to be changed (box 4) or for major reclustering and rebundling in box 3. Rejected changes are not shown explicitly since they are passed back to the reader as part of the kits with author responses (602).
The diagram indicates that reminders from the librarian (C2) are used only to control the author response to readers. Since this control does not appear on box 1, this indicates that the librarian is not responsible for seeing that the author does his initial modtasks on time, but only that he does not hold up the R/A cycle process.
Modeling Other Viewpoints
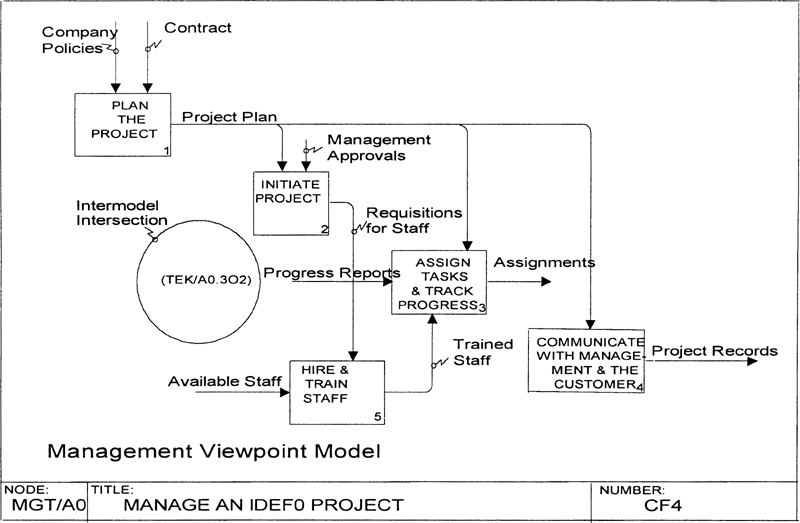
To cover all important aspects of a system, the author may need to create several models from different viewpoints. However, these models are not necessarily independent; activities from one viewpoint sometimes relate to activities from a different viewpoint. For example, a report drawn from the technical viewpoint might record how many hours were spent by each worker each day on a particular task, but the information might also need to be reported at regular intervals to management. This represents an intersection between the technical and management viewpoints and indicates that the staff working from one viewpoint must interact with the staff from another viewpoint. Figure 5-4 illustrates a model in which technical and management viewpoints are tied while the financial viewpoint remains independent.
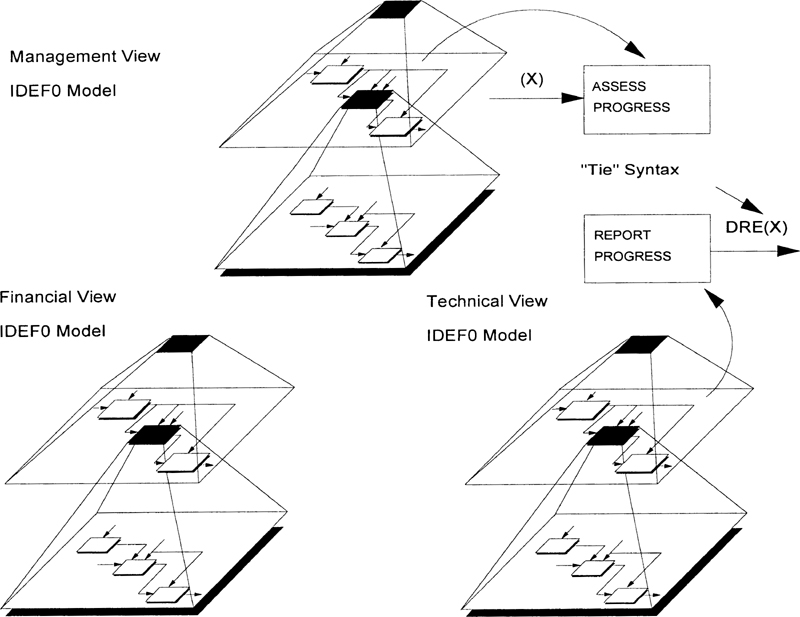
Intersections between two models from different viewpoints must exist as activity boxes in both models. As shown in Figure 5-4, arrows passing information back and forth between two viewpoints are connected using a DRE reference at the end of each unconnected boundary arrow.
Figures 5-5 and 5-6 show the occurrence of an intermodel intersection. Figure 5-5 contains the AO diagram of the management viewpoint (model name MGT). Box 3, ASSIGN TASKS & TRACK PROGRESS, has an intersection with the technical viewpoint (model name TEK). What Figure 5-6 shows is that, on a regular basis, the librarian reports the status of the reader/author cycle to the project manager (output 2 of box 3). This arrow (3O2) indicates an interface from the technical viewpoint to the management viewpoint. The DRE at the head of arrow 3O2 identifies the point at which the data is received by the management viewpoint activity (MGT/A0.3I1). In Figure 5-5, the unconnected arrow tail into box 3 is labeled TEK/A0.3O2 to indicate that the source of this data is in the technical viewpoint model, diagram AO, third box, second output.

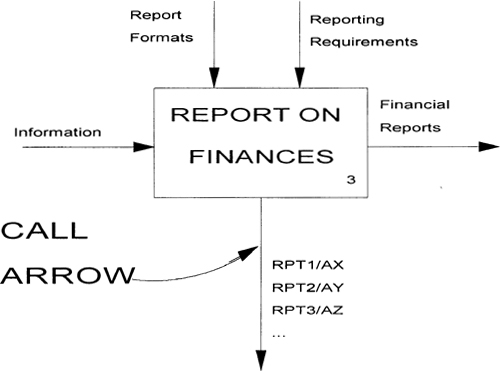
In the preceding example, and in any case in which various viewpoints intersect, multiple models at the same level of abstraction are linked using the DRE language to pinpoint intermodel connection points. In any case in which two different levels of abstraction (integrating multiple viewpoint models) are linked, the call arrow syntax is used to indicate that the decomposition from the present level of abstraction is complete and that further details are to be found at the next lower level of abstraction. This form of level x to level x+1 connection is illustrated in Figure 5-7, which depicts a situation in which the author has decided that it is no longer useful to model the activity report on finances in general, preferring instead to model specific types of reports: RPT1, RPT2, RPT3. As in the previous example of inter-viewpoint model intersection, the DRE notation is used to identify the specific point in the model referenced alongside the call arrow. In this case, the DRE identifies the box in the called model that corresponds to the calling box (REPORT ON FINANCES).
Using Node Diagrams, Schematics, and FEO Diagrams
It is critical to develop a useful model that contains the information needed to satisfy the purpose for which the model was developed. However, if the model sits on the shelf, or if the presentation of modeling results does not convey its meaning to the audience, a significant portion of the model’s value will be lost.
One method of illustrating the content of the model is the node tree, or node diagram. A wall chart containing the node tree provides a very effective way to show management the breadth and depth of information contained in the model. Whenever a particular aspect of the system needs to be understood or changed, the node tree can be used to locate the specific IDEFO diagrams that present the needed information.
Figure 5-8 shows the node tree for the patient management portion of the model of a joint Veterans Administration/Department of Defense hospital. By examining the activities in the model as shown on the node diagram, any viewer can see an overview of the content of the model, including which activities are broken down to what level of detail. For example, inspection of the node diagram in Figure 5-8 shows that activity A221 (Provide AF Inpatient Services) is broken down, but activity A24 (Handle Patient Discharge) is not further detailed in the present model. This tells the viewer that the manager can retrieve the detailed picture of Air Force inpatient handling, but the viewer would have to request further IDEFO modeling to obtain details of how the patient discharge process works.
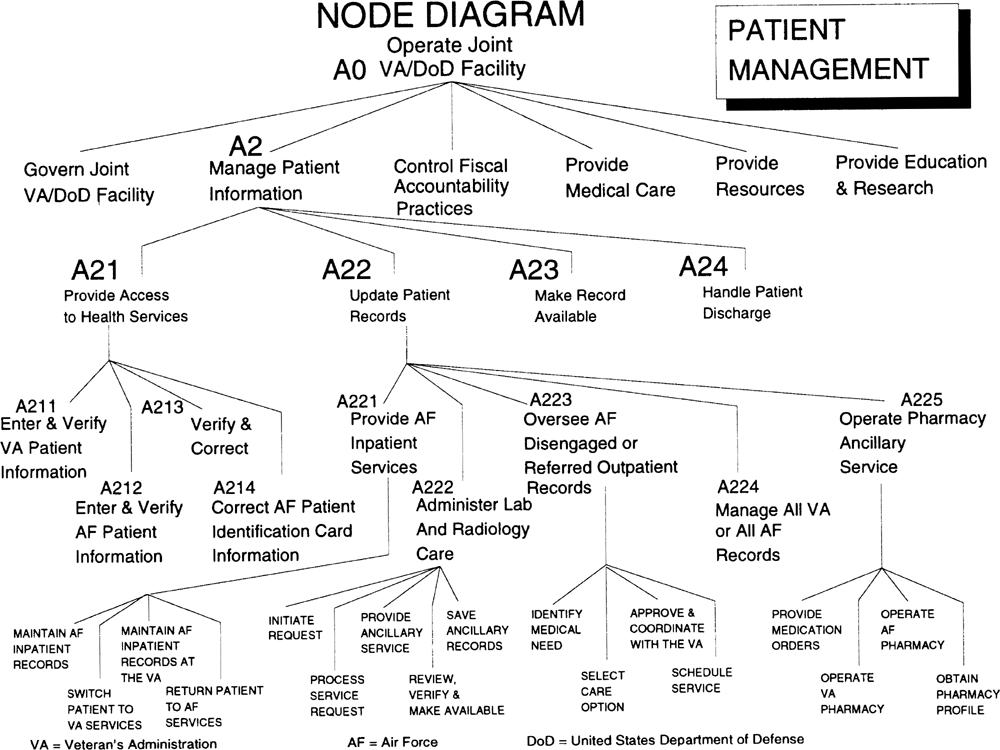
The node diagram facilitates communication by allowing management to sit back and contemplate the operation of the enterprise as modeled from a solid technical foundation. Furthermore, management and staff can discuss operation of the enterprise using the node diagram as a baseline, confident that they are using the same well-defined terms for specific activities.
Node diagrams are valuable, but they are not sufficient models in and of them-selves; they do not constitute a true IDEFO model. Because of the node diagram’s utility to management, it is sometimes the only so-called model developed in some organizations. One problem with this practice is that the resultant node diagram is not based on careful analysis (that is, it is not developed using step-by-step IDEFO procedures) and is thus not well-founded in fact. A second problem is that the node diagram alone cannot bring about the many benefits derived through development of a true IDEFO model (for example, benefits associated with impact analysis).
Another form for presenting model results is a schematic, which is also the basic chart used in a model walkthrough. A schematic is developed by laying out the bottom (most detailed) level of an IDEFO model on a large sheet of paper and then connecting the arrow pathways (see Figure 5-9). It can be helpful to color-code the types of data on the arrows. For example, use red for raw materials and product, green for controls, and yellow for feedback.
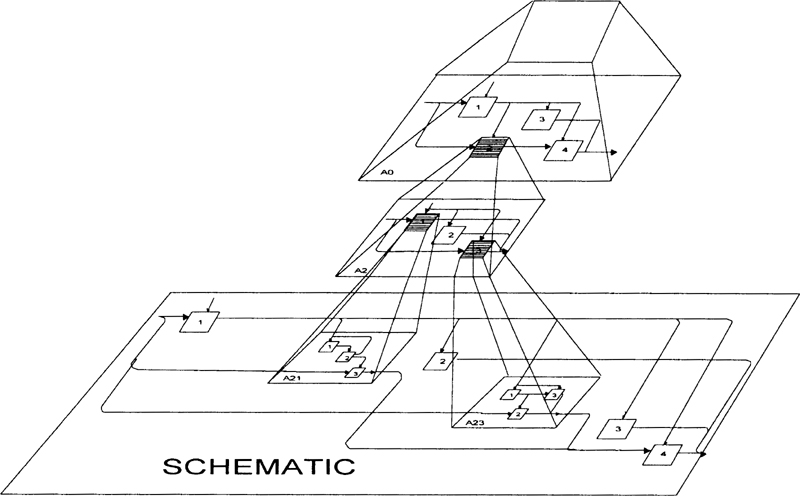
For a walkthrough presentation, the presenter can attach the large schematic sheet to a wall and lead the audience through it, pointing to the relevant activities or arrow paths. Further questions and conclusions may be presented as they occur, such as “Notice that since there are no yellow arrows in this vicinity, there is no feedback here. Is this correct?” Specific events to test the completeness and accuracy of the model may be proposed by the audience, developed prior to the start of the meeting, or both.
The schematic format may seem to contradict one of the basic principles of IDEFO—that information be provided in small, easy-to-understand chunks. However, a walkthrough using a schematic is by far the most effective way to lead an audience through the model so that the audience can evaluate the correctness and completeness of the model. The schematic eliminates the need for lots of paper shuffling while connecting the arrow interfaces, enabling the audience to see both ends of the interface.
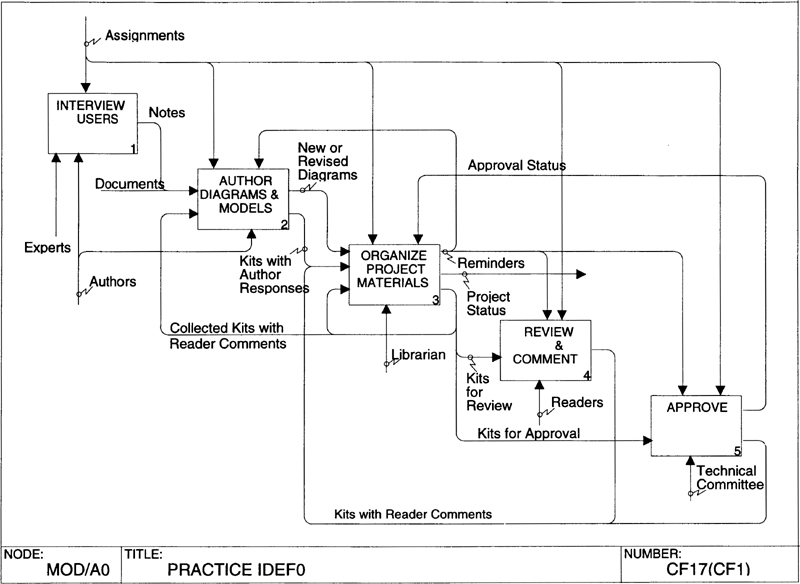
A third and final form for presenting model results is the for-exposition-only (FEO) diagram (introduced in Chapter 4). On an FEO diagram, the author is not restricted by IDEFO modeling rules. For example, more than six boxes can be shown if this is helpful in making a point. A common use of an FEO is to show a particular pathway to illustrate a specific scenario. Figure 5-10, “Practice IDEFO,” could be used to train new librarians in their duties, because it highlights instances in which the librarian is called on to perform record-keeping and reporting tasks. Seven such events and their successive scenarios were developed for this training to cover the total spectrum of librarian duties.
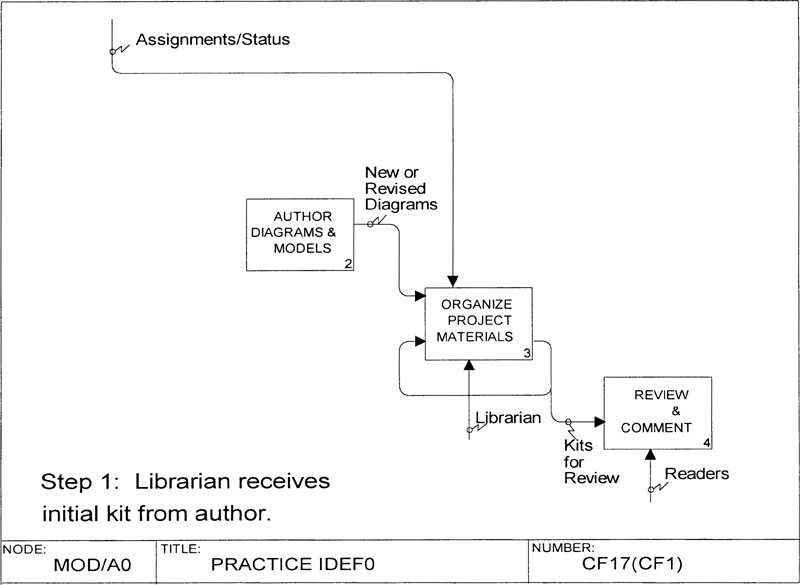
Figure 5-10 presents one of the seven FEO diagrams in this training package. It represents the initial submission of working-level approval kits to the librarian. In the version shown, all unrelated boxes and arrows have been removed, leaving only the elements of interest to the scenario. By creating six additional FEOs, the modeler completes the set of training materials for all seven events handled by the librarian. An alternative form is to leave all boxes and arrows on the diagram but just highlight those of interest to the particular viewpoint or scenario.
The bundling and branching of arrow contents is often spread over many diagrams. This spread makes it difficult to identify arrow structure or to check the structure for errors, such as an arrow coming out of a process that was never bundled into the pipeline arrow.
Some new software tools provide checks for this phenomenon. However, where particularly critical arrows are involved, it may be helpful to draw an FEO that illustrates the arrow bundling and branching picture on a single diagram form. An illustration of such an FEO (taken from a mission-planning Gulf War model) is shown in Figure 5-11.
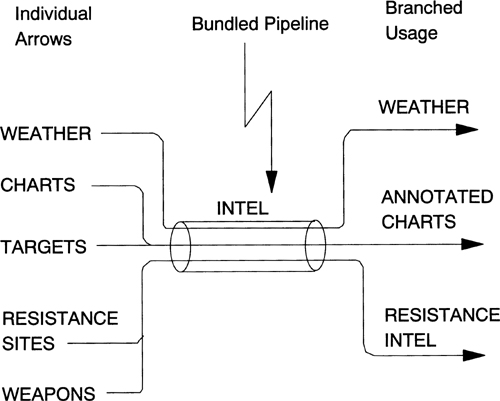
Looking at Figure 5-11, we see five arrows on the left side, labeled Weather, Charts, Targets, Resistance Sites, and Weapons. The five arrows are bundled into a single, large arrow in the center, labeled Intel.1 The right side of the figure shows three arrows emerging from Intel, labeled Weather, Annotated Charts, and Resistance Intel. This FEO illustrates the content of the arrow Intel, and shows the following facts about that large arrow:
![]() The individual arrow Weather is contained within Intel but also emerges as Weather when it is split out as a control arrow.
The individual arrow Weather is contained within Intel but also emerges as Weather when it is split out as a control arrow.
![]() Charts and Targets are part of Intel but are also used under the label Annotated Charts when split out from Intel.
Charts and Targets are part of Intel but are also used under the label Annotated Charts when split out from Intel.
![]() Resistance Sites and Weapons are included in Intel and are also bundled into the arrow labeled Resistance Intel when used in the model either as an input or as a control.
Resistance Sites and Weapons are included in Intel and are also bundled into the arrow labeled Resistance Intel when used in the model either as an input or as a control.
1 Intel is used here to identify intelligence data used for strike planning.
The information contained in this FEO could be deciphered by a determined reader, but it might take the reader considerable time and effort to follow the Intel arrow backward to identify the arrow joins (the five individual arrows that join to form Intel), and forward to find the three places where the main Intel arrow forks and is labeled with branch labels. The search would probably involve locating and examining many individual diagrams in the model.
The value of the FEO, therefore, is that it enables a reader to identify the information about Intel at a glance. Of course, the definition of the arrow Intel in the glossary should contain the same information, but the graphic FEO form may be more helpful for purposes of immediate communication and emphasis.
Figure 5-12 shows a selected portion of a model (the A31 branch) in which the Intel pipeline is formed via several joins: Resistance Sites and Weapons on A3112, Targets on its parent diagram A311, and the final two elements (Weather and Charts) on A31. Diagram A313 shows Intel breaking down via forking into the three arrows: Annotated Charts, Weather, and Resistance Intel.
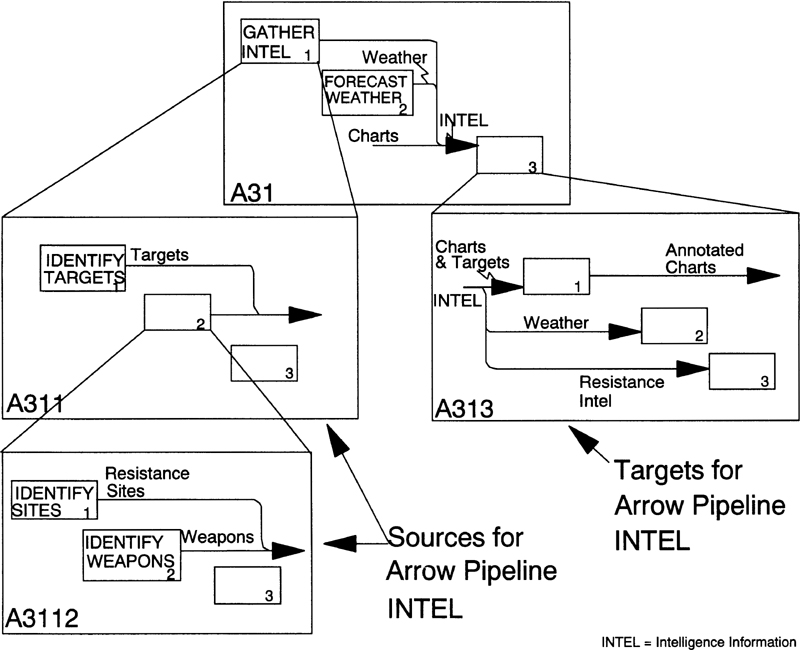
Diagram A313 shows some typical arrow tracing logic. Intel is shown forking into three parts: Charts & Targets going into box 1, Weather going into box 2, and Resistance Intel going into box 3. An analysis of the Intel arrow source must conclude that Resistance Intel contains Resistance Sites and Weapons, since all other bundled Intel arrow content is accounted for. Furthermore, charts and targets appear to be combined as input into box 1 of A313. When creating the FEO, the analyst would, of course, have to look carefully at box 1 to determine whether the annotated charts are indeed comprised only of charts with targets marked on them or if the annotated charts contain other data as well.
In actual situations, arrow tracing to find sources and targets might be quite complex, and might involve locating and analyzing many diagrams to create an accurate raveled-rope FEO. The example presented here is intended simply to give the reader a feeling for the process of creating such FEOs.
These examples should serve to illustrate the use of FEOs. Any form of figure or text is permitted as an FEO to illustrate a point about the model. Other forms of FEO include timing data superimposed on the boxes and arrows, number of personnel and cost data written on the mechanism arrow, AS-IS and TO-BE variations, and so on.
Using the Reader/Author Review Process
The important difference to keep in mind between a graphical modeling language and a complete methodology is that the latter includes the procedures and tools to make proper use of the language. With IDEFO, the interview procedures, the guidelines for creating diagrams, the configuration management of models and documents, the peer review using the reader/author critique cycle, and the model walkthroughs are all essential to the successful application of the method.
A manual configuration-management procedure, including forms and records-keeping methods, was originally a part of the IDEFO tool kit. The manual approach has been replaced by comparable facilities in each of the computerized support tools for IDEFO. Many of the support tools also provide assistance with the critique of models. This process constitutes the R/A cycle, which represents a back-and-forth communication path; its purpose is to verify and validate models and to reach consensus among the staff that needs to understand and agree with model content.
To set up a reader/author review cycle, the project manager must decide who should review what and at what point in the modeling process. Although who reviews and when is up to the project manager, the process is not. The IDEFO method defines four levels of approval (working, draft, recommended, and publication), with a select list of readers who must reach consensus for the model to move from one level to the next higher level.
To move from one level to the next, a diagram must be reviewed and approved by an audience of a specific viewpoint. For example, to achieve recommended level, the diagram is assigned to a larger group of readers from different backgrounds and interests. Such people must be knowledgeable both about the system being modeled and about who will be affected if changes are implemented. Readers at this third level are not necessarily authors, but they must be committed to the modeling results.
The review committee (see Table 5-1) has final responsibility for approving the model at the publication level. This committee is made up of one or more managers who must sign off on the model before it can be published and be considered accepted. In performing this role, the technical committee has the final say on disagreements that cannot be settled by the reader/author review. Final disagreements are typically few, but they require management sign-off for the resolution of critically important modeling results.
Figure 5-13 illustrates the process of progression through approval levels, of correcting errors and omissions, and of remodeling areas of the model to improve communication and focus.
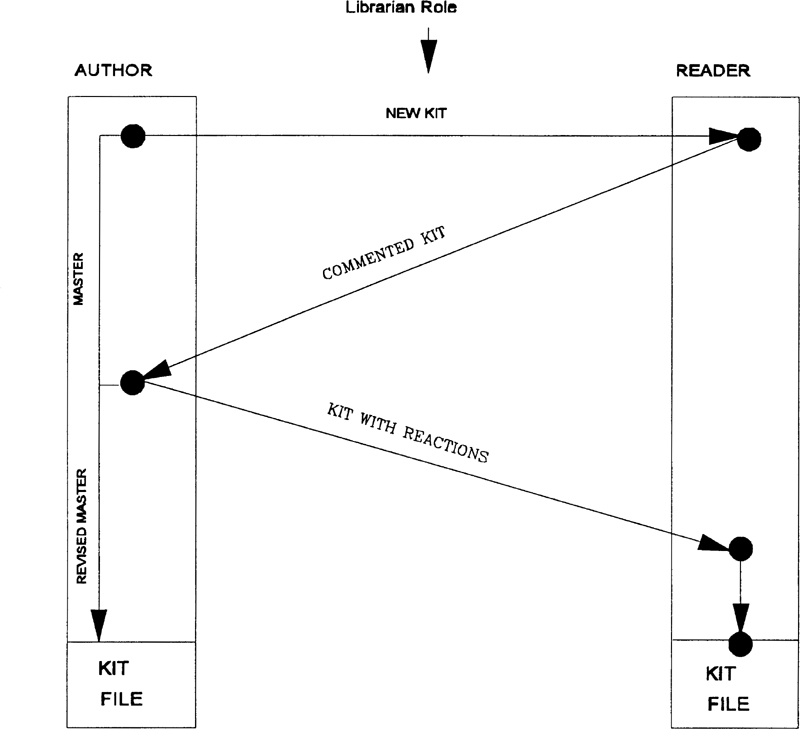
As shown in the upper-left corner of Figure 5-13, the R/A cycle begins with the author, who generates the first version of one or more diagrams. When he is satisfied that the story being told is basically correct, he saves the master copy and creates a reader kit containing one or more working-level diagrams that he considers ready for review. This kit is copied and distributed to the list of readers for the first level of approval (shown by an arrow from upper left to upper right of the figure). Each reader then comments on the kit of diagrams, using the commenting procedure. Comments and suggestions are written on each sheet of the kit, and remarks that pertain to the entire kit are noted on the cover sheet (see Figure 5-14). Readers then return their marked-up kits to the author.
The author reviews and responds to each comment from each reader. Suggestions that the author decides to accept are written on a clean copy of the kit and are used to prepare the revised master of the diagrams. The kits with reader comments and author responses are then sent back to the readers for their information (left center to lower right of Figure 5-13). When each reader receives his kit with responses from the author, he reviews individual comments and responses. Those responses he disagrees with are noted, to be resolved in a subsequent meeting with the author. Each reader then files the marked-up kit for reference when the updated kit of diagrams is distributed at a later date. This completes one round of the reader/author cycle.
The author begins the second round by updating the master copy of the diagrams and distributing a second kit containing the revised diagrams to the same set of readers. This time, readers compare their marked-up kits from the previous round to check changes made in response to the set of suggested improvements.
The reader/author cycle continues until consensus is achieved on all diagrams. If disagreements remain between the author and one or more of the readers, this is resolved at a meeting of the technical committee. When all issues are resolved, the diagrams in the kit are raised to the next appropriate approval level by marking the box in the upper-right corner of the diagram form. The next reader/author cycle is then begun, to achieve the next level of approval, until the publication level of approval is achieved.
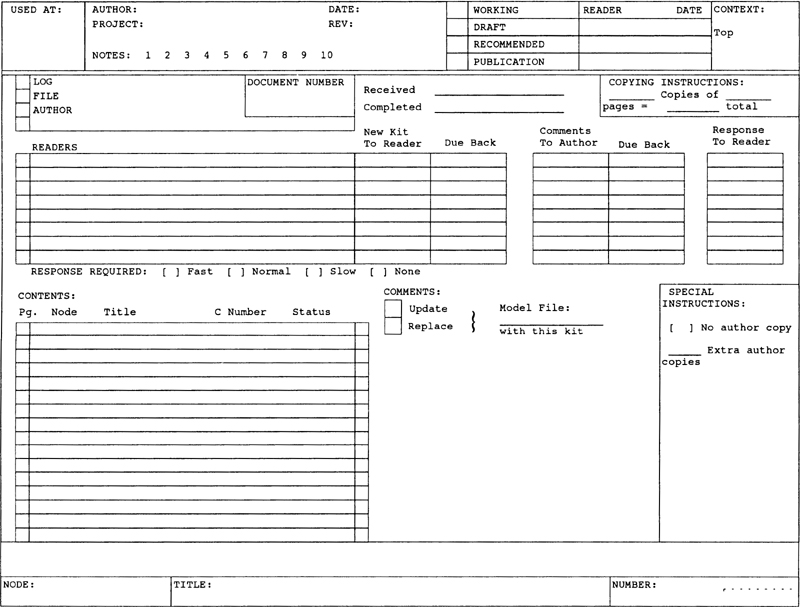
The kit cover sheet used in reader kit processing is patterned after the diagram form in that both have identical header and footer pieces. The information field found at the center of the page of a diagram is replaced on the kit cover sheet by the information needed to move the kit through the reader/author cycle.
The project librarian is responsible for keeping track of the kit cycle and therefore keeps the cover sheet updated. When a kit of diagrams is received from an author, the librarian assigns it a unique document number, writes the number in the designated box at the top of the form, enters the date the kit was received, and authorizes copies to be made for the desired set of readers.
Readers are selected by the IDEFO manager prior to distribution of any kits. When a kit is received, the readers’ names are written in a column on the top-left side of the cover sheet. The urgency of the response (fast, normal, or slow) or the fact that no response is required is checked off, according to project policy. (“Fast” may vary from a few hours to a week, depending on the geographical location and availability of the readers.) The librarian enters dates and times into the fields to the right of the names, as the cycle progresses.
The node number, title, C-number, and status of each sheet is entered into the contents column at the lower-left quadrant of the cover sheet. The preprinted letter corresponding to each sheet in the kit is then copied from the left side of the contents field and then entered in the small dotted rectangle at the extreme lower-right corner of each page.
Many of the mechanical kit-processing tasks are now supported by the same computer tools that are used to generate IDEFO models themselves. Where automated kit processing is available, an electronic version of the kit cover sheet is used. The tool supports kit preparation by automatically filling many of the fields on the kit cover sheet. For example, the author’s name, the date, and the document number may be supplied automatically when the author calls for the generation of a kit. Diagrams to be included in the kit may be selected by the point-and-click method, using the node index. If the tool is connected to a network, support often includes sending kit copies through the network to each of the readers and receiving back comments via the same network.
The reader/author kit cycle is the key peer-review process of IDEFO. The project manager of a BPR project that uses IDEFO should take into account this aspect of tool support when determining which tool to purchase in conjunction with his IDEFO modeling effort.
The reader/author cycle is the least expensive form of review and requires the least amount of management overhead time, since each reader may review the kit on his own schedule, thus relieving management from the task of organizing review meetings. Readers are given due-date schedules on the kit cover sheet, specifying when the comments are due to the author. Similarly, the author has a due date for his responses to the readers. However, this schedule depends on an honor system among the readers and authors, which sometimes breaks down. The breakdown is not necessarily due to negligence, but rather to many other potential delays and conflicts. To break any such logjams, a back-up walkthrough procedure is used. The walkthrough procedure is simply a step-by-step presentation of each diagram to an audience of readers. It provides a thorough examination of the diagrams in an orderly, prescribed way. The goal is to uncover oversights and errors in the diagrams as the readers follow the story being told via the walk-through.
Of course, the walkthrough procedure is an approach to presenting an IDEFO model to an audience in general. In some cases, the audience may not be trained readers of IDEFO models, and more care must be taken to present basic reading rules at the outset of the walkthrough meeting. In other cases, it may be preferable to convert the model facts into a different presentation form (schematics, bar charts, and so on) to match the level of abstraction of the audience.