Appendix E. A Modeling Process Case Study
The following study of Ben’s Burgers is based on the model of a small restaurant chain. The example is used in an IDEFO workshop to teach students how to develop IDEFO models. It is designed to provide practice in developing an IDEFO model, and it describes a realistic environment that is typical of what will be encountered in real environments. The information is presented as an interview with the owner of the restaurant chain who details his ideas for improvements. Your job is to listen, model the AS-IS operation, and identify as many improvements as possible, including those originally expressed by the owner. You may also wish to provide a TO-BE model showing a vision of future operations.
Background of the Restaurant
Ben’s Burgers is a chain of twenty restaurants located in New Jersey. They serve basic fast-food fare: hamburgers, hot dogs, fries, sodas. Most of the locations provide indoor seating, but a few are small take-out facilities with a walk-up window and a few picnic tables. Most of the restaurants also have a drive-through window.
The restaurant chain has experienced tremendous growth in the past few years, and Ben is fast losing control of the information he needs to maintain in order to expand his operations further. He is also losing the close contact with his customers that characterized his restaurant chain and was in a significant way responsible for his success.
Ben’s background before opening the restaurant chain has had an influence on his outlook. He left an executive position with a major airline to found Ben’s Burgers. Therefore, he has seen how information technology can be a critical component of an enterprise. Because of this, he wants to use information technology in as much of his operation as possible, so long as the automation does not negatively impact the quality of his food or the service he provides to his customers.
Excerpt from an Interview with the President and CEO
Ben: “I started nine years ago selling burgers, hot dogs, fries, and sodas out of a stand in downtown Princeton. The place had four parking spaces, two picnic tables, and no indoor seating. I’m sure you’ve seen lots of places like that one. It turns out that a good burger at a good price is just what Princeton needed, because we could barely make them fast enough. So I leased a small restaurant down the block and added a few menu items, but kept the same basic business plan. A good burger, cooked just the way the customer wants it, with all the fixin’s or none of them, whatever the customer wants.
“One of the things that made us successful in the early days was that I made an effort to remember our customers and how they liked their burgers. I took pride in remembering if they liked them medium rare, with onions and lettuce, or well done with lots of ketchup—that sort of thing. People like to be recognized and remembered. Of course, now with twenty restaurants in the area, we have lost that. Most people don’t have my knack for remembering faces. Jeff Shermon has some ideas in this area, but I’ll let you talk to him about them later.
“Each manager currently has his own tracking system. Things like orders, deliveries, and payments are tracked. It just takes me too darn long to review what is going on with twenty slightly different systems in place. I want one computer system that everyone can use so that they all are doing things more or less the same way, or at least so that I can see the numbers easier than I can see them today. In fact, I spent all morning trying to review the orders from the Morristown store. The guy is a good manager, but his handwriting is impossible. Turned out everything was in order, but I just don’t have the time to struggle with stuff like this anymore. I need it right at my fingertips.
“That’s where we’ve been and where we are today. Here’s where I want to go. Even though we are relatively small, I am spending way too much time on administrative duties like ordering, evaluating suppliers and restaurants, payroll, and things like that. I have played with the numbers, and I believe that if Ben’s Burgers makes an investment in information technology now, I will save myself and my employees a whole lot of time. Also, I think I will be able to make better decisions about how my managers are doing at each location, what items should be advertised, and things like that.
“I think I need a central computer at the corporate office here, plus at least one PC at each store. This way, they can all share the same information and I can track all the stores in a consistent way.
“Here is one problem that I’m having that I think can be improved by putting some type of information system in place. I am committed to Ben’s Burgers always using the finest, freshest ingredients I can get my hands on. Currently, all of the restaurants do their own ordering—chopped meat, lettuce, ketchup—things like that. This has resulted in two problems: First, I am not getting the volume discounts that I could be getting if we had some type of central ordering system; second, I’ve caught a few of my managers ordering second-rate ingredients from suppliers I don’t want to deal with. Some of my managers tend to focus too much on short-term profits. They figure if they can save a nickel a burger on beef, their numbers will look better. I want them to spend the extra nickel and keep the customer. Basically, I need some type of integrated ordering and payment system. This way I can easily ensure that orders and checks only go to approved vendors for the products they are approved to supply.
“Another problem is a result of giving store managers a lot of freedom when it comes to putting new items on the menu. The problem is that when one of the items is a big success at one restaurant, the others start selling the new menu item—but each restaurant starts making it a little differently. For example, here is what happened when the Trenton restaurant came up with the idea for a big sandwich, a quarter pound of beef with a slice of onion on top. They called it a Big Ben. Well, it sold so well that other stores started picking it up. Problem was, a customer that got one with a big raw onion in Trenton would get one with grilled onions in Princeton and one with no onions in Wayne. What I need is a record of standard menu items. If more than one store has something on the menu, they all have to make it the same.
“Talk to Jeff Shermon. Jeff is in charge of opening new stores. He is also my right-hand man on special projects and new ideas. Jeff was my third employee, right after the first short-order cook. He started out picking up garbage in the parking lot and in no time at all he was ordering supplies, managing the order takers, and helping me open new stores. In the early days, Jeff was the company. In any case, he has an idea of how we could get some of the customer recognition back that we had in the old days. I want you to talk to him. I don’t know if I can afford to implement all of his ideas, but I want you to be aware of them, so that they can be easily added later.”
Excerpt from an Interview with Jeff Shermon
Jeff: “Okay. Here is my idea. In the old days, Ben knew just about everybody who walked up to the counter. It was amazing. ‘Hi, Bob. That’ll be a cheeseburger, well done, with a large orange soda, right?’ I think that was a big part of Ben’s Burgers’ success. Obviously we can’t do that anymore, so what I would like to do is give our customers a Ben Card, just like an ATM card. When we give one to a customer, we have him fill out a form with his preferences—things like how he likes the burger, how much ketchup, what size fries, with or without onion—things like that. Before a customer places his order, we would have him run his card through a card-reader machine, and the person taking the order will have all of the knowledge in front of him that Ben used to have in his head. Not only that, but we will be able to offer bonuses to our frequent customers, just like the airlines.
“Also, Ben thinks that if we had a record of common orders, we could do a better job of offering and advertising packaged meals. If we find that people who order fish sandwiches don’t usually order fries, we don’t want to advertise a special featuring those two things together. If, on the other hand, it turns out that people who order big drinks also tend to order big fries, we will probably want to come up with some kind of special that makes those folks think they’re getting a good buy.”
Modeling Ben’s Burgers
Notes from the interview should be used as source material for modeling the business. The seven basic modeling steps are presented in Figure E-1.

After selecting the purpose and viewpoint of the model (step 1), the author develops a set of diagrams, looping through steps 2 through 5 until there is sufficient model to run the scenario (step 6), and then to conduct the reader/author cycle (step 7). The process begins again at step 2, until the model is complete.
The following nine diagrams (Figures E-2 through E-10) present an overview of step 1 and a detail-oriented breakdown of the overview. As the first step in creating a model, select the purpose and viewpoint. In modeling Ben’s Burgers, we have several candidates.
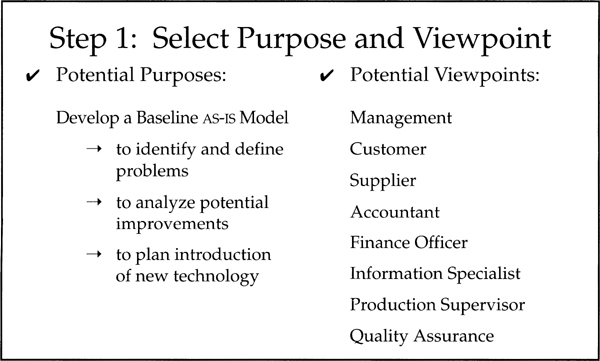
First, prepare an AS-IS model to show how the restaurant chain now operates. The problems troubling the president may be better understood if modeled, rather than being left vague and unclear. Furthermore, some of the reasons behind the way things now work may not be obvious to the president, and a detailed picture of the present operation may explain away the mystery. Figure E-2 suggests possible approaches.
Certainly, if a new system is to replace the existing order and tracking systems, we must not overlook important features and thus inadvertently reduce the functionality available to the managers. Events and records that now provide important information must be matched or replaced by an equivalent or better feature in the new system, or managers will be reluctant to use the new system.
After step 1, you should have an AS-IS model you are satisfied with. Next, develop a TO-BE model, which will show how the operation will work after implementation of the improvements (see Figure E-3). This TO-BE model allows the analyst to capture the business owner’s vision of the future operation. Furthermore, the author can demonstrate the business owner’s plans for the future by conducting reader reviews and walkthroughs with the staff. Consensus can be reached so that all personnel are supportive of the change. Such a model serves as a baseline against which to estimate cost and time savings to be derived under the improved operation. It also serves as a valuable training aid for new staff and for retraining current staff.
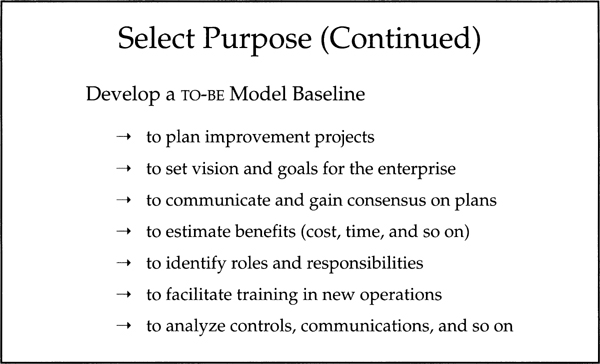
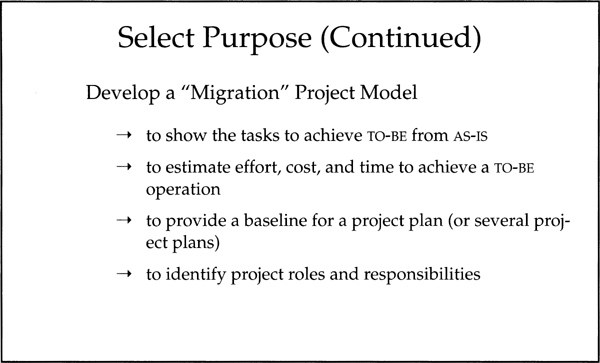
Next, develop a project model, which depicts the tasks to be performed to evolve from the AS-IS to the TO-BE operation. It forms the basis of the project plan, which also includes schedules, definition of deliverables, and so on. Roles and responsibilities are also shown as mechanisms, with accompanying text to spell out specific responsibilities of each participant. The project plan may also be used to estimate the cost and time required to implement the changes, using an activity-based costing (ABC) approach. This is done by estimating the time required to process each activity box, the number of times each box will be activated, and the number of personnel required to perform the task.
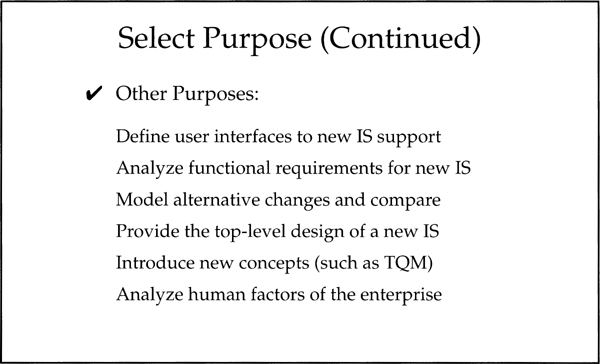
Other reasons to create the TO-BE model include providing a precise definition of the user interface to the new information system, analyzing functional requirements and their cost, considering alternatives and new ideas, and considering the human factors that often make or break the new system. (For example, the human factors include the willingness of the users to make proper use of the new system.)
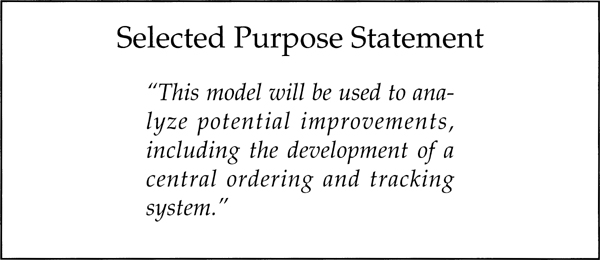
The selected purpose statement for model development is presented in Figure E-6. The statement is worded to specify the primary goal—in this case, developing the new ordering and tracking system—but also to leave the door open for potential improvements that come up in the process of modeling the AS-IS picture. The implications of the selected purpose is that the model
![]() Acknowledges the current operation detail by
Acknowledges the current operation detail by
![]() retaining useful elements
retaining useful elements
![]() demanding precise definition of IS requirements
demanding precise definition of IS requirements
![]() defining needed user interfaces
defining needed user interfaces
![]() Dictates the approach to decomposition
Dictates the approach to decomposition
The viewpoint needed to model Ben’s Burgers must be representative of those people responsible for areas of improvement—the managers (see Figure E-7). Thus, we will not focus on the customers, the preparation of the burgers them-selves, or the like, but rather will focus on the business aspects of the operation.
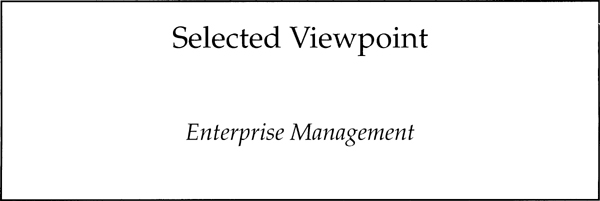
We select the model viewpoint to represent all restaurant management, including the president of Ben’s Burgers and all individual restaurant managers.
Now that the purpose and viewpoint have been selected, review the interview notes and list all of the data items mentioned in the interview. After studying this data-oriented list, list all activities that make use of the data items or that indicate new ones to be created. (See Figure E-8.)
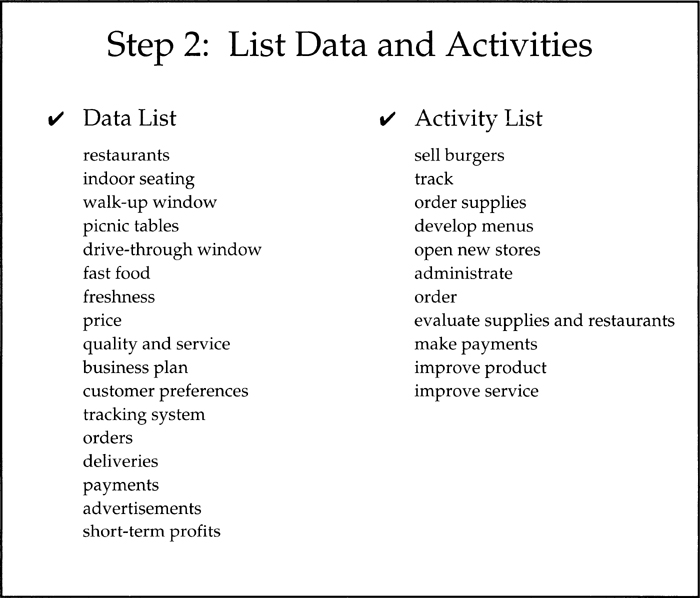
Eleven activities resulted from the analysis shown in Figure E-8, but IDEFO rules tell us we must next cluster them to reduce the number to six or fewer. Since we are doing a functional decomposition, the first consideration is to look for functional similarities and activities that are of interest to the selected viewpoint. Also, are any of the activities very much simpler than others on the list? If so, these are good candidates for clustering.
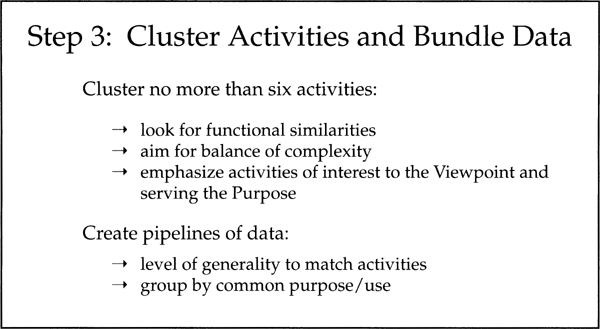
Once the activity list is clustered, look again at the data item list and bundle the data elements to match the level of generality of the new set of activities. Again, individual data items that are functionally similar should be bundled, reducing the model to fewer pipelines.
As an exercise, cluster the Activity List in Figure E-8 to six or fewer activities of approximately the same complexity. Then—without peeking first!—compare your new set with those in Figure E-10.
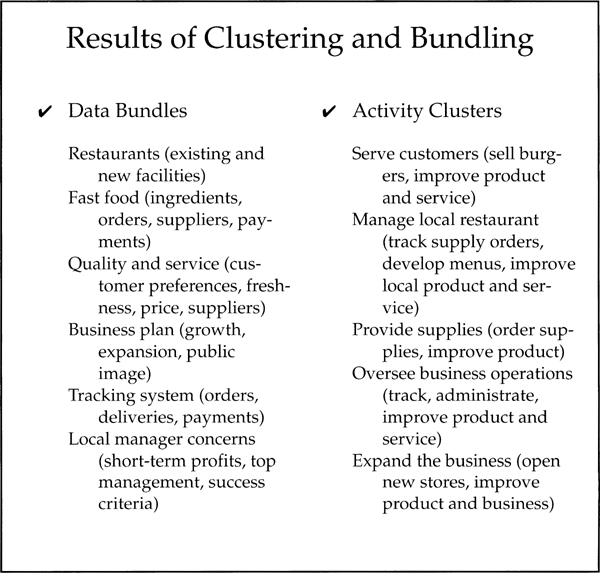
This last step of clustering represents the heart of the analysis—the capability of the analyst to see similarities and to bundle separate activities into more general groupings. Actually, each person attempting to do this will most likely come up with a different set of activity clusters and data bundles. The key is to identify activities of a level of complexity and interest that suits the purpose of the model and the selected viewpoint. Remember that the entire enterprise must be shown in the model, but only the activities and data that accomplish the model’s purpose are emphasized. Of course, only those activities that relate to the model’s purpose need be decomposed. The rest can remain at the general level and serve as an overview of the big picture.
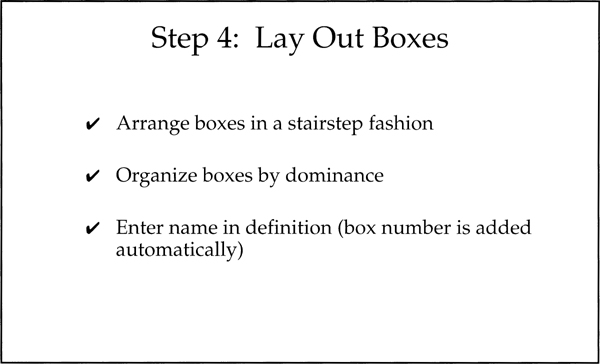
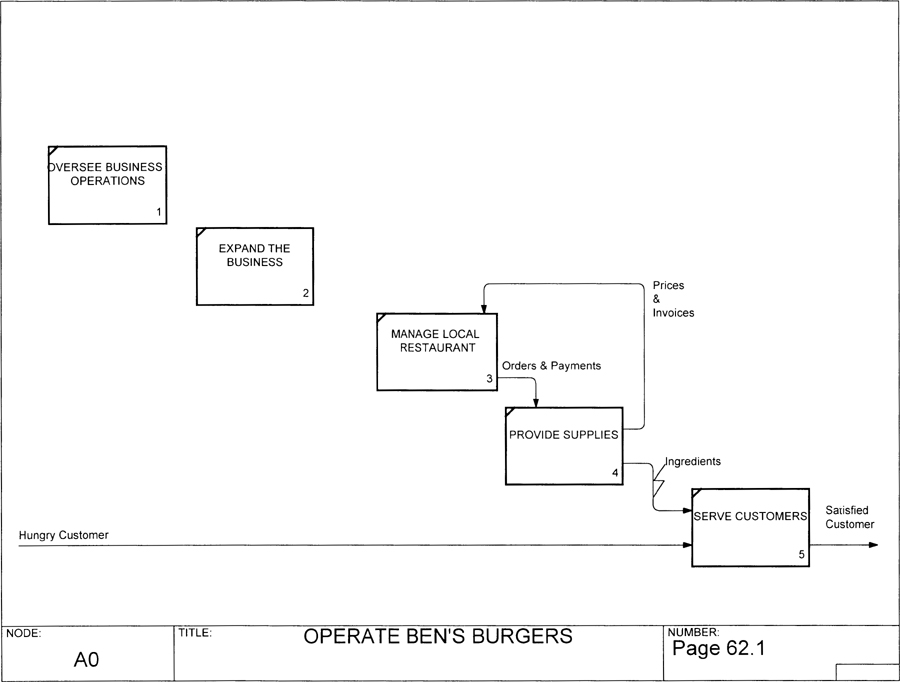
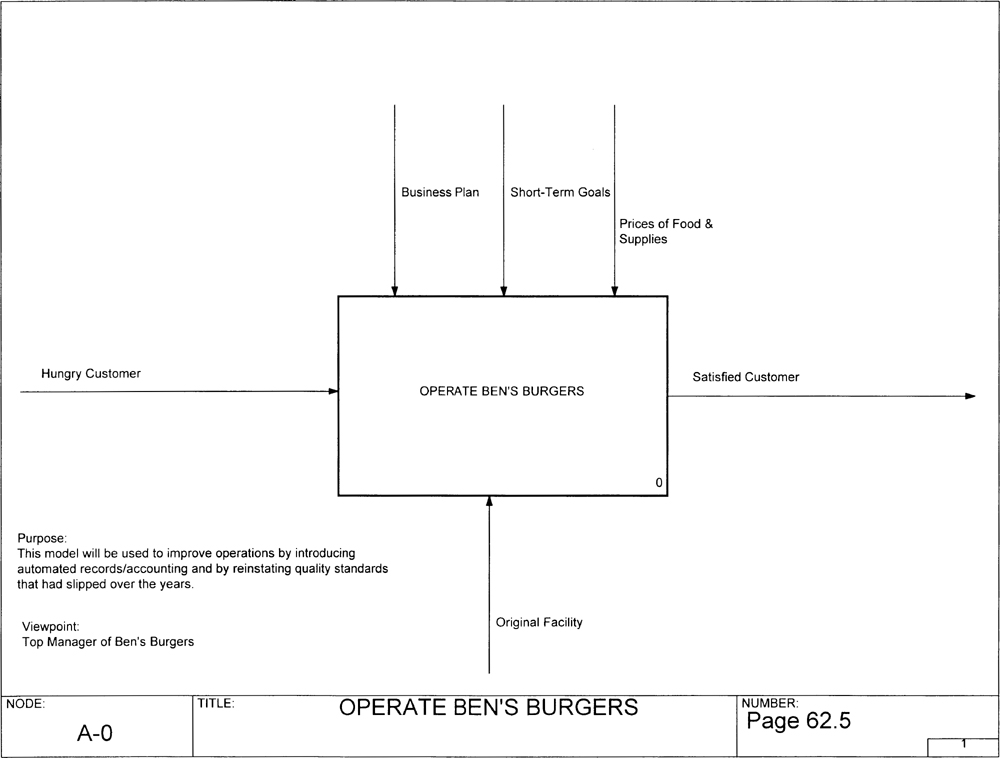
When you are satisfied with the lists of activities and data, sketch the first attempt at a diagram by laying out the boxes in a stairstep fashion. You may change the order later, but the dominance of the boxes should guide the positioning of the activities in the stairstep. (Recall that the dominant boxes generate arrows that control the less dominant boxes.) Figure E-12 shows one possible first diagram.
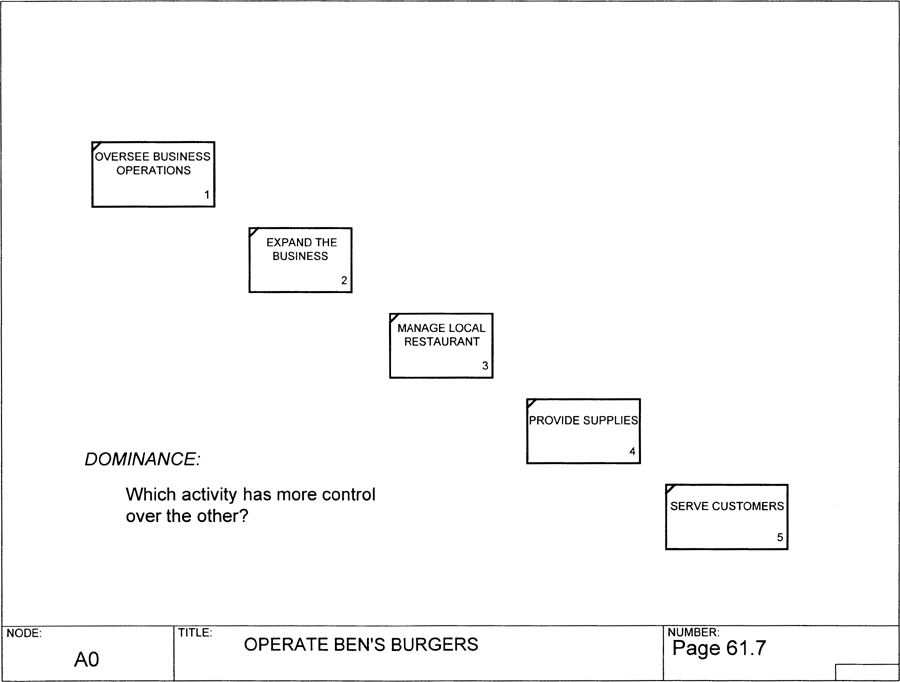
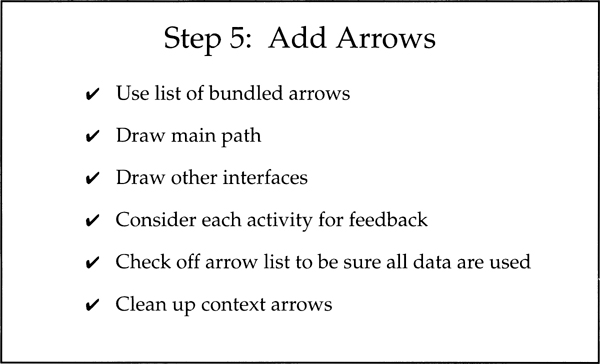
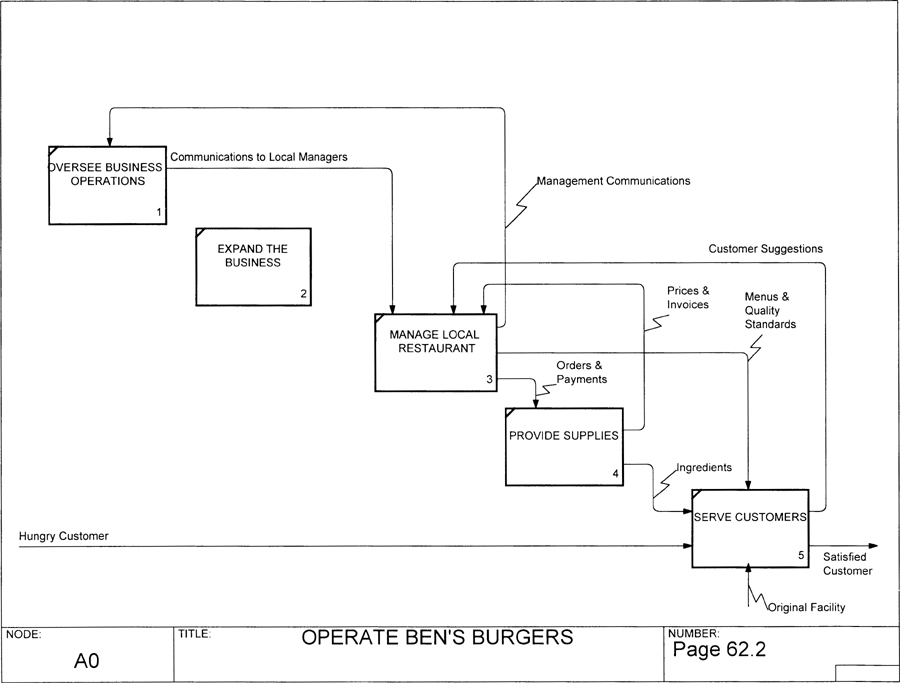
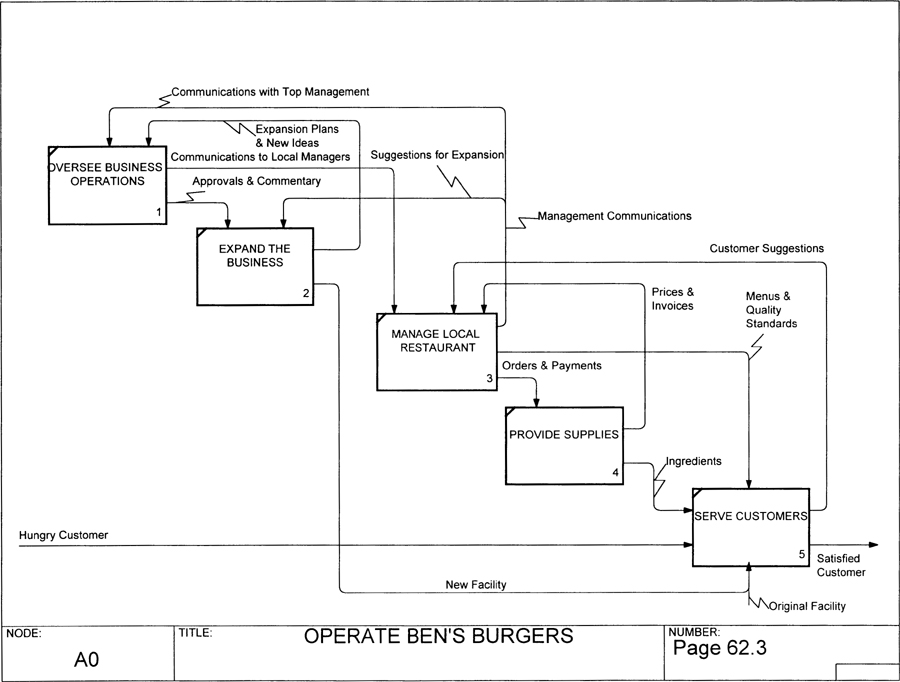
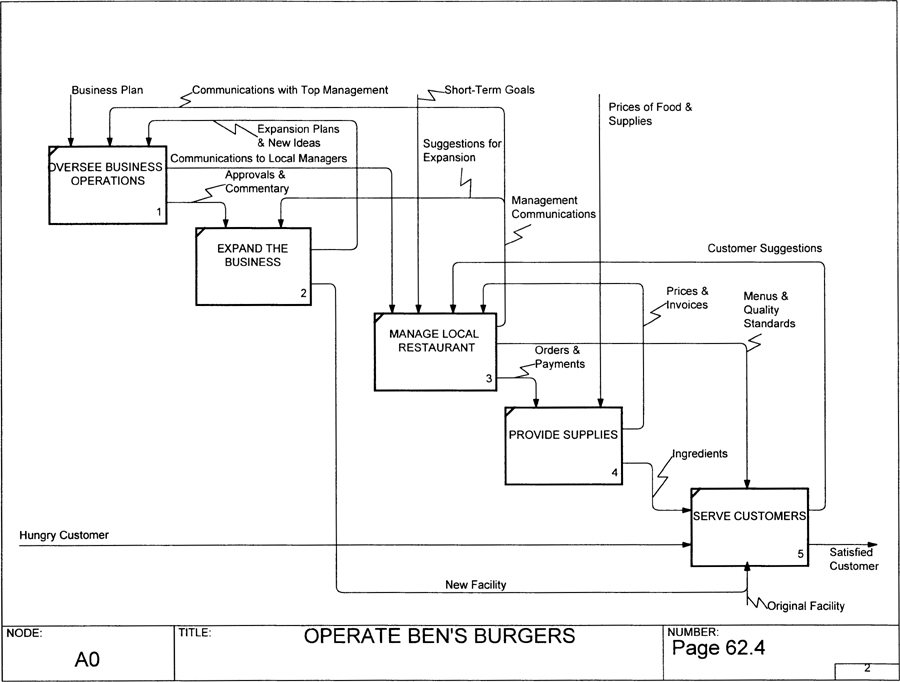
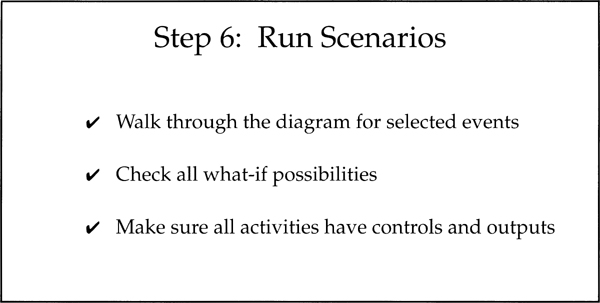
Figure E-13 shows step 5, the way to add arrows to the model. After referring to the list of bundled arrows, connect the boxes (see Figure E-13). First, draw the main path; then, add other interfaces. Consider each activity regarding its various activations: What if incorrect data are included in an input arrow? What feedback is provided to other activities? What individual events could trigger the activity?
Before completing the diagram, the data list is again reviewed to see where each data item is used on the diagram. Finally, review the parent diagram (if any) to see what story was implied. Does the new diagram reflect the same story? In other words, will the reader be surprised when he sees the new diagram versus what he was expecting? The added material is shown in the next five diagrams.
The purpose of the model was to help design the improvements in the restaurant operation. Is there information in the interview notes that is not yet evident on the diagram? Since we generalized the activities and the data pipelines, it is likely that we need to decompose one or more of the activities to bring out the level of detail contained in the interview notes. The questions to be asked are
![]() Do we have enough detail?
Do we have enough detail?
![]() Does the diagram include sufficient detail to serve the purpose?
Does the diagram include sufficient detail to serve the purpose?
![]() Are there questions that cannot be answered from diagram detail?
Are there questions that cannot be answered from diagram detail?
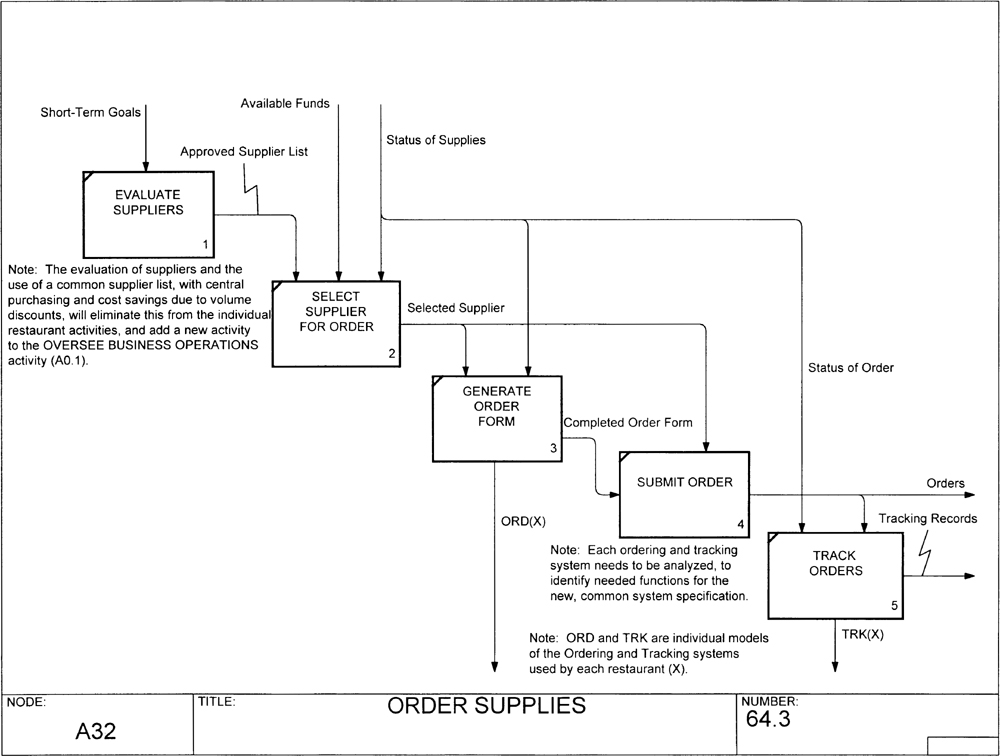
Our review shows that we do need to provide more detail regarding the current ordering and tracking process, since this will be the basis of the new information system requirements specification that we are to provide.
To identify which activities should be decomposed, we need to select the most revealing box for the model’s purpose. In our current scenario, we need to ask where tracking, ordering, and payment are currently. The answer is, activity 3 (MANAGE LOCAL RESTAURANT), which discusses how individual managers run the restaurants. This activity focuses on the individual stores’ methods for ordering and tracking, details which will be essential if a central system is created.
The next step is to decompose activity 3 using the same sequence as above.
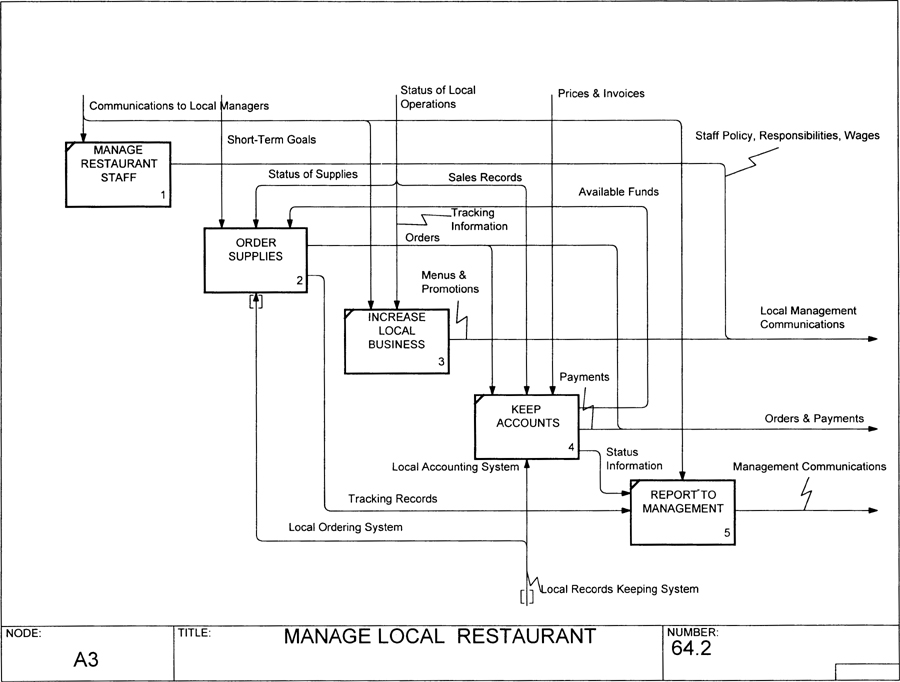
After decomposing activity 3, using the same procedure as with the first diagram, we now decide that there is sufficient detail about the present process to get on with designing the new corporate system. To validate our understanding, we then prepare to run a reader/author review cycle with the experts that were interviewed. But before sending them a copy of the model, we owe it to them to do one final check to catch any errors and oversights. This is the “cleanup” step in which we determine that
![]() sufficient detail is present about the current ordering and tracking process
sufficient detail is present about the current ordering and tracking process
![]() terminology has been generalized to cover decomposition
terminology has been generalized to cover decomposition
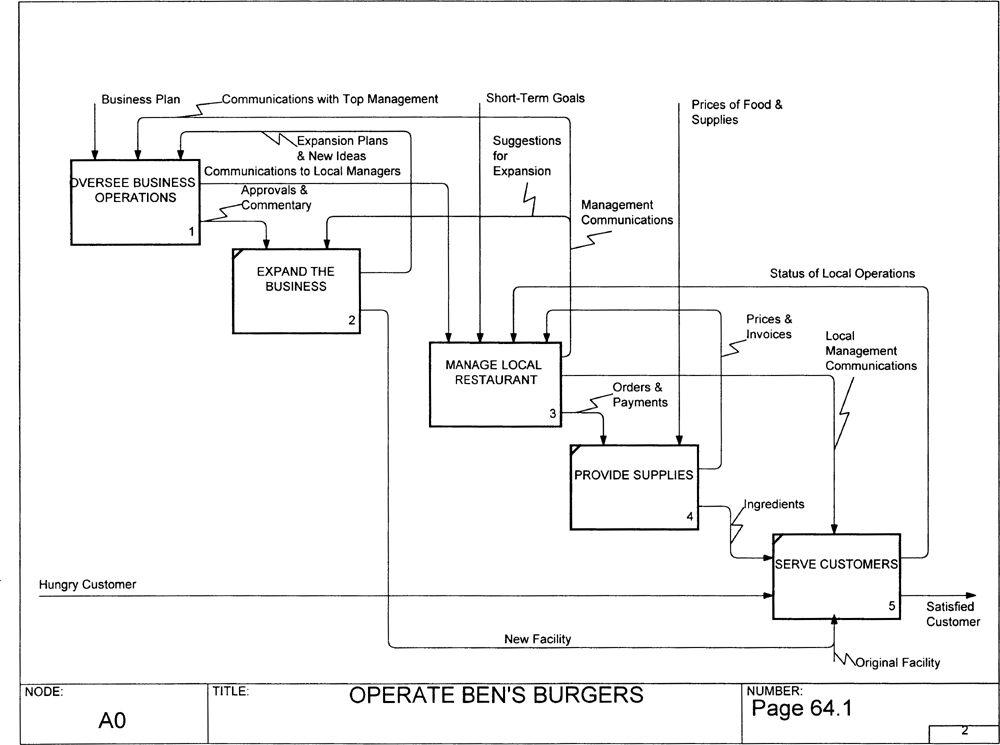
![]() “forced arrows” have been added to the modified parent diagram
“forced arrows” have been added to the modified parent diagram
A typical correction is to add boundary arrows to the parent diagram, since the modeling of the detail should uncover additional use of data that was not obvious from the more general, parent diagram. These are called “forced arrows,” since the decomposition of the parent box forces the arrows to be added to the parent. Actually, instead of forcing additional arrows, we may be able to include the new data in one of the existing pipelines. This potential is considered first to reduce the amount of clutter that we add to the model.
We are not yet ready to release the diagrams as a reader kit. First, a quick completeness and correctness check is made by running events through the diagrams to see if they represent a reasonable story. This may cause additional arrows to be added or names on the boxes or arrows to be changed.
Finally, we must ensure that the rules of IDEFO have been obeyed. Some common software tools include this type of automated check, but we will perform a manual check here. One of the most common corrections involves adding control arrows to boxes that have none. (Recall that each box must have at least one control arrow—a requirement of the rules of IDEFO.) If an activity has no control arrow, we must consider: What controls how this activity works? Does it follow a schedule? Are there company manuals that dictate how it works? Is there a government standard with which it must comply? Did the previous processes result in any data that have a controlling influence on this activity? Are there any human factors that control the activity? The addition of arrows as a result of this scrutiny may then result in additional forced arrows that either must be made compatible with the parent activity’s arrow structure or must be set aside.
We are finally ready for a reader/author review cycle, a kind of walkthrough session. (See Figure E-23.)
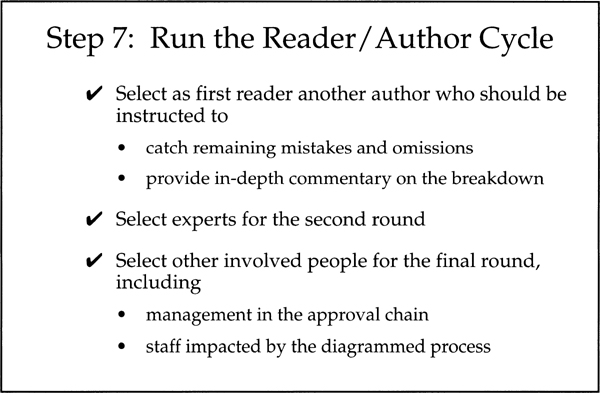
This step first involves either making a reader kit or instructing the software tool to create one automatically. The kit is sent to the set of readers determined by the current review status of the diagrams. If this is the first review (that is, if the diagram is brand-new), then it is usually wise to send the kit to a single reader who is an experienced IDEFO author. Limiting the review to a single reader helps avoid having several readers all catching obvious errors and embarrassing the author. Later reader cycles move up the management hierarchy until the information is the best that the entire group can identify.
This Appendix, through use of the Ben’s Burgers case study and the seven steps of the modeling process, provides a brief overview of what can often be a deeply complex analysis of an enterprise, an analysis process that thanks to IDEFO will almost always be successful.