Appendix B. Sample Models
This Appendix contains several models that serve as examples of good IDEFO practice. The first model is the generic enterprise model (that is, a model that can be used as the starting point for a wide variety of enterprises). The second is the AS-IS enterprise model (baseline for improvement planning), and third is the configuration management model.
Most modelers develop several generic models—one for each type of enterprise. Enterprise characteristics that affect how to model content at the top include whether the enterprise is a commercial or governmental enterprise, and whether it provides products or services. To create a generic enterprise model top, model a well-known enterprise and then generalize it by adjusting the box names and arrow labels so that the same diagram can apply to the broadest possible set of enterprises.
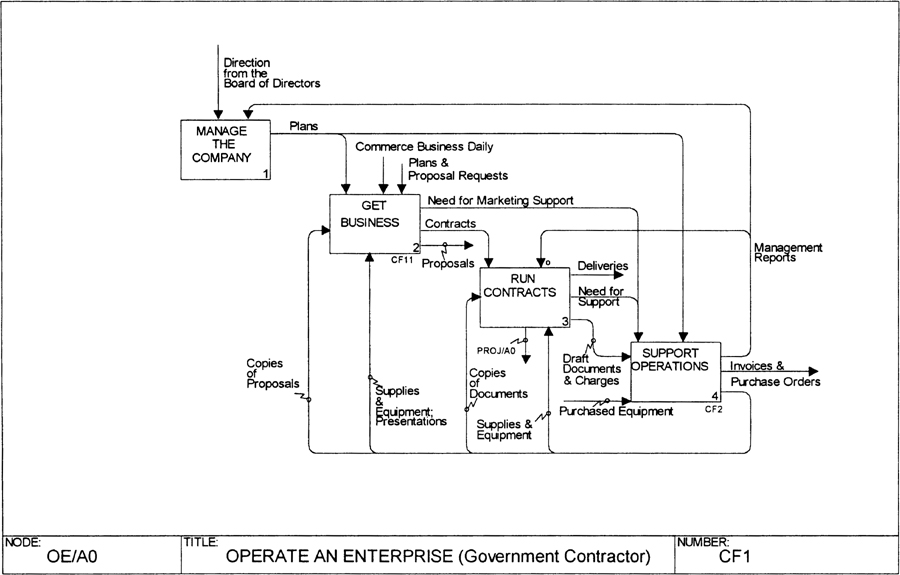
Figure B-1 shows the top diagram of an enterprise model for a government contractor whose area of expertise includes developing DoD software products and providing technical software-related services to DoD offices. This enterprise provides both products and services, and so the same diagram should apply to both types of enterprise. Since the products are software, the model may not be relevant to hardware or hybrid products, and we must keep in mind this potential split. The customer of the enterprise is the DoD, but the model should apply to all government agencies (Federal Aviation Administration, Census Bureau, and so forth) since subcontracting to these organizations should be very similar to DoD subcontracting.
The diagram should apply to commercial enterprises as well as government subcontractors. To test this hypothesis, we examine each box on the diagram to see if it pertains to a commercial enterprise, or whether there is some fundamental function that is missing or extra.
For a diagram to be generic, all of the major elements of an enterprise must be represented, and the box and arrow names must apply to a large variety of enterprises. Furthermore, for the diagram to represent good IDEFO practice, it must be balanced. That is, each box must represent about the same level of importance to the enterprise as the other boxes; one box cannot be trivial while another is complex.
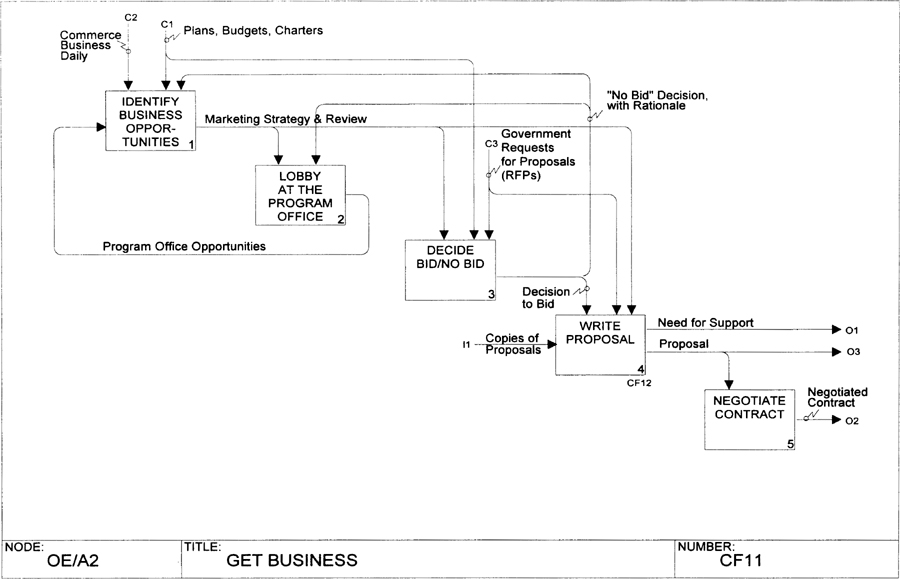
Figure B-1 shows a candidate top-level generic enterprise diagram. By examining each box in order, we see that an enterprise must have a top-management function (see box 1) to make strategic plans, determine the direction and vision of the enterprise, and manage the enterprise’s offices. In a commercial enterprise, a second key element is its marketing and sales function (see box 2). This function is responsible for finding customers, submitting proposals, winning contracts and sales orders, and for continually analyzing market trends and potential new areas of business. At this top level, the model applies to both commercial and government subcontractor enterprises. However, we foresee that this similarity will end when we attempt to decompose the marketing and sales function.
Box 3 represents the primary product or service (technical heart) of the enterprise. This activity provides the principal revenue source for the enterprise. Here, the same function exists in commercial or government subcontractor enterprises, but we anticipate a difference in the model at a fairly general-level breakdown, depending on the type of product or service.
Consider the technical steps required to develop various types of products and services. Clearly, the product design and manufacturing that are needed to produce a hardware product are very different from the less physical activities required to provide a service or develop a software system. Therefore, the next level of breakdown undoubtedly will require a split into hardware product companies versus software and services enterprises. However, the generic approach will need to be applied to at least one more level of decomposition before differences emerge between services and software development enterprises.
Since there is a basic difference in the sub-functions depending on the product or service, the model does not contain a decomposition diagram for box 3. Instead, a call arrow shows that the reader should turn to model “PROJ/AO” for one example of a breakdown of box 3. Other breakdowns may be listed beside the PROJ call arrow in the future, when these alternatives are developed.
Box 4 includes all of the support-level activities of an enterprise. From the input and output arrows, we see that this support includes technical publications and presentations, purchasing and invoicing, management information systems (MIS), contracting, accounting and payroll, and human resources (personnel). All enterprises need these support functions, and by grouping them into a generic support function, the modeler can minimize the unique modeling portion, model the common elements, and apply them to a broad spectrum of enterprises using only a minimum of customization effort.
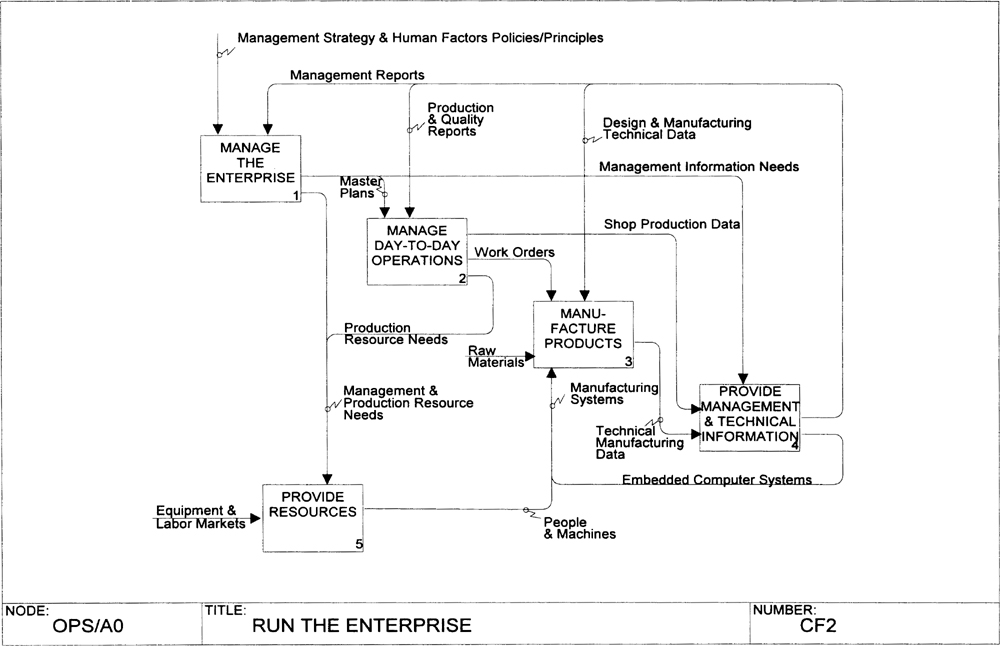
Here, one may question the diagram’s balance, since box 4 and several other boxes include a larger portion of the enterprise than is desirable. The answer to the question, “Should a box be split into several boxes?” depends on the importance of the specific box’s activity in pursuing enterprise improvements during BPR. Taking box 4 as an example, we can see that the number of arrows entering and leaving the box is prohibitively large, indicating an unusual amount of back and forth communication between box 4 and the other enterprise functions, thereby making the diagram difficult to understand.
Perhaps business and accounting (serving finance, contracting, and accounting functions), resources (human as well as physical), and publications should replace box 4, becoming boxes 4, 5, and 6. Key questions to ask the management of the enterprise are, “Which version communicates best? Which is most useful for the BPR effort?” Determine whether management considers these support functions as critical to BPR as they are to the enterprise management and marketing and sales functions.
From a purely technical and communications perspective, the change results in a rather complex AO diagram, but it is more evenly balanced than the prior version. Figure B-2 shows a candidate revised diagram with box 4 split into three parts, as discussed. The choice is left up to the reader as to which version he prefers to use for the top of his enterprise model.
In reviewing these models, consider whether the functions of a generic commercial enterprise model can be applied to government (agency or military) enterprises, since government agencies have different control activities and do not have a marketing element, or whether a generic government enterprise top diagram is needed, which can be applied to a large number of government offices and military organizations.
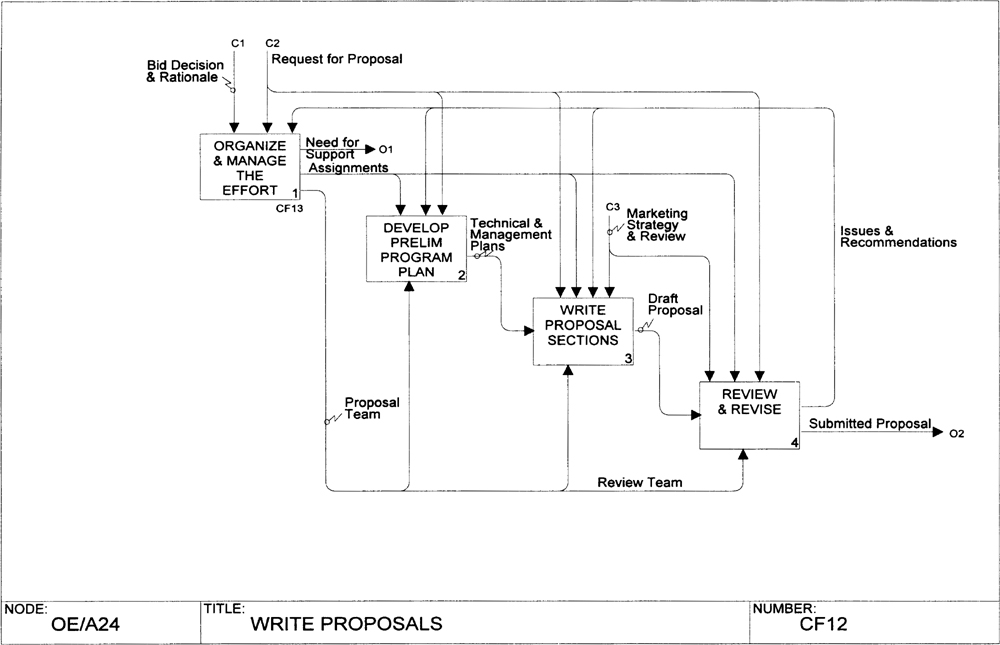
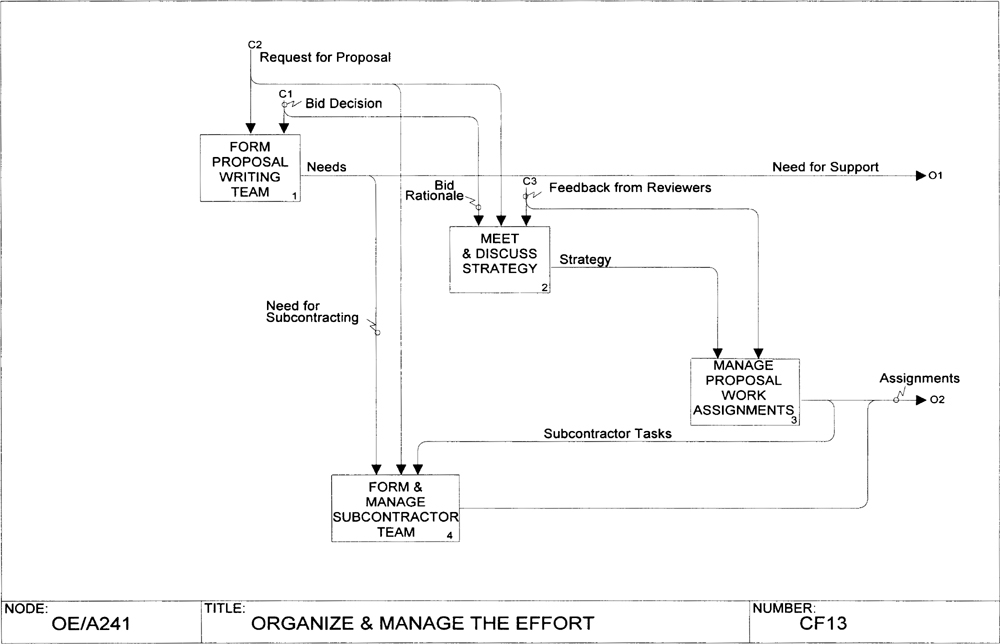
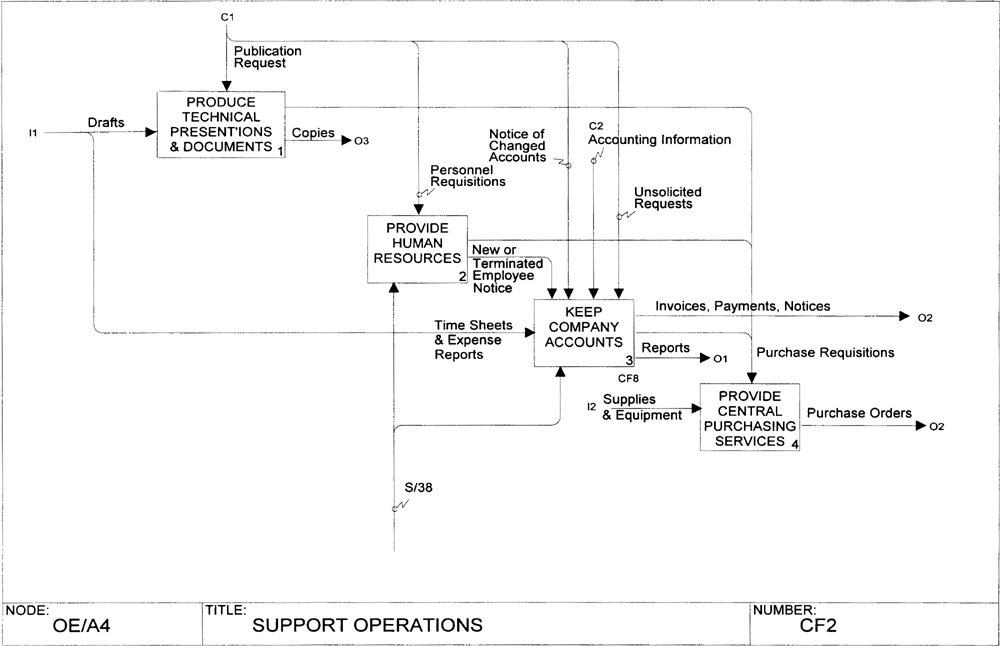
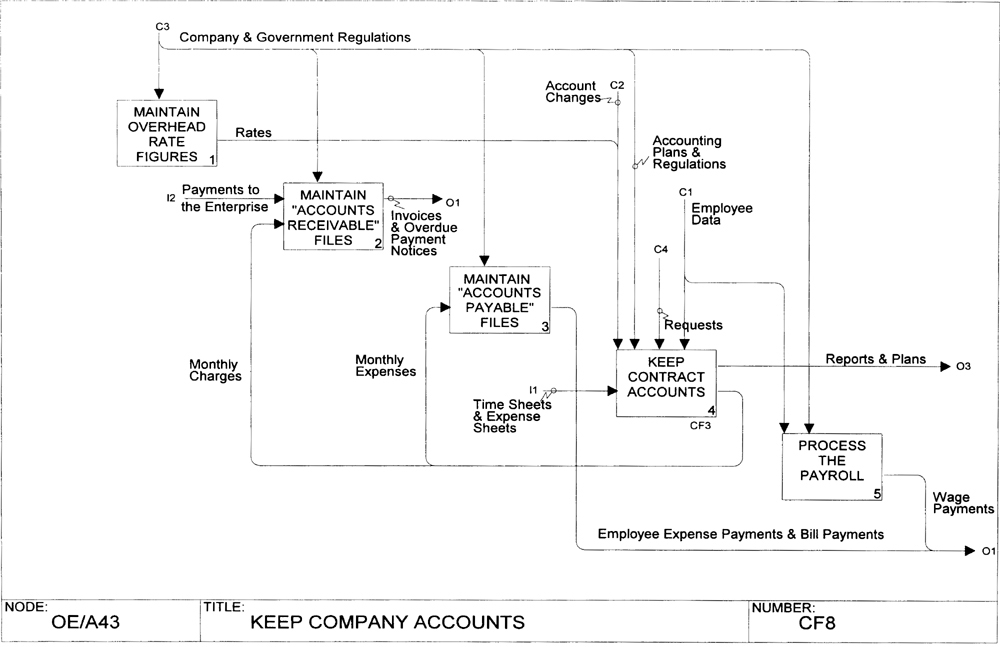
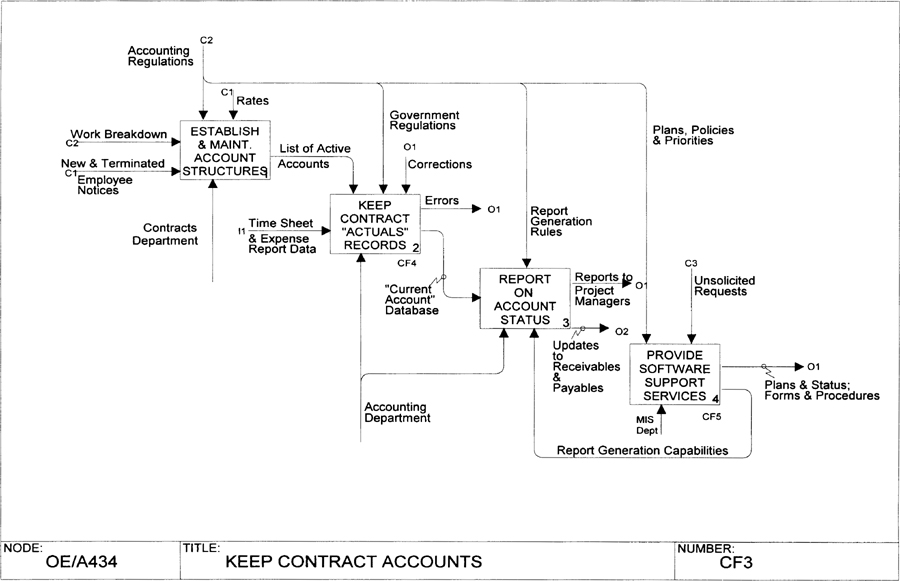
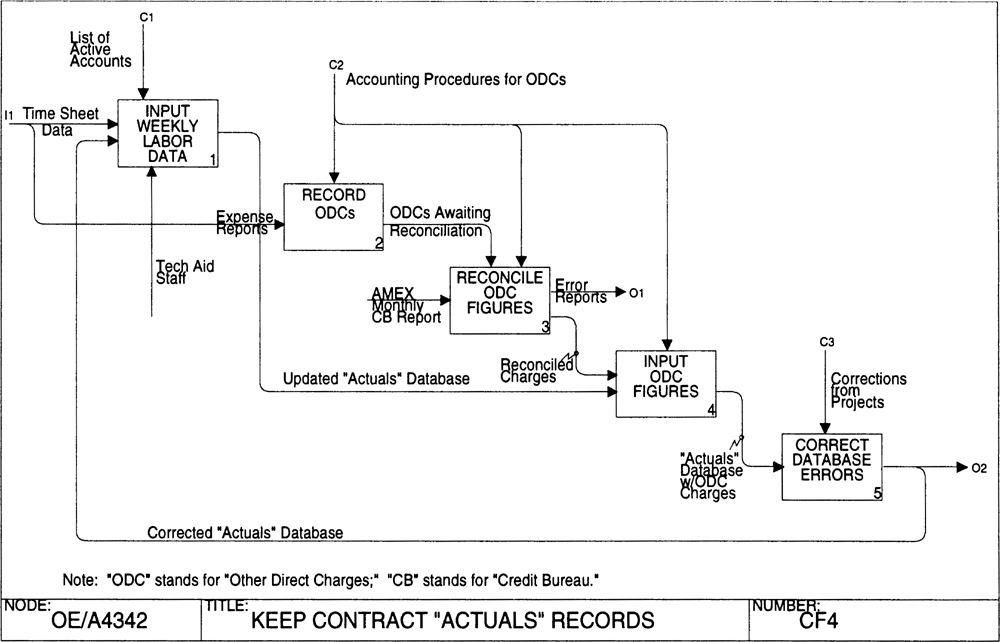
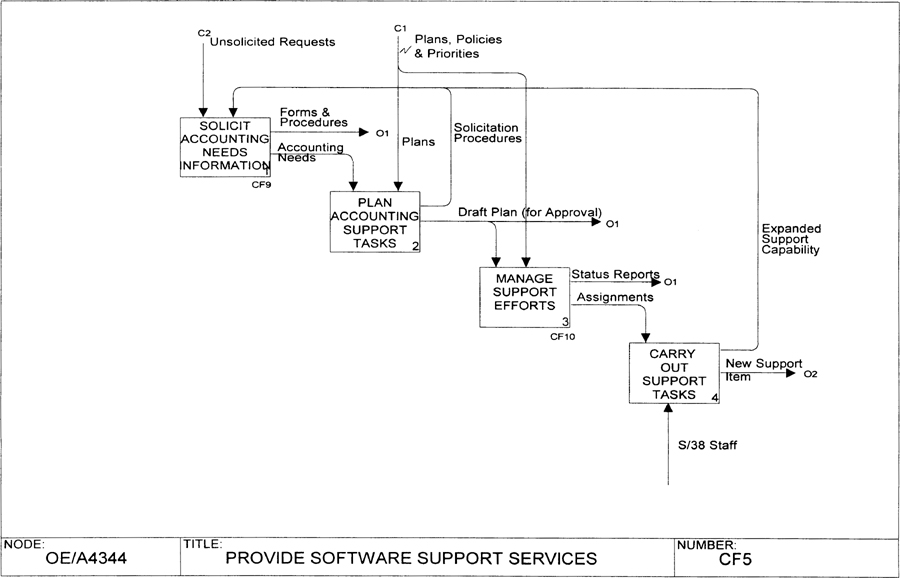
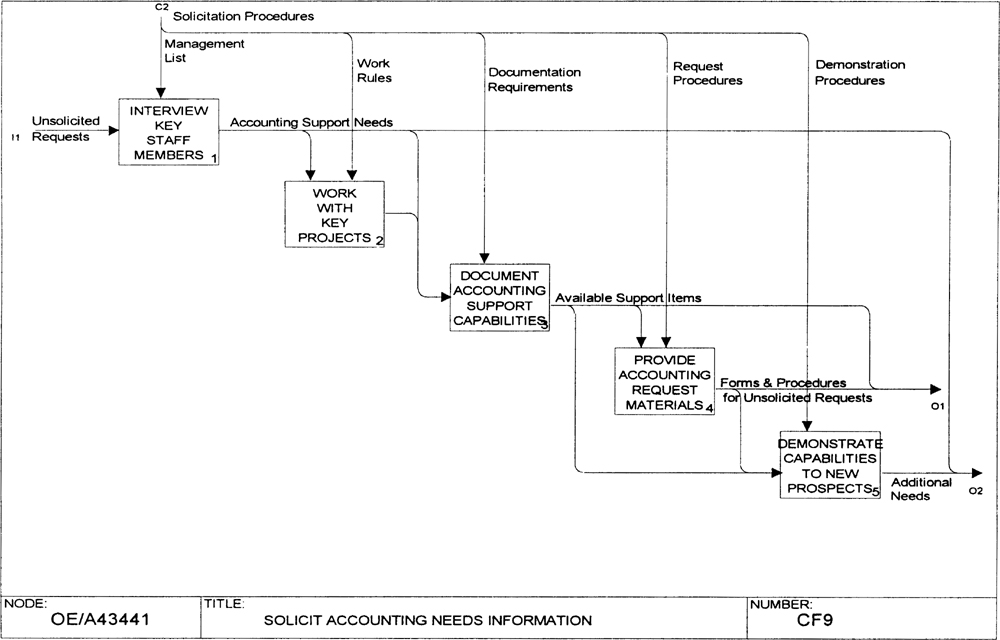
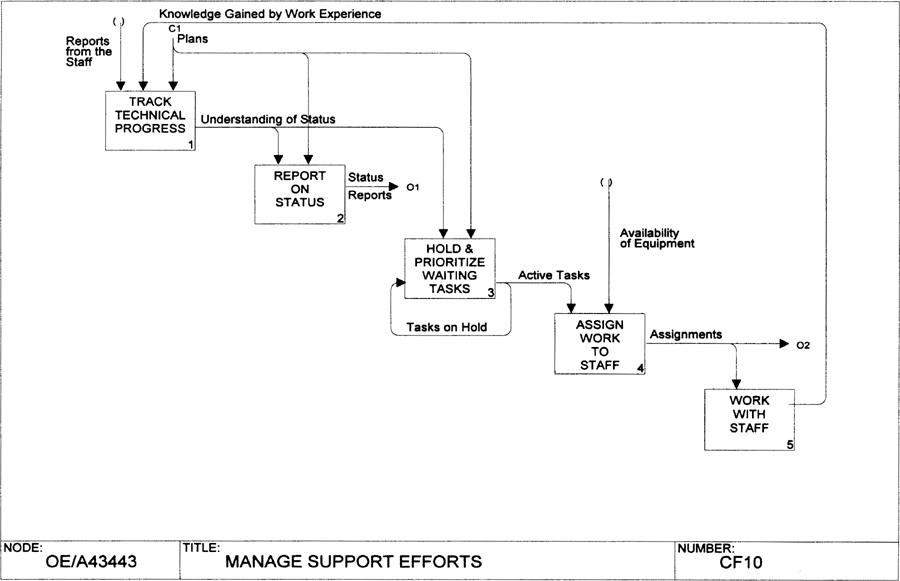
Figures B-3 through B-12 show an AS-IS enterprise model, a sanitized version of an actual BPR AS-IS model that was used to plan improvements in a five-hundred person system integration and development firm. With fifteen field offices across the United States, the firm services the Department of Defense as its largest market. These models illustrate the use of IDEFO discussed in the main body of this book.
In Figure B-13 we have a configuration management model, a one-diagram summary of the military standard MIL-STD-483A for software configuration management, illustrating a function-oriented breakdown in which each box represents a unique functional aspect of software configuration management. That is, the job of software configuration management consists of the five kinds of activities shown in the boxes: planning, identifying the pieces of the system, maintaining baseline versions of the system, providing status accounting reports to project management, and controlling and recording changes. No matter when one of these types of activities occurs, the box shown on the diagram is activated.
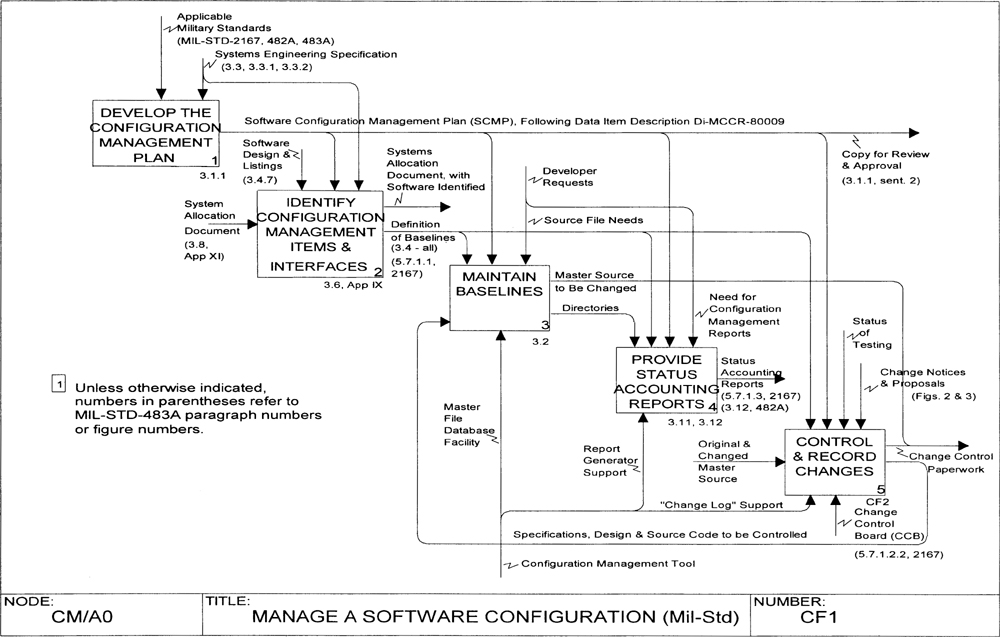
This figure contrasts to a process or timing-based breakdown in which activities that happen at different points in time (perhaps employing different staff) are shown in separate boxes. This model is particularly useful for pinpointing staff responsibilities and variations in the process that depend on the time at which the process is invoked (for example, initial design, detailed design, or design change).
The function-based diagram of Figure B-13 is clearly much more concise than the ten process-based diagrams used in Figures B-3 through B-12 to cover the same topic. The function-based diagram, the original form for an IDEFO and SADT model, has the additional advantage that similarities of activations are identified, and a single support system can be developed that satisfies all the requirements of the function, whenever and whoever performs the function (for example, a single design system for all phases of design).
The model includes annotations on the arrows and below the boxes that identify paragraph numbers in various military standards, so that the reader may review the configuration management functions as well as turn to the referenced paragraph to see the detailed definition, arrow contents, or process requirements.
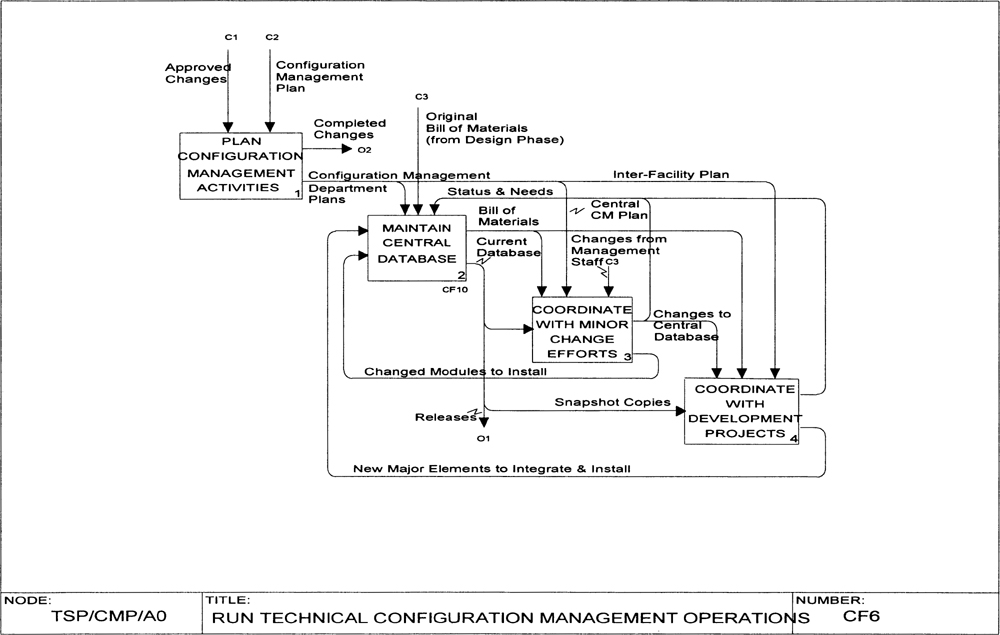
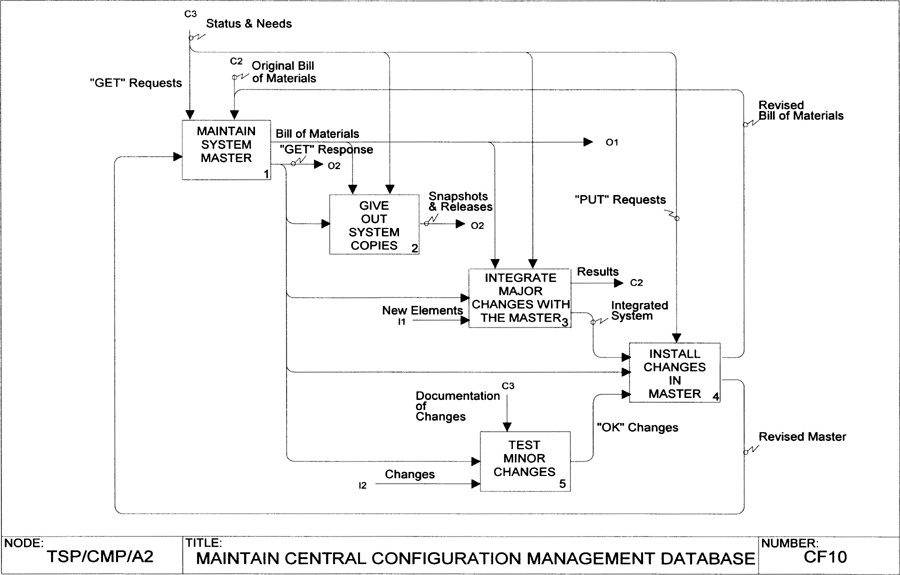
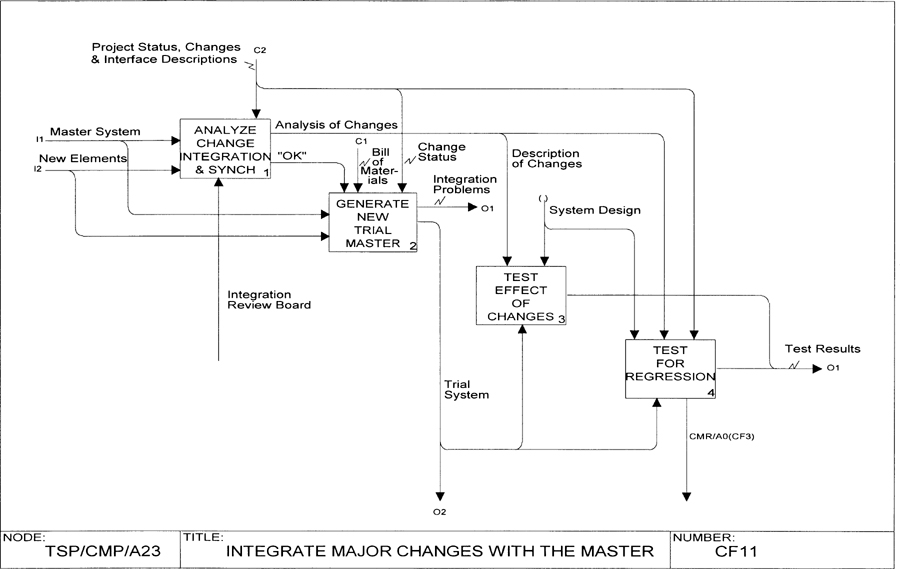
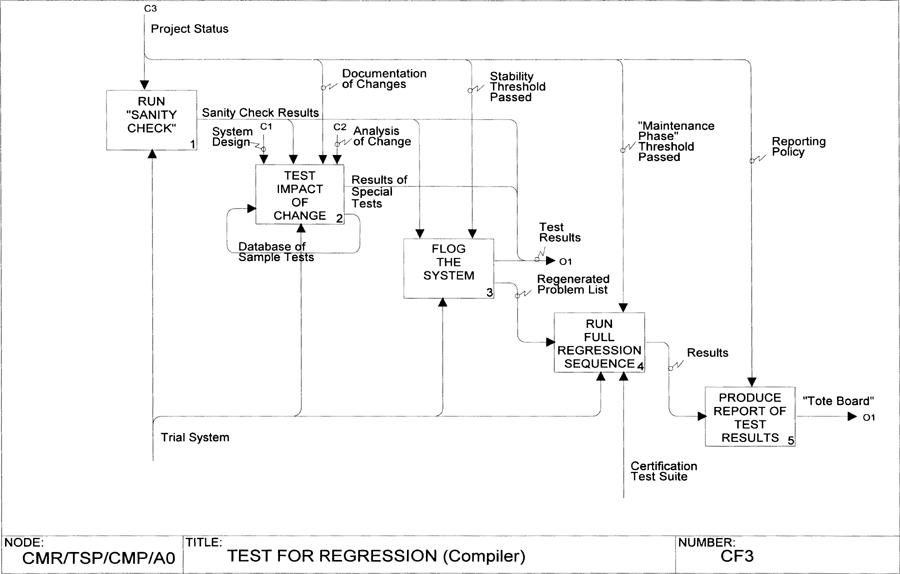
The final example consists of four diagrams (Figures B-14 through B-17) extracted from a configuration manager’s view of his job. Note that the functions defined in the functional version (Figure B-13) are included here, but that the activities include coordination with development projects, providing snapshot copies of selected versions of systems as requested. This model illustrates the effect of viewpoint on IDEFO modeling. It resulted from actual interviews with the configuration management manager and his experience in providing support to a project involving about fifty programmers in the development of a large software system.